CRHR2 as Potential Pharmacological Targets for
Antiobesity Drugs
Zhihua Jiang*, Jennifer J. Michal, Galen A. Williams, Tyler F. Daniels, Tanja Kunej
Department of Animal Sciences, Washington State University, Pullman, Washington, United States of America
Background. Obesity now constitutes a leading global public health problem. Studies have shown that insulin resistance affiliated with obesity is associated with intramyocellular lipid (IMCL) accumulation. Therefore, identification of genes associated with the phenotype would provide a clear target for pharmaceutical intervention and care for the condition. We hypothesized that urocortin 3 (UCN3) and corticotropin-releasing hormone receptor 2 (CRHR2) are associated with IMCL and subcutaneous fat depth (SFD), because the corticotropin-releasing hormone family of peptides are capable of strong anorectic and thermogenic effects. Methodology/Principal Findings. We annotated both bovine UCN3 and CRHR2 genes and identified 12 genetic mutations in the former gene and 5 genetic markers in the promoter region of the latter gene. Genotyping of these 17 markers on Wagyu6Limousin F2 progeny revealed significant associations between promoter polymorphisms and SFD (P = 0.020320.0685) and between missense mutations of exon 2 and IMCL (P = 0.005520.0369) in the bovineUCN3gene. The SFD associated promoter SNPs caused a gain/loss of 12 potential transcription regulatory binding sites, while the IMCL associated coding SNPs affected the secondary structure ofUCN3mRNA. However, none of five polymorphisms inCRHR2gene clearly co-segregated with either trait in the population (P.0.6000).Conclusions/Significance.BecauseUCN3
is located on human chromosome 10p15.1 where quantitative trait loci for obesity have been reported, our cross species study provides further evidence that it could be proposed as a potential target for developing antiobesity drugs. None of the markers inCRHR2 was associated with obesity-type traits in cattle, which is consistent with findings in human. Therefore, CRHR2 does not lend itself to the development of antiobesity drugs.
Citation: Jiang Z, Michal JJ, Williams GA, Daniels TF, Kunej T (2006) Cross Species Association Examination of UCN3 and CRHR2 as Potential Pharmacological Targets for Antiobesity Drugs. PLoS ONE 1(1): e80. doi:10.1371/journal.pone.0000080
INTRODUCTION
Obesity has increased at a fast rate in recent years and is now a worldwide public health problem. The major consequence of overweight and obesity is that they are associated with more than 30 medical conditions, which cause approximately 300,000 deaths and total medical expenditures (direct and indirect) of $139 billion annually in the USA alone [1]. Insulin resistance, a characteristic of obesity, prevents insulin from taking the sugar from food and distributing it throughout the body for energy. Many studies have clearly indicated that intramyocellular accumulation of triglycerides is a major contributor to insulin resistance [2]. Therefore, identifi-cation of genes associated with intramyocellular lipid accumulation would provide a clear target for pharmaceutical intervention and care for obesity and its related conditions, such as high blood pressure, type 2 diabetes, coronary heart disease, some types of cancer, poor female reproductive health and psychological disorders. Urocortin 3 (UCN3) and corticotropin-releasing hormone receptor 2 (CRHR2) are members of the corticotropin-releasing hormone (CRH) family of peptides. UCN3 binds selectively to CRHR2 [3] and both are co-expressed throughout the central nervous system, such as in the ventromedial hypothalamic nucleus, lateral septum and bed nucleus of the stria terminalis [4], as well as in the gastrointestinal tract [5]. Both UCN3 and CRHR2 are, therefore, thought to play a central role in appetite and gastro-intestinal motor regulation. Indeed, when exposed to a high fat diet,CRHR2-mutant mice consumed significantly more food while maintaining the same body weight as their wild-type littermates [6]. Intracerebroventricular injections of UCN3 were found to reduce appetite by suppressing food intake in the freely-fed rat [7]. On the other hand, there is increasing evidence supporting the involvement of these two peptides in the regulation of energy
homeostasis and in mediating the anorexic effect of CRH at the adipose level. For example, Seres and colleagues [8] found that
both UCN3 and CRHR2 are expressed in human visceral and
subcutaneous adipose tissue. Obviously, the local production of these two peptides within the adipose tissue indicates their direct involvements in fat cell function in addition to their central effects on weight regulation. In particular, Doyon and colleagues [9] concluded that CRHR2 could be a potential target for the development of an antiobesity drug. Thus, we hypothesized that genetic polymorphisms ofUCN3andCRHR2genes are associated with intramyocellular lipid accumulation (IMCL) and subcutane-ous fat depth (SFD) in mammals. In order to test the hypothesis, we annotated bovine UCN3 and CRHR2 genes and identified a total of 17 genetic polymorphisms for an association study. Statistical analysis using the general linear model (GLM) pro-cedure of SAS and quantitative transmission-disequilibrium test
Academic Editor:Neil Hall, Institute for Genomic Research, United States of America
ReceivedOctober 7, 2006;AcceptedNovember 14, 2006;PublishedDecember 20, 2006
Copyright:ß2006 Jiang et al. This is an open-access article distributed under the terms of the Creative Commons Attribution License, which permits unrestricted use, distribution, and reproduction in any medium, provided the original author and source are credited.
Funding:Agricultural Research Center, Washington State University, and Merial Ltd. supported this project.
Competing Interests:The authors have declared that no competing interests exist.
(QTDT) revealed that UCN3gene, but not its receptor CRHR2 gene, is significantly associated with both intramyocellular and subcutaneous lipid accumulation in Wagyu6Limousin F2crosses.
MATERIALS AND METHODS
Animals and phenotypic traits
A Wagyu6Limousin reference population was developed, in-cluding 6 F1bulls, 113 F1dams and,250 F2progeny [10]. The
Japanese Wagyu breed of cattle has been traditionally selected for high IMCL accumulation (measured as marbling score with an average of 8.52), whereas the Limousin breed has been selected for heavy muscle, which leads to low IMCL accumulation (average marbling score less than 4.78) [11]. The difference in IMCL accumulation between these two breeds makes them very unique for mapping QTLs for the trait. Beef marbling is the term commonly used to describe the appearance of white flecks or streaks of fat between the muscle fibers in meat, which is essentially equivalent to IMCL accumulation measured in humans. Beef marbling score was a subjective measure of the amount of IMCL in thelongissimusmuscle based on USDA standards (http://www. ams.usda.gov/). Subcutaneous fat depth (SFD) was measured at the 12–13th rib interface perpendicular to the outside surface at a point three-fourths the length of the longissimus muscle from its chine bone end. The marbling scores for IMCL ranged from 4 to 9.5 and SFD varied from 0.1 to 1.3 inches in the population.
Sequence annotation and primer design
We determined the genomic organization of bovine UCN3 and
CRHR2 by aligning a bovine cDNA sequence (BC114855) with
a bovine genomic DNA contig (AAFC03043460) for the former gene, and aligning the human mRNA sequence (NM_001883) with a bovine genomic DNA contig (AAFC03056271) for the latter gene. Three pairs of primers were designed to target the promoter (forward–59GGG GCT GCA CCA AGC AAA TGT CAA C39and reverse–59TCT ACC CTT CTT CCT GGA GCC AAC39), non-coding exon 1 (forward – 59AGG TCT GGG AGA GAA GGT GGG TAG39and reverse – 59AAA CAC AGA CAT TGA CGG TTC AGC39) and coding exon 2 (forward – 59CTG AAC TTG CAC AAA GCC TGG TAG39and reverse – 59CCC AGC CTC CTC CTC TAC TTC TTC39) in theUCN3gene. An additional two pairs of primers were designed to amplify products in the promoter (forward – 59TGA GAC TGG AGC ACA CAA ACA CAG39and reverse – 59CAA GTG TGG AGG AGC TGA AAA CCT39) and exon 1 region (forward – 59TCC TCT CCG CTA AGG TCC AGA CT39and reverse – 59AGG AAC ACT CAC GGG TCG TGT TAT39) in the bovine CRHR2 gene, respectively.
Polymorphism detection and genotyping assay
development
Approximately 50 ng of genomic DNA each from six F1bulls were
amplified in a final volume of 10mL that contained 12.5 ng of each primer, 150mM dNTPs, 1.5 mM MgCl2, 50 mM KCl,
20 mM Tris-HCl and 0.25 U of Platinum Taq polymerase (Invitrogen, Carlsbad, CA). The PCR conditions were carried out as follows: 94uC for 2 min, 32 cycles of 94uC for 30 sec, 63uC for 30 sec and 72uC for 30 sec, followed by a further 5 min extension at 72uC. PCR products were then sequenced for polymorphism detection on an ABI 3730 sequencer in the Laboratory for Biotechnology and Bioanalysis (Washington State University) using a standard protocol. The same PCR product
direct sequencing approach was also used to genotype the polymorphisms on all animals.
Data analysis
The estimates for degrees of Hardy-Weinberg equilibrium within each mutation and linkage disequilibrium between mutations and selection of tagging genetic polymorphisms in each of bovine
UCN3 and CRHR2 genes were performed using the
HAPLO-VIEW program [12]. The phenotypic data for both IMCL and SFD measurements were previously adjusted for year of birth, sex, age (days), live weight (kilograms), or fat depth (inches), as appropriate. The adjusted phenotypes were then used in a sub-sequent association analysis using the GLM (general linear model) procedure of SAS v9.1 (SAS institute Inc., Cary, NC). Pair-wise comparisons of least squares means were performed using a protected t-test. Additionally, quantitative transmission disequi-librium test (QTDT) [13] was performed to further examine the association between the tagging mutations and adjusted obesity-related phenotype data.Pvalue,0.05 was considered statistically significant after Bonferroni correction. For significantly associated mutations, the MatInspector web server [14] was used to screen potential transcriptional regulatory binding site changes caused by promoter polymorphisms, while the Mfold web server [15] was used to predict mRNA secondary structure changes caused by coding polymorphisms.
RESULTS
Genomic organization of the bovine
UCN3
and
CRHR2
genes
BLAST searches using the cDNA sequence of the humanUCN3 gene (NM_053049) as a reference retrieved three bovine ortholo-gous cDNA sequences from the GenBank database. The longest cDNA sequence BC114855 with 1,404 bp was used and retrieved one genomic DNA sequence (AAFC03043460) of the same gene from the 7.156bovine genome sequence database. Alignment of both cDNA and genomic DNA sequences determined the genomic organization of the bovine UCN3 gene. Like all four humanCRHparalogs, the bovineUCN3gene has two exons and one intron (Figure 1).
For the bovineCRHR2gene, a BLAST search using the human mRNA sequence (NM_001883) retrieved three bovine ortholo-gous ESTs (BI849955, DV873120 and CK774717), but they could not form a full-length cDNA sequence for the bovine gene. Fortunately, one bovine genomic DNA contig (AAFC03056271) from the 7.156bovine genome sequence database was obtained using the human cDNA sequence, and alignment of the human cDNA sequence and the bovine genomic DNA sequence unraveled the genomic organization of the bovineCRHR2gene, including the promoter region. The genomic organization ofCRHR2gene is also conserved in cattle, which consists of 12 exons and 11 introns (Figure 2).
Single and multiple nucleotide polymorphisms
In the bovine UCN3 gene, the promoter region harbors one multiple nucleotide polymorphism (MNP) and five single nucle-otide polymorphisms (SNPs), while exons 1 and 2 contain two and four SNPs, respectively (Figure 1). The MNP has two homozygous alleles of 10 bp and 5 bp, i.e., AAFC03043460.1:g.8272-8281AATAATAAAT.GGAGC. The remaining eleven SNPs are
AAFC03043460.1:g.8208C.T, g.8265C.T, g.8287T.C,
g.8412A.G, g.8426T.A, c.8786C.T, g.9074T.C, c.12609C.T,
Figure 1.Genomic organization and haplotype analysis in the bovineUCN3gene. Noncoding exon 1, partial non-conding exon 2 and 39untranslated region are marked by white boxes and coding exon 2 by a black box. Pairwise linkage disequilibrium relationship for 12 mutations is illustrated based on r2measurements. The mutation g.8272A
.B represents AAFC03043460.1:g.8272-8281AATAATAAAT.GGAGC. doi:10.1371/journal.pone.0000080.g001
Figure 2.Genomic organization and haplotype analysis in the bovineCRHR2 gene. Coding exons are marked by black boxes. Pairwise linkage disequilibrium relationship for 5 mutations is illustrated based on r2measurements. The mutation g.2072A.B represents AAFC03056271.1: g.33947-33964TGAATCCAGCCTGAGTTG.CTTTGTCTTGAG.
(Figure 1). Among these five coding SNPs, two (c.12667T.Gand
c.12669C.A) are missense mutations and both occur in one codon
(codon 59), changing phenylalanine (TTC) to valine (GTA) at the preprohormone level of the UCN3 peptide. One MNP and four SNPs were detected in the promoter region of bovine CRHR2 gene (Figure 2). The MNP possesses two homozygous alleles of AAFC03056271.1:g.33947-33964TGAATCCAGCCTGAGTTG.
CTTTGTCTTGAG with 18 bp in one allele and 12 bp in
other allele. Four SNPs include AAFC03056271.1:g.33704A.G,
g.33803C.T, g.34007C.A and g.34017G.C, respectively. No
poly-morphism was detected in the exon 1 region of bovineCRHR2gene.
Haplotype analysis and selection of tagging
mutations
In the bovineUCN3gene, sequencing of 6 F1sires indicated that
four SNPs in the promoter region: g.8208C.T, g.8287T.C,
g.8412A.G and g.8426T.A form two haplotypes: CTAT and
TCGA. Two SNPs in the exon 1 and flanking regionsc.8784C.T
andg.9072T.Calso appear in two haplotypes:CCandTTin the
population, while all four SNPs (c.12609C.T, c.12621T.C,
c.12667T.Gandc.12669C.A) in coding exon 2 region have no
historical recombination in eitherCTTCorTCGAhaplotypes. The lack of historical recombination among SNPs in each of these regions described above was further confirmed by the HAPLO-VIEW program on genotype data of all F2 progeny (Figure 1).
Therefore, g.8208C.T, g.8265C.T,
g.8272-8281AATAATA-AAT.GGAGC, c.8784C.T, and c.12669C.A were chosen as
tagging mutations for association analysis. Among five mutations in the promoter region of bovine CRHR2 gene, HAPLOVIEW indicated AAFC03056271.1:g.33704A.G, g.34007C.A and
g.34017G.C have no-historical recombination by forming two
haplotypes ofGACandACG(Figure 2), and thus three mutations including AAFC03056271.1:g.33704A.G, g.33803C.T, and
g.33947-33964TGAATCCAGCCTGAGTTG.CTTTGTCTTGAG
were selected as tagging mutations for association analysis.
Association analysis of
UCN3
and
CRHR2
genes with
IMCL and SFD
Two statistical approaches–the general linear model (GLM) and the quantitative transmission disequilibrium test (QTDT) were used to detect associations between genetic polymorphisms in both bovineUCN3 and CRHR2 genes with IMCL and SFD in a reference population of Wagyu6Limousin F2 cross cattle
(Table 1). Overall, the reference population had an average SFD of 0.394 inches with a standard deviation of 0.18 inches. In the bovineUCN3 gene, GLM analysis indicated a suggestive associ-ation between genotype at g.8208C.T and SFD (P = 0.0685), while the QTDT test indicated a significant association between the genotype and SFD (P = 0.0203; Table 1). Animals with TT genotypes had 0.086 (P = 0.0045) and 0.056 inches (P = 0.0259)
Table 1. Associations ofUCN3andCRHR2genes with IMCL and SFD
. . . .
IMCL (in scores) SFD (in inches)
Maker Genotype N LSM6S.E. PGLM PQTDT LSM6S.E. PGLM PQTDT
UCN3
8208C.T CC 52 5.92560.135a 0.6180 0.7053 0.433
60.021a 0.0685 0.0203
CT 132 5.98660.084a 0.403
60.013a
TT 54 5.69560.132a 0.347
60.021b
8265C.T CC 158 5.93160.077a 0.5138 0.8549 0.407
60.012a 0.8692 0.5785
CT 75 5.92060.112ab 0.375
60.018a
TT 5 5.04260.435b 0.383
60.070a
8272A.B* AA 122 5.80260.087a 0.1981 0.8872 0.401
60.014a 0.9985 0.9739
AB 102 6.08160.095b 0.396
60.016a
BB 14 5.57760.259ab 0.365
60.042a
8786C.T CC 170 5.81860.076a 0.1306 0.0629 0.393
60.012a 0.9977 0.9794
CT 64 6.20960.123b 0.412
60.020a
TT 4 5.91260.494ab 0.415
60.080a
12669C.A AA 84 5.66560.107a 0.0369 0.0055 0.369
60.017a 0.4036 0.2351
CA 114 6.00560.092b 0.415
60.015b
CC 38 6.21460.159b 0.416
60.026ab
CRHR2
33704A.G AA 31 5.80760.178a 0.9534 0.9998 0.392
60.028a 0.8251 0.6342
AG 127 5.97860.089a 0.390
60.014a
GG 77 5.88660.114a 0.418
60.018a
33803C.T CC 196 5.90160.072a 0.7977 0.7951 0.396
60.011a 0.8625 0.8617
CT 39 6.04460.159a 0.416
60.025a
33947A.B* AA 18 6.00160.238a 0.9606 0.9608 0.419
60.037a 0.9969 0.9600
AB 104 5.85860.099a 0.399
60.016a
BB 113 5.97460.058a 0.399
60.015a
*
less subcutaneous fat than animals with CC and CT genotypes, which account for 0.48 and 0.31 standard deviations for the trait, respectively (Table 1).
Overall, IMCL accumulation, described by marbling scores, for all F2 progeny averaged 5.916 with a standard deviation of 1
marbling score. Interestingly, the genotype effects on IMCL accumulation increased in significance with mutations closer to the coding regions of the UCN3 gene (Table 1). The 12669C.A marker was significantly associated with IMCL (P = 0.0369 for the GLM analysis and P = 0.0055 for the QTDT test, respectively).AA animals were much leaner, with 0.549 and 0.340 lower marbling scores, respectively than CC animals (P = 0.0045) and CT heterozygotes (P = 0.0164) (Table 1). Unfortunately, none of the markers in the bovineCRHR2 gene were associated with either IMCL or (P.0.60) (Table 1).
Functional characterization of promoter and coding
polymorphisms associated with SFD and IMCL
As indicated above, only mutations in the bovineUCN3gene were significantly associated with either trait in the referencepopula-tion. Therefore, it might be interesting to characterize how the promoter polymorphisms affect transcriptional regulatory binding sites and how coding polymorphisms have an impact on the mRNA secondary structure. In the promoter region of the bovine UCN3gene, four polymorphisms, AAFC03043460.1:g.8208C.T,
g.8287T.C, g.8412A.G and g.8426T.A form two haplotypes:
CTAT and TCGA. MatInspector [14] detected a remarkable difference in the number of potential transcriptional regulatory binding sites between these haplotypes: ten for the former haplotype, while only two for the latter haplotype (Figure 3). These twelve transcriptional binding sites were for TFCP2 (transcription factor CP2), NFAT5 (nuclear factor of activated T-cells 5, tonicity-responsive), NKX3-1 (NK3 transcription factor related, locus 1), FOXD1 (forkhead box D1), BAPX1 (bagpipe homeobox homolog 1), ISL1 (ISL1 transcription factor, islet-1), DBP (D site of albumin promoter binding protein), EGR2 (early growth response 2), CART1 (cartilage paired-class homeoprotein 1), POU4F1 (POU domain, class 4, transcription factor 1), ARID3A (AT rich interactive domain 3A) and MSX1 (msh homeobox homolog 1)/MSX2 (msh homeobox homolog 2), respectively (Figure 3).
Figure 3.Nucleotide sequence of the proximal promoter region of the bovineUCN3gene. Primer and partial non-coding exon 1 sequences are shadowed by pink and bright green color, respectively. The putative transcription start site is numbered as+1. Four polymorphic sites that were associated with SFD are bold and shadowed by turquoise color. Potential transcription regulatory binding sites for TFCP2, NFAT5, NKX3-1, FOXD1, ISL1, DBP, CART1, POU4F1, ARID3A and MSX1/MSX2 are associated with haplotypeCTAT, while only binding sites for BAPX1 and EGR2 are linked to haplotypeTCGA.
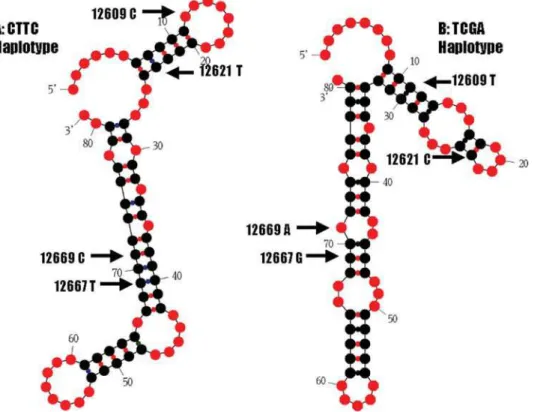
Four coding SNPs in exon 2 of bovine UCN3 gene: AAFC03043460.1:c.12609C.T, c.12621T.C, c.12667T.G and
c.12669C.Aalso form two haplotypes:CTTCorTCGA. We used
the Mfold program [15] to predict how these two haplotypes affect mRNA secondary structure. In the first run, a complete coding sequence of 501 bp for the preprohormone was used in the analysis. The sequences with both haplotypes were folded with Mfold in a locally automated manner. The complete coding sequence containing CTTC haplotype yielded a total of 13 secondary structures, while the sequence with theTCGAhaplotype produced a total of 16 secondary structures. However, there was a difference in single-strandedness counts (ss-counts) between two haplotypes. The ss-counts measure the number of times each nucleotide is unpaired across all predicted secondary structures. For the former haplotype, 122 of 501 bp had zero ss-counts; while for the latter haplotype, 100 of 501 had zero ss-counts across all predicted secondary structures (Fisher’s exact test, P = 0.0150). In the second run, we selected 81 bp of sequence surrounding the SNPs for a more localized structure analysis. As showed in Figure 4, both haplotypes had a strong effect on the secondary structure of bovineUCN3mRNA.
DISCUSSION
There are four paralogous corticotropin-releasing hormone genes in mammalian genomes: corticotropin-releasing hormone, uro-cortin, urocortin 2 and urocortin 3 [16]. In the present study, we revealed several interesting features about urocortin 3 in the bovine genome. First, the bovineUCN3gene region seems highly polymorphic. We designed three pairs of primers that amplified a total of 1,679 bp. A total of 12 mutations (one approximately every 140 bp of sequence) were detected in this region. Second, a multiple nucleotide polymorphism was detected in the promoter
region of the bovineUCN3gene. One allele has 10 nucleotides of
AATAATAAAT, while another has only five nucleotides ofGGAGC.
No significant similarity could be determined between these two alleles. Third, two SNPs (c.12667T.Gandc.12669C.A) occurred in one codon (codon 59), leading to a change from phenylalanine (TTC) to valine (GTA) at the preprohormone level of UCN3 peptide. Both SNPs only form two haplotypes–TC and GA, showing no historical recombination in the population. Lastly, HAPLOVIEW analysis revealed that three amplified regions hold three haplotype blocks (Figure 1); although the amplified promoter region and exon 1 region are just 147 bp apart and exon 1 and exon 2 regions are just 3,209 bp apart. These data might provide a foundation for further investigation on formation and evolution ofCRHparalogs in mammals.
More importantly, we found that theUCN3gene is significantly associated with IMCL accumulation and SFD (Table 1). However, four promoter SNPs organized into two haplotyes had a strong association with SFD, while four SNPs that also formed two haplotypes in exon 2 yielded a strong association with IMCL accumulation. In the SFD analysis, animals withTTgenotypes of
g.8208C.Thad 0.086 (P = 0.0045) and 0.056 inches (P = 0.0259)
less subcutaneous fat than animals with CC and CT genotypes, which account for 0.48 and 0.31 standard deviations for the trait. In the IMCL analysis,AA animals at position c.12669C.Ahad 0.549 and 0.340 lower marbling scores than CC animals (P = 0.0045) and CT heterozygotes (P = 0.0164). On the other hand, theAAanimals tended to be leaner with 0.047 and 0.046 less inches of SFD compared to theCCandCAgenotypes (Table 1), which approached the significance level (P = 0.0982 for the GLM analysis and P = 0.0522 for the QTDT test when the P values were uncorrected). These data indicate that increasing SFD with a promoter polymorphism does not necessarily result in an
Figure 4.UCN3mRNA secondary structure predicted by Mfold on a partial sequence of 81 bp surrounding four coding SNPs. A: mRNA secondary structure for haplotypeCTTC. B: mRNA secondary structure for haplotypeTCGA.
increase of IMCL accumulation. However, it is very likely that increasing IMCL with the exon 2 polymorphisms would also stimulate high accumulation of SFD, and thus lead to an overall increase of whole body fat deposition. As intramyocellular lipid accumulation in muscle is a major contributor to both insulin resistance and whole body fat deposition, inhibiting IMCL gain should be a long-term goal for preventing obesity in human.
In the human genome,UCN3is placed at position 5.40 Mb on 10p15.1, where two independent studies suggested quantitative trait loci (QTL) for body mass index (BMI) in Pima Indians [17] and in Caucasians [18]. Interestingly, both groups used the same flanking markers–D10S1435 and D10S189, spanning from 2.23 Mb to 6.76 Mb on human chromosome 10. Obviously, the UCN3gene should be a strong candidate gene for the human BMI QTL detected in the region, as our current study provided strong evidence supporting its involvement in regulation of lipogenesis. In the study, we developed five genetic markers in the promoter region of the bovine CRHR2 gene, but none were significantly associated with either IMCL accumulation or SFD in Wagyu6 Limousin F2cross cattle (Table 1).
This was not surprising because no association ofCRHR2gene has been observed with obesity in humans. Challis and associates [19] screened 51 severely obese children (body mass index (BMI).4 kg/m2standard deviations above the age-related mean), a UK Caucasian population-based cohort for genetic polymorph-isms in the humanCRHR2gene. In subjects with extreme early-onset obesity, three missense mutations were found in CRHR2 (Glu220Asp, Val240Ile and Val411Met). However, none of these missense mutations clearly cosegregated with obesity in family studies. A common single-nucleotide polymorphism G1047A (Ser349Ser) was also detected inCRHR2, but it was not associated with any obesity-related phenotype. The authors concluded that mutations in the coding sequence of theCRHR2gene are unlikely to be a common monogenic cause of early-onset obesity. Therefore, the association studies conducted in cattle and in human failed to provide any evidence supporting CRHR2 as a potential target for the development of an antiobesity drug, as proposed by Doyon and colleagues [9].
The remarkably different expression patterns between UCN3
and CRHR2genes in adipocyte tissue and skeletal muscle might
provide some hints on why the former, not the latter gene, is associated with SFD and IMCL accumulation observed in the present study. In the human subcutaneous fat tissue, quantitative expression analysis revealed that UCN3 mRNA is expressed approximately four fold higher than its receptor,CRHR2mRNA [8]. UCN3 mRNA is expressed in the skeletal muscle of adult mammals and Xenopus laevis, but no one has detected any
expression of CRHR2mRNA in the tissue of any species [20]. Therefore, the lower expression or no expression of CRHR2 mRNA in these tissues might lead to its limited effects on fat cell function and muscle thermogenesis. On the other hand, evidence has shown that UCN3 is directly involved in regulation of glucagons and insulin secretion [21]. Injection of murine synthetic UcnIII into male rats significantly increased both blood and insulin levels. UCN3 also stimulated glucagons and insulin release from the isolated rat islets. In the present study, the high SFD associated haplotypeCTATin the promoter region gained 10 new transcriptional regulatory binding sites in comparison with the other haplotype ofTCATin the bovineUCN3gene. Among these 10 transcriptional regulatory binding sites, three are for TFCP2 (transcription factor CP2), NKX3-1 (NK3 transcription factor related, locus 1) and NFAT5 (nuclear factor of activated T-cells 5, tonicity-responsive). Studies have shown that these three genes may affect the risk of Alzheimer’s disease [22], prostate cancer [23] and diabetic nephropathy [24], conditions often associated with obesity. All these data clearly support that the UCN3gene plays an important role in regulation of adipocyte metabolism through a broad pathway.
In conclusion, we annotated the bovine UCN3 and CRHR2 genes using a comparative approach and developed a total of 17 genetic markers in both genes. Genotyping these markers on,250
Wagyu6Limousin F2crosses revealed that the bovineUCN3, but
not its receptor CRHR2 gene, is significantly associated with intramyocellular lipid accumulation and subcutaneous fat depth in cattle. The promoter polymorphisms of the bovine UCN3 gene alter 12 potential transcription regulatory binding sites, some of which are associated with obesity-related conditions. The coding polymorphisms of the gene affect the secondary structure ofUCN3 mRNA remarkably. Therefore, we propose UCN3 as a strong target for developing antiobesity drugs. However, the candidacy of CRHR2 for the purpose needs to be further evaluated.
ACKNOWLEDGMENTS
The authors appreciate the assistance of Dr. Michael MacNeil, USDA-ARS, Miles City, MT, in providing DNA and data for this research. We also thank Dr. Xio-Lin Wu, The University of Wisconsin-Madison, for his assistance in statistical analysis.
Author Contributions
Conceived and designed the experiments: ZJ. Performed the experiments: JM GW TK. Analyzed the data: ZJ JM TD. Wrote the paper: ZJ. Other: Edited the paper: JM.
REFERENCES
1. Finkelstein EA, Ruhm CJ, Kosa KM (2005) Economic Causes and Con-sequences of Obesity. Annu Rev Public Health 26: 14.1–14.19.
2. Goodpaster BH, Wolf D (2004) Skeletal muscle lipid accumulation in obesity, insulin resistance, and type 2 diabetes. Pediatr Diabetes 5: 219–226. 3. Lewis K, Li C, Perrin MH, Blount A, Kunitake K, et al. (2001) Identification of
urocortin III, an additional member of the corticotropin-releasing factor (CRF) family with high affinity for the CRF2 receptor. Proc Natl Acad Sci U S A 98: 7570–7575.
4. Li C, Vaughan J, Sawchenko PE, Vale WW (2002) Urocortin III-immunore-active projections in rat brain: partial overlap with sites of type 2 corticotrophin-releasing factor receptor expression. J Neurosci 22: 991–1001.
5. Zorrilla EP, Tache Y, Koob GF (2003) Nibbling at CRF receptor control of feeding and gastrocolonic motility. Trends Pharmacol Sci 24: 421–427. 6. Bale TL, Anderson KR, Roberts AJ, Lee KF, Nagy TR, et al. (2003)
Corticotropin-releasing factor receptor-2-deficient mice display abnormal homeostatic responses to challenges of increased dietary fat and cold. Endocrinology 144: 2580–2587.
7. Ohata H, Shibasaki T (2004) Effects of urocortin 2 and 3 on motor activity and food intake in rats. Peptides 25: 1703–1709.
8. Seres J, Bornstein SR, Seres P, Willenberg HS, Schulte KM, et al. (2004) Corticotropin-releasing hormone system in human adipose tissue. J Clin Endocrinol Metab 89: 965–970.
9. Doyon C, Moraru A, Richard D (2004) The corticotropin-releasing factor system as a potential target for antiobesity drugs. Drug News Perspect 17: 505–517.
10. Jiang Z, Kunej T, Michal JJ, Gaskins CT, Reeves JJ, et al. (2005) Significant associations of the mitochondrial transcription factor A promoter polymorph-isms with marbling and subcutaneous fat depth in Wagyu6Limousin F2 crosses. Biochem Biophys Res Commun 334: 516–523.
12. Barrett JC, Fry B, Maller J, Daly MJ (2005) Haploview: analysis and visualization of LD and haplotype maps. Bioinformatics 21: 263–565. 13. Abecasis GR, Cardon LR, Cookson WO (2000) A general test of association for
quantitative traits in nuclear families. Am J Hum Genet 66: 279–292. 14. Quandt K, Frech K, Karas H, Wingender E, Werner T (1995) MatInd and
MatInspector: new fast and versatile tools for detection of consensus matches in nucleotide sequence data. Nucleic Acids Res. 23: 4878–48.
15. Zuker M (2003) Mfold web server for nucleic acid folding and hybridization prediction. Nucleic Acids Res 31: 3406–3415.
16. Bale TL, Vale WW (2004) CRF and CRF receptors: role in stress responsivity and other behaviors. Annu Rev Pharmacol Toxico 44: 525–557.
17. Lindsay RS, Kobes S, Knowler WC, Bennett PH, Hanson RL (2001) Genome-wide linkage analysis assessing parent-of-origin effects in the inheritance of type 2 diabetes and BMI in Pima Indians. Diabetes 50: 2850–2857.
18. Chagnon YC, Rice T, Perusse L, Borecki IB, Ho-Kim MA, et al. (2001) Genomic scan for genes affecting body composition before and after training in Caucasians from HERITAGE. J Appl Physiol 90: 1777–1787.
19. Challis BG, Luan J, Keogh J, Wareham NJ, Farooqi IS, et al. (2004) Genetic variation in the corticotrophin-releasing factor receptors: identification of
single-nucleotide polymorphisms and association studies with obesity in UK Caucasians. Int J Obes Relat Metab Disord 28: 442–446.
20. Boorse GC, Denver RJ (2006) Widespread tissue distribution and diverse functions of corticotropin-releasing factor and related peptides. Gen Comp Endocrinol. 146: 9–18.
21. Li C, Chen P, Vaughan J, Blount A, Chen A, et al. (2003) Urocortin III is expressed in pancreatic beta-cells and stimulates insulin and glucagon secretion. Endocrinology 144: 3216–3224.
22. Bertram L, Parkinson M, McQueen MB, Mullin K, Hsiao M, et al. (2005) Further evidence for LBP-1c/CP2/LSF association in Alzheimer’s disease families. J Med Genet 42: 857–862.