Socioeconomic Status on Cancer Survival Rates
Chun-Ming Chang1,2., Yu-Chieh Su2,3,4., Ning-Sheng Lai2,5
, Kuang-Yung Huang2,5, Sou-Hsin Chien1,2, Yu-Han Chang6, Wei-Cheng Lian7, Ta-Wen Hsu1,2, Ching-Chih Lee2,8,9,10*
1Department of Surgery, Buddhist Dalin Tzu Chi General Hospital, Chiayi, Taiwan,2School of Medicine, Tzu Chi University, Hualian, Taiwan,3Division of Hematology-Oncology, Department of Internal Medicine, Buddhist Dalin Tzu Chi General Hospital, Chiayi, Taiwan,4Cancer Center, Buddhist Dalin Tzu Chi General Hospital, Chiayi, Taiwan,5Division of Rheumatology, Department of Internal Medicine, Buddhist Dalin Tzu Chi General Hospital, Chiayi, Taiwan,6Department of Medical Research, Buddhist Dalin Tzu Chi General Hospital, Chiayi, Taiwan,7Division of Metabolism and Endocrinology, Department of Internal Medicine, Buddhist Dalin Tzu Chi General Hospital, Chiayi, Taiwan,8Department of Otolaryngology, Buddhist Dalin Tzu Chi General Hospital, Chiayi, Taiwan,9Center for Clinical Epidemiology and Biostatistics, Buddhist Dalin Tzu Chi General Hospital, Chiayi, Taiwan,10Community Medicine Research Center and the Institute of Public Health, National Yang-Ming University, Taipei, Taiwan
Abstract
Background: This population-based study investigated the relationship between individual and neighborhood socioeconomic status (SES) and mortality rates for major cancers in Taiwan.
Methods:A population-based follow-up study was conducted with 20,488 cancer patients diagnosed in 2002. Each patient was traced to death or for 5 years. The individual income-related insurance payment amount was used as a proxy measure of individual SES for patients. Neighborhood SES was defined by income, and neighborhoods were grouped as living in advantaged or disadvantaged areas. The Cox proportional hazards model was used to compare the death-free survival rates between the different SES groups after adjusting for possible confounding and risk factors.
Results:After adjusting for patient characteristics (age, gender, Charlson Comorbidity Index Score, urbanization, and area of residence), tumor extent, treatment modalities (operation and adjuvant therapy), and hospital characteristics (ownership and teaching level), colorectal cancer, and head and neck cancer patients under 65 years old with low individual SES in disadvantaged neighborhoods conferred a 1.5 to 2-fold higher risk of mortality, compared with patients with high individual SES in advantaged neighborhoods. A cross-level interaction effect was found in lung cancer and breast cancer. Lung cancer and breast cancer patients less than 65 years old with low SES in advantaged neighborhoods carried the highest risk of mortality. Prostate cancer patients aged 65 and above with low SES in disadvantaged neighborhoods incurred the highest risk of mortality. There was no association between SES and mortality for cervical cancer and pancreatic cancer.
Conclusions:Our findings indicate that cancer patients with low individual SES have the highest risk of mortality even under a universal health-care system. Public health strategies and welfare policies must continue to focus on this vulnerable group.
Citation:Chang C-M, Su Y-C, Lai N-S, Huang K-Y, Chien S-H, et al. (2012) The Combined Effect of Individual and Neighborhood Socioeconomic Status on Cancer Survival Rates. PLoS ONE 7(8): e44325. doi:10.1371/journal.pone.0044325
Editor:Apar Kishor Ganti, University of Nebraska Medical Center, United States of America ReceivedJune 1, 2012;AcceptedAugust 1, 2012;PublishedAugust 30, 2012
Copyright:ß2012 Chang et al. This is an open-access article distributed under the terms of the Creative Commons Attribution License, which permits unrestricted use, distribution, and reproduction in any medium, provided the original author and source are credited.
Funding:The authors have no support or funding to report.
Competing Interests:The authors have declared that no competing interests exist. * E-mail: hematcd@hotmail.com
.These authors contributed equally to this work.
Introduction
Cancer is a leading cause of death worldwide and it accounted for 7.6 million deaths (13% of all deaths) in 2008 [1]. In Western countries as well as Taiwan, lung cancer, breast cancer, colorectal cancer, prostate cancer, head and neck cancer, cervical cancer and pancreatic cancer are the most common cancers [1,2,3]. Cancer treatment is now a serious socioeconomic problem and an important public health issue which deserves more attention.
A growing body of literature suggests a persistent relationship between socioeconomic status (SES) and health status, with SES influencing survival in several common cancers including breast,
combined effect of individual and neighborhood SES on cancer survival rates have remained unanswered.
This article describes and compares the overall survival rates and relative risk of death in patients diagnosed with their first malignant tumor in 2002. The types of cancer included in the study are lung cancer, breast cancer, colorectal cancer, prostate cancer, head and neck cancer, cervical cancer, and pancreatic cancer. We used the Taiwan National Health Insurance Research Database (NHIRD), census data, and public information from the Department of Health to extract individual SES and neighbor-hood SES data for patients. We used a population-based data set merged with neighborhood SES information to measure the contextual effect of individual and neighborhood SES on major cancer survival rates.
Materials and Methods
Ethics Statement
This study was initiated after approval by the Institutional Review Board of Buddhist Dalin Tzu Chi General Hospital, Taiwan. Since all identifying personal information was removed from the secondary files prior to analysis, the review board waived the requirement for written informed consent from the patients involved.
Database
The data for this study are from the 2002–2007 NHIRD in Taiwan. The NHIRD, which is organized and managed by the National Health Research Institute, is derived from the National Health Insurance Program data. The National Health Insurance Program has been in place in Taiwan since 1995, and it enrolls up to 99% of the Taiwanese population and contracts with 97% of Taiwanese medical providers [15]. The Bureau of National Health Insurance in Taiwan randomly reviews the charts of one per 100 ambulatory and 20 inpatient claim cases and interviews patients in order to verify diagnosis accuracy [16,17].
The study cohort consisted of patients with incidental lung cancer, breast cancer, colorectal cancer, prostate cancer, head and neck cancer, and cervical cancer who began treatment in 2002.
Measurement
The key dependent variable of interest was the 5-year survival rate. The overall survival rate was used, because it was not possible to determine cause-specific survival rates based on this registry data. Moreover, Roohan et al. has shown that there is no significant difference between survival models for all-cause-mortality and cancer-specific all-cause-mortality [18].
The key independent variables were the contextual effects of individual SES and neighborhood SES. Patients were then linked to the mortality data covering the years from 2002 to 2007 to calculate death-free survival time. Each patient was tracked from his or her first curative treatment for a five-year period using administrative data to identify all patients who died during the study period. Patient characteristics included age, gender, geographic location, treatment modality, severity of disease, and monthly income. The disease severity of each patient was based on the modified Charlson Comorbidity Index Score (CCIS), which has been widely accepted in recent years for risk adjustment in administrative claims data sets [19].
Individual-level Measures
This study used the income-related insurance payment amount as a proxy measure of individual SES at the time of diagnosis, which is an important prognostic factor for cancer [20,21]. The
cancer patients were classified into three groups: (1) low SES: lower than US$571 per month (New Taiwan Dollar (NT$) 20000); (2) moderate SES: between US$571–1141 per month (NT$20000–40000); and (3) high SES: US$1142 per month (NT$40001) or more [22].
Neighborhood-level Socioeconomic Status
For neighborhood SES, household income is a contextual characteristic representing averages and percentages measured at the enumeration level in the 2001 Taiwan Census.
Neighborhood household income was measured using per capita personal income by township acquired from the 2001 income tax statistics released Taiwan’s Ministry of Finance, (http://www.fdc.gov.tw/dp.asp?mp = 5). Advantaged and disad-vantaged neighborhoods were distinguished based on the median values for neighborhood characteristics, with advantaged neigh-borhoods having higher-than-median neighborhood household incomes, and disadvantaged neighborhoods having lower-than-median household incomes.
Other Variables
The urbanization level of residences were classified in 7 levels based on 5 indices in Taiwan: population density, percentage of residents with college level or higher education, percentage of residents .65 years old, percentage of residents who were agriculture workers, and the number of physicians per 100000 people [23]. We recorded the urbanization level of residences as urban (urbanization level 1), sub-urban (urbanization levels 2–3), or rural (urbanization levels 4–7).
The hospitals were categorized by ownership (public, nonprofit, or for-profit), and hospital level (medical center, regional or district hospital). The geographic regions where the cancer patients resided were recorded as Northern, Central, Southern and Eastern Taiwan.
Statistical Analysis
The SAS statistical package (version 9.2; SAS Institute, Inc., Cary, NC, USA), and SPSS (version 15, SPSS Inc., Chicago, IL, USA) were used for data analysis. Pearson’s chi-square test was used for categorical variables such as gender, level of urbanization, geographic regions of residence, category of Charlson Comorbid-ity Index Score, treatment modalComorbid-ity, tumor extent, and hospital characteristics (teaching level, ownership, and caseload) in major cancer patients. Continuous variables were analyzed with a one-way ANOVA test. The percentage of patients who underwent surgical intervention/nonsurgical intervention was calculated.
Results
Demographic Data and Clinical Characteristics
A total of 20,488 cancer patients who received treatment were included in the study (Table 1). The mean age at diagnosis differed significantly by individual SES; it was 55 years old for the high individual SES group, 54 years old for the moderate individual SES group, and 62 years old for the low individual SES group. Interaction effects between age and several other variables were
noted, and the patients were further stratified into two groups: less than 65 years old, and 65 years old and older.
Patients younger than 65 years old with low individual SES were more likely to reside in rural areas, specifically in southern and eastern Taiwan, and to undergo treatment in regional and district, for-profit and nonprofit hospitals, compared with cancer patients of high individual SES. Patients with low SES were less likely to undergo surgery.
Patients aged 65 and above with low SES were more likely to reside in rural areas, specifically in central, southern, and eastern Table 1.Baseline characteristics (n = 20488).
Variables Age,65 years (n = 12382) Age§65 years (n = 8106)
High SES Moderate SES Low SES p value High SES Moderate SES Low SES p value
(n = 1626) (n = 2823) (n = 7933) (n = 314) (n = 607) (n = 7185)
Mean age, years (6SD) 52 67.9 51 68.7 50 69.2 ,0.001 70 64.8 70 63.7 75 66 ,0.001
Gender ,0.001 ,0.001
Male (%) 965 (59.3) 1322 (46.8) 3618 (45.6) 36 (11.5) 111 (18.3) 2285 (31.8)
Female (%) 661 (40.7) 1501 (53.2) 4315 (54.6) 278 (88.5) 496 (81.7) 4900 (68.2)
Urbanization ,0.001 ,0.001
Urban (%) 643 (39.5) 1101 (39.0) 2111 (26.6) 133 (42.4) 236 (38.9) 1282 (17.8)
Suburban (%) 746 (45.9) 1341 (47.5) 3615 (45.6) 129 (41.1) 276 (45.5) 2665 (37.1)
Rural (%) 237 (14.6) 380 (13.5) 2207 (27.8) 52 (16.6) 95 (15.7) 3238 (45.1)
Geographic Region ,0.001 ,0.001
Northern (%) 966 (16.4) 1628 (57.7) 3288 (41.4) 187 (59.6) 384 (63.3) 2571 (35.8)
Central (%) 383 (11.8) 727 (25.6) 2138 (26.9) 73 (23.2) 127 (20.9) 2101 (29.2)
Southern/Eastern (%) 277 (8.5) 471 (16.7) 2511 (31.7) 54 (17.2) 96 (15.8) 2513 (35.0)
Charlson Comorbidity Index Score 0.564 0.183
0 (%) 909 (55.9) 1627 (57.6) 4533 (57.1) 155 (49.4) 290 (47.8) 3306 (46.0)
1–6 (%) 519 (31.9) 864 (30.6) 2464 (31.1) 110 (35.0) 218 (35.9) 2657 (37.0)
.6 (%) 198 (12.2) 332 (11.8) 936 (11.8) 49 (15.6) 99 (16.3) 1222 (17.0)
Tumor stage 0.026 0.428
Local, locoregional tumor (%) 1418 (87.2) 2529 (89.6) 7100 (89.5) 265 (84.4) 503 (82.9) 6089 (84.7)
Distant metastatic tumor (%) 208 (12.8) 294 (10.4) 833 (10.5) 49 (15.6) 104 (17.1) 1096 (15.3)
Surgery 0.017 0.002
Yes (%) 1067 (65.6) 1863 (66.0) 5031 (63.4) 164 (52.2) 305 (50.2) 3262 (45.4)
No (%) 559 (34.4) 960 (34.0) 2902 (36.6) 150 (47.8) 302 (49.8) 3923 (54.6)
Nonsurgical Therapy 0.045 0.239
Nil (%) 721 (44.3) 1250 (44.3) 3384 (42.7) 178 (56.7) 350 (57.7) 4570 (63.6)
Radiotherapy (%) 222 (13.7) 355 (12.6) 1086 (13.7) 48 (15.3) 83 (13.7) 811 (11.3)
Chemotherapy (%) 354 (21.8) 625 (22.1) 1701 (21.4) 62 (19.7) 102 (16.8) 1160 (16.1)
Chemoradiotherapy (%) 329 (20.2) 593 (21.0) 1762 (22.2) 26 (8.3) 72 (11.9) 644 (9.0)
Hospital characteristics
Teaching level ,0.001 ,0.001
Medical center (%) 1133 (69.7) 1922 (68.1) 5262 (66.3) 226 (72.0) 378 (62.3) 4104 (57.1)
Regional (%) 440 (27.1) 763 (27.0) 2251 (28.4) 77 (24.5) 187 (30.8) 2352 (32.7)
District (%) 53 (3.3) 138 (4.9) 420 (5.3) 11 (3.5) 42 (6.9) 729 (10.1)
Ownership ,0.001 ,0.001
Public (%) 642 (39.5) 992 (35.1) 2441 (30.8) 149 (47.5) 255 (42.0) 2611 (36.3)
Non-for-profit (%) 738 (45.4) 1340 (47.5) 3947 (49.8) 119 (37.9) 259 (42.7) 3188 (44.4)
For-profit (%) 246 (15.1) 491 (17.4) 1545 (19.5) 46 (14.6) 93 (15.3) 1386 (19.3)
Taiwan and to undergo treatment at for-profit and nonprofit regional and district hospital. Patients with low SES were less likely to receive surgery.
We examined the use of surgical intervention/non-surgical intervention according to the individual SES and neighborhood SES. Figure 1a (patients aged below 65 years) and 1b (patients aged 65 years and above) shows the percentage of treatment modality. For cancer patients aged below 65, patients in advantaged neighborhood are more likely to underwent surgical intervention (p = 0.002). For cancer patients aged 65 and above,
patients with high individual SES were more likely to receive surgery and non-surgical intervention (p,0.001 and 0.004, respectively).
Univariate Survival Analysis
The Figure 2a and 2b demonstrated the 5-year overall survival rate for all major cancer patients. Table 2 shows the 5-year overall survival rate stratified by age and tumor category. Analysis of the combined effect of individual SES and neighborhood SES
Figure 1. Rates of use of treatment in cancer patient aged less than 65 years (a) and those aged 65 years and above (b).
revealed that, in patients aged below 65 years, mortality rates were worst among those with low individual and low neighborhood SES with colorectal cancer, head and neck cancer, and pancreatic cancer (Appendix S1). There was borderline difference among breast cancer patients. For lung cancer, patients with low SES in advantaged neighborhood had the poorest prognosis. Among patients aged 65 years and above, no statistically significant difference was found in survival rates between the groups except for with lung cancer and prostate cancer (Appendix S2).
Multivariable Survival Analysis
Interaction effects were noted between patient age and survival rates by SES. The combined effect of individual SES and neighborhood SES remained statistically significant in the Cox proportional hazards regression model, adjusting for other factors in patients under 65 years old. Adjusted hazard ratios revealed that, among patients under 65 years old, lung cancer, and breast cancer in patients with low individual SES in advantaged neighborhoods conferred a 1.4-fold to 1.7 higher risk of death, compared with patients with high individual SES in advantaged neighborhoods (Table 3). Colorectal cancer patients and head and neck cancer patients with low individual SES in disadvantaged neighborhoods incurred a large increase in the risk of mortality (HR = 1.5 and 2.1, respectively). Among older patients, patients with prostate cancer with low individual SES in disadvantaged
neighborhoods incurred an increased risk of death (HR = 2.5; 95% CI, 1.2–5.4). No statistically significant differences in mortality rates were found based on SES among older patients with other cancers. There was no significant difference between SES and survival in cervical cancer patients and pancreatic cancer patients. In order to explore whether cancer patients underwent surgical intervention/nonsurgical intervention will influence the outcomes, we add the variable, (surgical intervention or non-surgical intervention) versus no treatment, and Appendix S3 showed that the impact of individual SES and neighborhood SES on cancer mortality was similar to the results of Table 3.
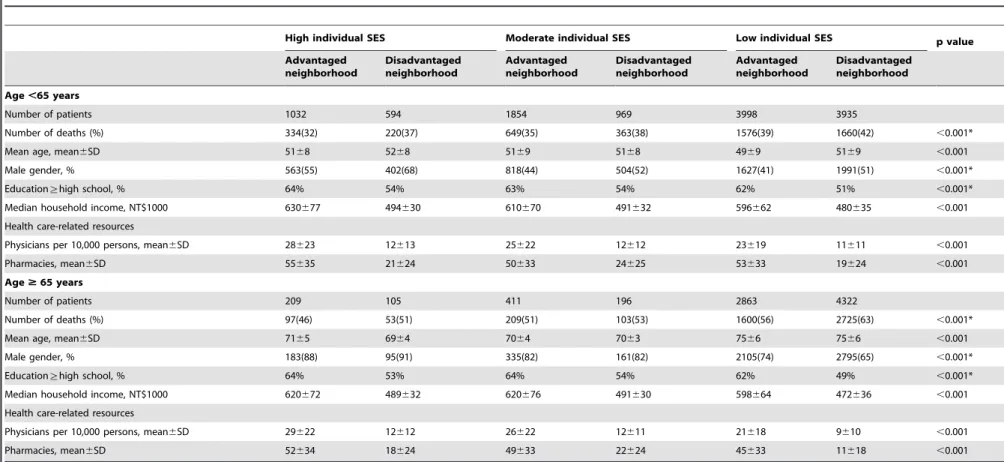
At baselines, cancer patients with low SES in disadvantaged neighborhood had lower resources for health care (e.g. physicians per 10,000 residents and pharmacies) in both age less than 65 years and 65 years and above groups (Table 4). Cancer patients with high SES in advantaged neighborhood had higher level of education (percentage of education§high school), higher median household income. This analysis supported the idea why we used 9 individual and neighborhood SES groups.
Discussion
The combined effect of individual and neighborhood SES differed according to tumor site and patient age. Among patients under 65 years old, colorectal cancer, and head and neck patients
Figure 2. The combined effect of individual and neighborhood SES on cancer survival rates in patients aged less than 65 years (a) and those aged 65 years and above (b).
with low individual SES in disadvantaged neighborhoods incurred a moderate increase in the risk of mortality. A cross-level interaction effect was noted in lung cancer and breast cancer patients. Among lung cancer and breast cancer patients under 65 years old, patients with low SES in advantaged neighborhoods carried the highest risk of mortality. Prostate cancer patients with low individual SES in advantaged neighborhoods incurred a higher risk of mortality in the older age groups. There was no statistically significant difference in mortality rates for cervical cancer and pancreatic cancer.
In Taiwan, the research regarding the association of SES and mortality in general population is limited. In a cross-sectional and longitudinal study, Chiao et al conducted a longitudinal study and revealed the negative effect of perceived economic strain on well-being (life satisfaction, and self-rated health) among older adults aged 60 and above [24]. Pu et al. showed that subjective poor financial satisfaction was found to be related to poorer health and increased mortality in the elderly [25]. Because only older patients were included, results require validation in younger cohort. Previous studies revealed a negative association between SES and cancer survival rates and the impact varied based on tumor site, insurance style, and cancer screening program [26]. In lung cancer, colorectal cancer, breast cancer and head and neck cancer, there was a negative association between SES and cancer survival rates in
patients under 65 years old. Several plausible mechanisms may explain this phenomenon. Different neighborhood-level variables seemed to represent different contextual effects, and have different effects on mortality. This may be attributed to inequalities in the utilization of medical resources. Cancer patients with low SES tend to seek medical advice or undergo treatment in regional or district hospitals, for-profit hospitals, and low-caseload hospitals, which were negative prognostic factors in survival rates, and this may be due to unequal hospital resources. Public hospitals and medical centers that can offer surgery, reconstruction, radiotherapy and chemotherapy are primarily located in urban areas and advantaged neighborhoods. However, most of the patients with low SES live in rural areas and are farther away from medical centers. This inequality in the provision of health services may explain the pronounced effects of individual and neighborhood SES on access to specialized cancer services, and the use of evidence-based therapies after the diagnosis of a malignancy. Our results revealed the negative combined effect of individual and neighborhood SES on cancer survival among cancer patients under 65 years old.
Social isolation, depression, and occupational stress are more prevalent among patients with low SES [27,28], and these factors may further increase the risk of death among patients with low SES. Patients with high SES living in advantaged neighborhoods may have more opportunities to improve their prognosis; they may Table 2.Combined effect of individual SES and neighborhood SES on 5-year overall survival rates(n = 20488).
Neighborhood
socioeconomic status Individual socioeconomic status
Age,65 years (n = 12382) Age§65 yeasr (n = 8106)
High SES Moderate SES Low SES High SES Moderate SES Low SES
(%) (%) (%) p value (%) (%) (%) p value
Lung cancer (n = 4698) n = 1984 0.001 n = 2714 ,0.001
Advantaged 29.4 25.4 20.9 23.6 18.1 20.2
Disadvantaged 35.3 25.8 22.5 21.9 28.3 17.0
Colorectal cancer (n = 5135) n = 2536 0.005 n = 2599 0.023
Advantaged 66.7 66.7 59.4 54.1 64.1 53.9
Disadvantaged 66.7 67.8 59.0 56.0 44.4 50.3
Breast cancer (n = 3581) n = 3223 0.079* n = 358 0.895
Advantaged 88.1 85.9 82.9 70.0 85.7 72.4
Disadvantaged 87.4 84.3 81.9 66.7 76.9 71.0
Cervical cancer (n = 1346) n = 1066 0.262 n = 280 0.263
Advantaged 85.7 73.8 73.4 50.0 90.0 60.8
Disadvantaged 86.7 79.5 78.8 0.0 50.0 51.1
Prostate cancer (n = 1247) n = 204 0.143 n = 1043 ,0.001
Advantaged 85.4 77.4 80.0 84.4 73.4 64.5
Disadvantaged 84.4 76.5 64.2 80.8 89.3 53.3
Head and neck cancer (n = 3770) n = 3053 0.001 n = 717 0.152
Advantaged 71.5 61.5 55.7 60.0 48.9 50.0
Disadvantaged 60.6 59.8 55.3 64.5 44.0 42.1
Pancreas cancer (n = 711) n = 316 0.008 n = 395 0.448
Advantaged 23.7 24.5 36.5 50.0 28.6 16.6
Disadvantaged 15.0 31.0 17.9 0.0 20.0 47.8
Abbreviation: 95% CI, 95% confidence interval.
*In female breast cancer, the p-value of survival rates between the patients in high individual SES in advantaged neighborhoods and patients in low SES in disadvantaged neighborhoods was 0.014.
Table 3.Hazard ratios of individual SES for mortality in advantaged and disadvantaged neighborhoods*.
Neighborhood socioeconomic
status Individual socioeconomic status
Age,65 years (n = 12382) Age§65 years (n = 8106)
High SES Moderate SES Low SES High SES Moderate SES Low SES
Adjusted HR
95% CI
Adjusted
HR 95% of CI
Adjusted HR
95% CI
Adjusted HR
95% CI
Adjusted HR
95% CI
Adjusted HR
95% CI
Lung cancer (n = 4698) n = 1984 n = 2714
Advantaged 1.00 1.13 (0.90–1.42) 1.36 (1.10–1.67) 1.00 1.03 (0.72–1.48) 0.92 (0.67–1.26)
Disadvantaged 0.91 (0.68–1.22) 1.24 (0.96–1.60) 1.23 (1.00–1.52) 0.83 (0.51–1.37) 0.84 (0.55–1.29) 1.03 (0.76–1.41)
Colorectal cancer (n = 5135) n = 2536 n = 2599
Advantaged 1.00 1.06 (0.81–1.37) 1.40 (1.11–1.77) 1.00 0.80 (0.51–1.26) 0.96 (0.68–1.37)
Disadvantaged 0.84 (0.59–1.18) 1.11 (0.81–1.52) 1.45 (1.14–1.83) 1.16 (0.58–2.29) 1.41 (0.88–2.27) 1.07 (0.75–1.53)
Breast cancer (n = 3581) n = 3223 n = 358
Advantaged 1.00 1.38 (0.93–2.05) 1.70 (1.18–2.44) 1.00 0.53 (0.08–3.60) 0.97 (0.26–3.65)
Disadvantaged 1.06 (0.57–1.94) 1.59 (0.99–2.55) 1.63 (1.13–2.36) 1.71 (0.16–18.15) 1.13 (0.21–6.22) 1.31 (0.34–5.14)
Cervical cancer (n = 1346) n = 1066 n = 280
Advantaged 1.00 1.22 (0.51–2.94) 1.11 (0.48–2.56) 1.00 0.34 (0.03–4.41) 1.42 (0.28–7.18)
Disadvantaged 0.57 (0.11–2.86) 0.79 (0.31–2.05) 0.87 (0.38–2.01) 11.41 (0.83–156.48) 5.74 (0.46–71.64) 1.27 (0.26–6.17)
Prostate cancer (n = 1247) n = 204 n = 1043
Advantaged 1.00 1.16 (0.37–3.65) 0.80 (0.23–2.78) 1.00 1.99 (0.82–4.81) 1.78 (0.83–3.83)
Disadvantaged 0.81 (0.23–2.81) 1.64 (0.45–6.01) 1.80 (0.65–4.95) 1.23 (0.39–3.91) 0.79 (0.21–3.08) 2.54 (1.19–5.44)
Head and neck cancer (n = 3770) n = 3053 n = 717
Advantaged 1.00 1.61 (1.16–2.24) 1.98 (1.47–2.67) 1.00 1.55 (0.63–3.85) 1.18 (0.51–2.74)
Disadvantaged 1.53 (1.04–2.25) 1.84 (1.30–2.59) 2.08 (1.55–2.79) 0.99 (0.30–3.31) 142 (0.54–3.74) 1.55 (0.68–3.58)
Pancreas cancer (n = 711) n = 316 n = 395
Advantaged 1.00 0.89 (0.54–1.47) 0.66 (0.42–1.06) 1.00 1.95 (0.55–6.98) 2.19 (0.68–7.10)
Disadvantaged 1.15 (0.63–2.10) 0.82 (0.46–1.48) 1.31 (0.84–2.04) 3.94 (0.89–17.46) 2.66 (0.57–12.32) 2.26 (0.71–7.27)
Abbreviation: Adjusted HR, adjusted hazard ratio; 95% CI, 95% confidence interval; SES, socioeconomic status.
*Adjusted for the patients’ diagnosed age, gender, Charlson Comorbidity Index Score, tumor stage (local and locoregional versus distant metastasis), treatment modality (surgery versus without surgery), nonsurgical treatment (radiotherapy, chemotherapy, or chemoradiotherapy), and hospital characteristics (teaching level, and ownership).
doi:10.1371/journal.pone.0044325.t003
SES
and
Cancer
Survival
Rates
ONE
|
www.ploson
e.org
7
August
2012
|
Volume
7
|
Issue
8
|
Table 4.Sociodemographic characteristics by individual and neighborhood socioeconomic status.
High individual SES Moderate individual SES Low individual SES p value
Advantaged neighborhood
Disadvantaged neighborhood
Advantaged neighborhood
Disadvantaged neighborhood
Advantaged neighborhood
Disadvantaged neighborhood
Age,65 years
Number of patients 1032 594 1854 969 3998 3935
Number of deaths (%) 334(32) 220(37) 649(35) 363(38) 1576(39) 1660(42) ,0.001*
Mean age, mean6SD 5168 5268 5169 5168 4969 5169 ,0.001
Male gender, % 563(55) 402(68) 818(44) 504(52) 1627(41) 1991(51) ,0.001*
Education§high school, % 64% 54% 63% 54% 62% 51% ,0.001*
Median household income, NT$1000 630677 494630 610670 491632 596662 480635 ,0.001
Health care-related resources
Physicians per 10,000 persons, mean6SD 28623 12613 25622 12612 23619 11611 ,0.001
Pharmacies, mean6SD 55635 21624 50633 24625 53633 19624 ,0.001
Age$65 years
Number of patients 209 105 411 196 2863 4322
Number of deaths (%) 97(46) 53(51) 209(51) 103(53) 1600(56) 2725(63) ,0.001*
Mean age, mean6SD 7165 6964 7064 7063 7566 7566 ,0.001
Male gender, % 183(88) 95(91) 335(82) 161(82) 2105(74) 2795(65) ,0.001*
Education§high school, % 64% 53% 64% 54% 62% 49% ,0.001*
Median household income, NT$1000 620672 489632 620676 491630 598664 472636 ,0.001
Health care-related resources
Physicians per 10,000 persons, mean6SD 29622 12612 26622 12611 21618 9610 ,0.001
Pharmacies, mean6SD 52634 18624 49633 22624 45633 11618 ,0.001
*Pearson’s chi-square test.
doi:10.1371/journal.pone.0044325.t004
SES
and
Cancer
Survival
Rates
ONE
|
www.ploson
e.org
8
August
2012
|
Volume
7
|
Issue
8
|
be able to use their knowledge, money, power, social connections, and other available resources to improve their health status. In contrast, the greater isolation of individuals with low SES may make it more difficult for them to obtain useful opinions or advice from relatives, friends, or acquaintances [28].
SES may interact with biological characteristics of cancer. For example, prostate cancer in lower SES patients demonstrated more aggressive behavior [29]. Skin melanoma patients without signs of chronic sun-induced damage are prone to have mutations in theBRAF orNRASgene [30] Breast cancer and colon cancer have been found to be more aggressive in patients with low SES and in minority groups [31,32]. In Western countries, HPV-associated cancers, such as oral and oropharyngeal cancer, are associated with higher SES [33]. In HPV-related head and neck cancer, E6–7 protein–induced oncogenesis by blocking the p53 protein is associated with better prognosis and has been shown to respond well to radiotherapy and chemotherapy [34].
Physician discrimination may also affect the outcomes of patients with low SES. In treating chest pain, physicians may be less likely to refer black women for catheterization than white men [35]. Furthermore, regarding the discussion of cancer screening results, such as fecal occult blood tests, and prostate specific antigen results, Asian patients were much less likely to have a discussion about the results with the health care provider, compared with the white patients [36]. In rural areas, physicians were less likely to refer hereditary breast cancer patients for advanced genetics services [37].
In Taiwan, there was no negative association between SES and cervical cancer survival rates. The national Pap smear screening program for cervical cancer was launched in 1995, and the screening rate is up to 54% and the incidence of invasive cervical cancer dropped to 16% in 2002. Early diagnosis and early treatment may explain why there was no significant difference in survival rates among the different SES groups.
Pancreatic cancer is a highly lethal cancer. Surgical resection with or without adjuvant therapy provide the potentially curative therapy [38]. However, up to 37% postoperative morbidity and poor survival rates were noted in pancreatic cancer [39]. Recently, gemcitabine with radiotherapy improved survival rates in locally advanced pancreatic cancer [40]. In our series, the overall survival rate for pancreatic cancer was poor. In multivariable analysis, the impact of SES didn’t reach statistical significance. The major influence of survival on pancreatic cancer may be contributed by surgeon experience, tumor characteristics, chemotherapy, target therapy and other factors [40,41,42].
Cross-level interaction was noted in lung cancer and breast cancer. Patients with low individual SES in advantaged neighbor-hoods incurred the highest risk of mortality after adjusting for other risk factors, confounding factors and treatment modality. Several mechanisms may explain this phenomenon. Lower effective income for those patients might explain this observation [43], and social resources which are primarily located in disadvantaged neighborhoods may further hinder those patients from accessing medical services [44].
With the exception of prostate cancer, no statistically significant relationships were found between SES and survival rates in lung cancer, breast cancer, colorectal cancer and head and neck cancer patients 65 years old and older. Previous research has demon-strated similar results in head and neck cancer [21]. Possible mechanisms that explain this include increased competing mortality in older cancer patients and differences in family member support. Cancer patients may have died of the index cancer, or of other conditions such as pneumonia, sepsis, or cardiovascular events. Compared with younger cancer patients,
older patients tend to have higher CCI scores, an independent predictor of competing mortality [45]. Additionally, for older patients, the support of family members and interaction with community service organizations may influence outcomes; how-ever, the extent of this influence requires further research [46].
In our series, we identified that colorectal cancer, and head and neck cancer patients under 65 years old with low individual SES in disadvantaged neighborhoods conferred a 1.5 to 2-fold higher risk of mortality. Lung cancer and breast cancer patients less than 65 years old with low SES in advantaged neighborhoods carried the highest risk of mortality. Prostate cancer patients aged 65 and above with low SES in disadvantaged neighborhoods incurred the highest risk of mortality. The insurance payer and provider, such as the Bureau of National Health Insurance in Taiwan, may actively provide more information of cancer treatment, cancer therapy quality and accreditation of each health care institution for the above mentioned cancer patients and cooperate with the social welfare workers to help them once they get the application of incident cancer registry from the medical institutions.
This study has several limitations. First, the diagnosis of cancer, and any comorbidities, was completely dependent on ICD codes. Nonetheless, the National Health Insurance Bureau of Taiwan randomly reviews the charts and interviews patients in order to verify diagnosis accuracy [16,17]. Second, the database does not contain information on tobacco use or dietary habits, which may be risk factors and prognostic factors for head and neck cancer. Third, cancer stages were not included in the dataset. However, previous studies have revealed no statistically significant associa-tions between SES and tumor stage at diagnosis in oral cancer, colorectal cancer, breast cancer, and lung cancer [21,47,48,49,50]. Our findings indicate the importance of the combined effect of individual SES and neighborhood SES. Public health strategies should focus on patients with low individual SES in order to reduce health disparities.
Supporting Information
Appendix S1 The combined effect of individual and neighbor-hood SES on cancer survival rates in patients aged less than 65 years with stratification by tumor.
(DOC)
Appendix S2 The combined effect of individual and neighbor-hood SES on cancer survival rates in patients aged 65 years and above with stratification by tumor.
(DOC)
Appendix S3 Adjusted hazard ratios of individual SES for mortality in advantaged and disadvantaged neighborhoods. (DOC)
Acknowledgments
This study is based in part on data from the National Health Insurance Research Database provided by the Bureau of National Health Insurance, Department of Health and managed by the National Health Research Institutes (registration number 101115). The interpretation and conclusions contained herein do not represent those of the Bureau of National Health Insurance, Department of Health, or the National Health Research Institutes.
Author Contributions
References
1. WHO (2008) WHO media centre. http://www.who.int/mediacentre/ factsheets/fs297/en/index.html. Accessed 2011 January 2.
2. Jemal A, Siegel R, Ward E, Hao Y, Xu J, et al. (2009) Cancer Statistics, 2009. CA: A Cancer Journal for Clinicians 59: 225–249.
3. Bureau of Health Promotion (2011) Cancer statistics, Taiwan (2008). http:// www.bhp.doh.gov.tw/BHPnet/Portal/Statistics. Accessed 2011 January 15. 4. Zell JA, Cinar P, Mobasher M, Ziogas A, Meyskens FL, et al. (2008) Survival for
Patients With Invasive Cutaneous Melanoma Among Ethnic Groups: The Effects of Socioeconomic Status and Treatment. Journal of Clinical Oncology 26: 66–75.
5. Newman LA, Griffith KA, Jatoi I, Simon MS, Crowe JP, et al. (2006) Meta-Analysis of Survival in African American and White American Patients With Breast Cancer: Ethnicity Compared With Socioeconomic Status. Journal of Clinical Oncology 24: 1342–1349.
6. Griggs JJ, Culakova E, Sorbero MES, van Ryn M, Poniewierski MS, et al. (2007) Effect of Patient Socioeconomic Status and Body Mass Index on the Quality of Breast Cancer Adjuvant Chemotherapy. Journal of Clinical Oncology 25: 277– 284.
7. Ou S-HI, Ziogas A, Zell JA (2009) Prognostic Factors for Survival in Extensive Stage Small Cell Lung Cancer (ED-SCLC): The Importance of Smoking History, Socioeconomic and Marital Statuses, and Ethnicity. Journal of Thoracic Oncology 4: 37–43 10.1097/JTO.1090b1013e31819140fb. 8. Hellenthal NJ, Parikh-Patel A, Bauer K, Ralph W, deVere W, et al. (2010) Men
of higher socioeconomic status have improved outcomes after radical prostatectomy for localized prostate cancer. Urology 76: 1409–1413. 9. Alter DA, Naylor CD, Austin P, Tu JV (1999) Effects of Socioeconomic Status
on Access to Invasive Cardiac Procedures and on Mortality after Acute Myocardial Infarction. New England Journal of Medicine 341: 1359–1367. 10. Tonne C, Schwartz J, Mittleman M, Melly S, Suh H, et al. (2005) Long-Term
Survival After Acute Myocardial Infarction Is Lower in More Deprived Neighborhoods. Circulation 111: 3063–3070.
11. Yen IH, Kaplan GA (1999) Neighborhood Social Environment and Risk of Death: Multilevel Evidence from the Alameda County Study. American Journal of Epidemiology 149: 898–907.
12. Roos LL, Magoon J, Gupta S, Chateau D, Veugelers PJ (2004) Socioeconomic determinants of mortality in two Canadian provinces: Multilevel modelling and neighborhood context. Social Science & Medicine 59: 1435–1447.
13. Borrell LN, Diez Roux AV, Rose K, Catellier D, Clark BL (2004) Neighbourhood characteristics and mortality in the Atherosclerosis Risk in Communities Study. International Journal of Epidemiology 33: 398–407. 14. Winkleby M, Cubbin C, Ahn D (2006) Effect of Cross-Level Interaction
Between Individual and Neighborhood Socioeconomic Status on Adult Mortality Rates. American Journal of Public Health 96: 2145–2153. 15. NHI profole (2008) http://www.nhi.gov.tw/english/webdata.asp?menu=
11&menu_id=290&webdata_id=1884. Accessed 2008 June 15.
16. Tseng CH (2004) Mortality and causes of death in a national sample of diabetic patients in Taiwan. Diabetes Care 27: 1605–1609.
17. Bureau of National Health Insurance (2006) http://www.nhi.gov.tw/information/ bulletin_file/421_0890036465-19.doc. Accessed 2006 May 2.
18. Roohan PJ, Bickell NA, Baptiste MS, Therriault GD, Ferrara EP, et al. (1998) Hospital volume differences and five-year survival from breast cancer. Am J Public Health 88: 454–457.
19. Deyo RA, Cherkin DC, Ciol MA (1992) Adapting a clinical comorbidity index for use with ICD-9-CM administrative databases. Journal of Clinical Epidemiology 45: 613–619.
20. Braaten T, Weiderpass E, Lund E (2009) Socioeconomic differences in cancer survival: the Norwegian Women and Cancer Study. BMC Public Health 9: 178. 21. Kwok J, Langevin SM, Argiris A, Grandis JR, Gooding WE, et al. (2010) The impact of health insurance status on the survival of patients with head and neck cancer. Cancer 116: 476–485.
22. Chou FHC, Tsai KY, Su -Y, Lee CC (2011) The incidence and relative risk factors for developing cancer among patients with schizophrenia: A nine-year follow-up study. Schizophrenia research 129: 97–103.
23. Liu CY HY, Chung YL, Chen YJ, Weng WS, Liu JS, et al. (2006) Incorporating development stratification of Taiwan townships into sampling design of large scale health interview survey (in Chinese). J Health Manage 1–22.
24. Chiao C, Weng L-J, Botticello AL (2012) Economic strain and well-being in late life: findings from an 18-year population-based longitudinal study of older Taiwanese adults. Journal of Public Health 34: 217–227.
25. Pu C, Huang N, Tang GJ, Chou YJ (2011) When does poor subjective financial position hurt the elderly? Testing the interaction with educational attainment using a national representative longitudinal survey. BMC Public Health 11: 166. 26. Boyd C, Zhang-Salomons JY, Groome PA, Mackillop WJ (1999) Associations Between Community Income and Cancer Survival in Ontario, Canada, and the United States. Journal of Clinical Oncology 17: 2244.
27. Marmot MG (1983) Stress, social and cultural variations in heart disease. J Psychosom Res 27: 377–384.
28. Wang J-J, Snyder M, Kaas M (2001) Stress, loneliness, and depression in Taiwanese rural community-dwelling elders. International Journal of Nursing Studies 38: 339–347.
29. Srougi V, Antunes AA, Reis ST, Dall’oglio MF, Nesrallah AJ, et al. (2011) Socioeconomic status is an independent predictor of biochemical recurrence among patients with prostate cancer who undergo radical prostatectomy. Int Braz J Urol 37: 507–513.
30. Curtin JA, Fridlyand J, Kageshita T, Patel HN, Busam KJ, et al. (2005) Distinct sets of genetic alterations in melanoma. N Engl J Med 353: 2135–2147. 31. Chen VW, Fenoglio-Preiser CM, Wu XC, Coates RJ, Reynolds P, et al. (1997)
Aggressiveness of colon carcinoma in blacks and whites. National Cancer Institute Black/White Cancer Survival Study Group. Cancer Epidemiol Biomarkers Prev 6: 1087–1093.
32. Gapstur SM, Dupuis J, Gann P, Collila S, Winchester DP (1996) Hormone receptor status of breast tumors in black, Hispanic, and non-Hispanic white women. An analysis of 13,239 cases. Cancer 77: 1465–1471.
33. Benard VB, Johnson CJ, Thompson TD, Roland KB, Lai SM, et al. (2008) Examining the association between socioeconomic status and potential human papillomavirus-associated cancers. Cancer 113: 2910–2918.
34. Snow AN, Laudadio J (2010) Human Papillomavirus Detection in Head and Neck Squamous Cell Carcinomas. Advances in Anatomic Pathology 17: 394– 403 310.1097/PAP.1090b1013e3181f1895c1091.
35. Schulman KA, Berlin JA, Harless W, Kerner JF, Sistrunk S, et al. (1999) The Effect of Race and Sex on Physicians’ Recommendations for Cardiac Catheterization. New England Journal of Medicine 340: 618–626.
36. Bao Y, Fox SA, Escarce JJ (2007) Socioeconomic and Racial/Ethnic Differences in the Discussion of Cancer Screening: ‘‘Between-’’ versus ‘‘Within-’’ Physician Differences. Health Services Research 42: 950–970.
37. Koil CE, Everett JN, Hoechstetter L, Ricer RE, Huelsman KM (2003) Differences in physician referral practices and attitudes regarding hereditary breast cancer by clinical practice location. Genetics in Medicine 5: 364–369. 38. Stojadinovic A, Brooks A, Hoos A, Jaques DP, Conlon KC, et al. (2003) An
evidence-based approach to the surgical management of resectable pancreatic adenocarcinoma. Journal of the American College of Surgeons 196: 954–964. 39. Castellanos EH, Cardin DB, Berlin JD (2011) Treatment of early-stage
pancreatic cancer. Oncology (Williston Park) 25: 182–189.
40. Loehrer PJ, Feng Y, Cardenes H, Wagner L, Brell JM, et al. (2011) Gemcitabine Alone Versus Gemcitabine Plus Radiotherapy in Patients With Locally Advanced Pancreatic Cancer: An Eastern Cooperative Oncology Group Trial. Journal of Clinical Oncology 29: 4105–4112.
41. Yeo CJ, Cameron JL, Lillemoe KD, Sohn TA, Campbell KA, et al. (2002) Pancreaticoduodenectomy With or Without Distal Gastrectomy and Extended Retroperitoneal Lymphadenectomy for Periampullary Adenocarcinoma, Part 2: Randomized Controlled Trial Evaluating Survival, Morbidity, and Mortality. Annals of Surgery 236: 355–368.
42. Von Hoff DD, Ramanathan RK, Borad MJ, Laheru DA, Smith LS, et al. (2011) Gemcitabine Plus nab-Paclitaxel Is an Active Regimen in Patients With Advanced Pancreatic Cancer: A Phase I/II Trial. Journal of Clinical Oncology 29: 4548–4554.
43. Hook EB (2000) Re: ‘‘Neighborhood social environment and risk of death: multilevel evidence from the Alameda County study’’. Am J Epidemiol 151: 1132–1133.
44. Yen IH, Kaplan GA (1999) Neighborhood social environment and risk of death: multilevel evidence from the Alameda County Study. Am J Epidemiol 149: 898– 907.
45. Mell LK, Dignam JJ, Salama JK, Cohen EEW, Polite BN, et al. (2010) Predictors of Competing Mortality in Advanced Head and Neck Cancer. Journal of Clinical Oncology 28: 15–20.
46. Engelhardt JB, Kisiel T, Nicholson J, Mulichak L, DeMatteis J, et al. (2008) Impact of a care coordination and support strategic partnership on clinical outcomes. Home Healthc Nurse 26: 166–172.
47. Brewster DH, Thomson CS, Hole DJ, Black RJ, Stroner PL, et al. (2001) Relation between socioeconomic status and tumour stage in patients with breast, colorectal, ovarian, and lung cancer: results from four national, population based studies. BMJ 322: 830–831.
48. Paquette I, Finlayson SRG (2007) Rural Versus Urban Colorectal and Lung Cancer Patients: Differences in Stage at Presentation. Journal of the American College of Surgeons 205: 636–641.
49. Booth CM, Li G, Zhang-Salomons J, Mackillop WJ (2010) The impact of socioeconomic status on stage of cancer at diagnosis and survival: a population-based study in Ontario, Canada. Cancer 116: 4160–4167.