Copyright © 2009 by Sociedade Brasileira de Pediatria
O
RIGINALA
RTICLEInfluence of programmed physical activity on body
composition among adolescent students
Edson S. Farias,1 Flaviano Paula,2 Wellington R. G. Carvalho,3
Ezequiel M. Gonçalves,3 Alexandre D. Baldin,3 Gil Guerra-Júnior4
Abstract
Objective:To verify the influence of programmed physical activity on body composition among adolescent students during 1 school year.
Methods:The sample included 383 students (age range: 10 to 15 years) separated into two groups: 186 cases (96 male and 90 female) and 197 controls (108 male and 89 female). This was an intervention study with pre- and post-test assessments in which interventions consisted of programmed physical activity; the control group had conventional school physical education. Body composition was assessed by anthropometric measurements, body mass index (BMI), body fat percentage and fat and lean body mass.
Results:In the case group, subscapular skinfold thickness, BMI, body fat percentage and fat body mass remained stable; there were significant reductions in tricipital skinfold thickness and in abdominal perimeter among girls and significant increases in arm, waist and calf perimeters and in lean body mass. In the control group, there were significant increases in BMI, tricipital skinfold thickness, abdominal perimeter and fat body mass among girls. At post-test, overweight and obesity significantly decreased among case group subjects, but not among controls.
Conclusion:Programmed physical activity resulted in improvement or maintenance of body composition parameters and in reduction of overweight and obesity in the intervention group.
J Pediatr (Rio J). 2009;85(1):28-34:Motor activity, school health, body composition, obesity, overweight.
Introduction
The technological changes of the past decades have made children and adolescents less active, which has contributed to increasing the frequency of overweight and obesity among the age group.1,2Obesity has multifactorial etiology, but its
primary physiopathology is the high ratio of calorie intake to calorie consumption. The energy imbalance leads to accumu-lated energy in adipocytes, causing hypertrophy, hyperpla-sia, and abnormalities in adipocyte function, especially endoplasmic reticulum and mitochondrial function.
Intracel-1. Doutorando, Curso de Pós-Graduação em Saúde da Criança e do Adolescente, Faculdade de Ciências Médicas, Universidade Estadual de Campinas (UNI-CAMP), Campinas, SP, Brazil. Laboratório de Crescimento e Composição Corporal, Centro de Investigação em Pediatria (CIPED), Departamento de Pediatria, Faculdade de Ciências Médicas, UNICAMP, Campinas, SP, Brazil. Professor, Departamento de Educação Física e Desporto, Universidade Federal do Acre (UFAC), Rio Branco, AC, Brazil.
2. Educador físico. Universidade Federal de Rondônia (UNIR), Porto Velho, RO, Brazil.
3. Doutorando, Curso de Pós-Graduação em Saúde da Criança e do Adolescente, Faculdade de Ciências Médicas, UNICAMP, Campinas, SP, Brazil. Laboratório de Crescimento e Composição Corporal, CIPED, Departamento de Pediatria, Faculdade de Ciências Médicas, UNICAMP, Campinas, SP, Brazil.
4. Professor livre-docente, Departamento de Pediatria, Faculdade de Ciências Médicas, UNICAMP, Campinas, SP, Brazil. Laboratório de Crescimento e Compo-sição Corporal, CIPED, Departamento de Pediatria, Faculdade de Ciências Médicas, UNICAMP, Campinas, SP, Brazil.
Financial support: CNPq (bursary students: E.S.F. and E.M.G.) and Capes (bursary students: W.R.G.C. and A.D.B.).
No conflicts of interest declared concerning the publication of this article.
Suggested citation:Farias ES, Paula F, Carvalho WR, Gonçalves EM, Baldin AD, Guerra-Júnior G. Influence of programmed physical activity on body com-position among adolescent students. J Pediatr (Rio J). 2009;85(1):28-34.
Manuscript received Sep 17 2008, accepted for publication Dec 01 2008.
doi:10.2223/JPED.1864
lular and systemic consequences include insulin resistance, adipokine production, free fatty acids, inflammatory media-tors, and the promotion of systemic dysfunction which are seen in the clinical manifestations and sequelae of obesity.3
Thus, overweight/obese children and adolescents have come to suffer from adult diseases: some early in life, such as psychosocial conditions, depression, isolation, and low self-esteem; and others later in life, such as high blood pres-sure, diabetes, and cardiovascular disease.3-6Ferreira et al.7 have found a relationship between metabolic syndrome (MS) and risk factors for cardiovascular disease and insulin resis-tance among obese children, data confirmed by a review by Lottenberg et al.8
Physical activity can foster key changes in body composi-tion and lean mass, thus becoming an important factor in con-trolling overweight/obesity among children and adolescents. Metanalysis assessing treatment of pediatric obesity has shown that there are limitations to the effects of pharmaco-logical interventions and short term changes in lifestyle (under six months of treatment).9However, reviews of long term studies (over 12 months of practice) have shown promising results for the influence of physical activity on lifestyle changes and, consequently, on body composition, both for preventing and for treating overweight/obesity among children and adolescents.10-12
Therefore, the goal of this study was to assess the influ-ence of programmed physical activity on body composition among adolescents during 1 school year.
Methods
The present study was approved by the research ethics committee of the Universidade Estadual de Campinas (UNI-CAMP) Faculdade de Ciências Médicas (Report no. 218/ 2005). The study was undertaken in the city of Porto Velho, Rondônia, in northern Brazil, with the approval all school direc-tors and parents/guardians of schoolchildren involved.
All students included in the study were enrolled in grades five through eight in 2006 and regularly attended classes. Stu-dents with permanent or temporary physical impairments which hindered anthropometric measurements were excluded from the study, as well as those which missed over 25% of all Physical Education classes during the study. When the study began, the sample consisted of 497 students, but it decreased due to personal complications (loss = 53 students), and the need at the end of the study to adjust sample size to increase the statistical discriminatory power of the variables (loss = 61 students); the study finished with 383 students, all rang-ing from 10 to 15 years old.
This is a longitudinal intervention study with pre- and post-tests in which students were intentionally divided into two groups: students from Colégio Adventista were assigned to the case group (n = 186), while students from Colégio Obje-tivo were assigned to the control group (n = 197).
Both groups were submitted to two 60-minute physical education classes per week, totaling 68 classes during the school year. Control group students performed physical activi-ties considered routine in the school, such as playing games, calisthenics, learning the fundamentals of particular sports, and playing sports. Meanwhile, case group students were sub-mitted to programmed physical activity, with the maximum heart rate (HRmax)13of each student monitored by the Geo-naute®CW 500.0 heart rate monitors. Initially, the case group performed light intensity physical activities, with 40 to 55% HRmax,13for a maximum period of 1/3 of the study, time needed to allow it to jump to 55 to 75% HRmax.13Classes consisted of three sections: first, aerobic activity (flexibility exercises, jumping rope, walking, alternating running, jump-ing in continuous rhythm, recreational games) for 30 minutes; second, playing sports (volleyball, indoor soccer, handball, swimming) for 30 minutes; and, third, stretching for 10 minutes.
Early in the study, case and control groups were similar in terms of age, gender, socioeconomic status (as assessed via survey, using the Brazilian Associação Nacional de Empresas de Pesquisa (ABEP) classification14) (Table 1), and puberal development (self-assessed, according to breast stage for girls15and genital stage for boys16) (Table 2). The data did not significantly diverge at the end of the study.
Body composition was assessed using anthropometric weight (kg), height (cm), subscapular and tricipital skinfold (cm), arm, waist, abdomen and calf perimeter (cm) measure-ments, following standards set by Petroski et al.17All mea-surements above were taken at the beginning and the end of the study.
Body composition measurements were used to calculate:
- Body mass index (BMI) (kg/m2), data turned into z score,18 and students assessed as normal if zBMI ≤ 1.0, overweight if zBMI > 1.0 and < 2.0, and obese if zBMI ≥ 2.0.
- Body fat percentage (fat percentage), from equations developed by Slaughter et al.19Such equations use the tri-cipital and subscapular skinfolds, and take gender, race (black and white), and sexual maturity into consideration.
- Fat and lean masses (kg), using the formula from Behnke e Wilmore20: fat mass (FM) = weight (kg) X (fat percentage/ 100) and lean mass (LM) = weight - FM.
To determine the statistical power of the sample, we used thefpowerSAS software application, which calculates the sample size needed to achieve a certain power. After defining sample size, all variables had discriminatory power over 80%, and most were above 90%.
for age and socioeconomic status, was used to compare mea-surements between groups (cases and controls), genders (male and female), and time (pre- and post-test). BMI z score between assessments were compared using the symmetry test and McNemar's test. A 5% significance level was adopted for statistical tests.
Results
Table 3 shows results for weight, height, BMI, subscapu-lar and tricipital skinfolds, arm, waist, abdomen and calf perimeters, fat and lean and fat mass percentages. The data were assessed according to gender (male and female), type (case and control groups), and time (pre- and post-test), and adjusted for age and socioeconomic status (repeated-measures ANOVA).
Weight was significantly higher for boys than for girls (p = 0.02) and at post-test than at pre-test (p < 0.01). Height was significantly higher at post-test than at pre-test only for the case group (p = 0.01), and for boys than for girls only at post-test (p < 0.01). BMI was significantly higher at post-test than at pre-test only among controls (p = 0.03).
For subscapular and tricipital skinfolds, overall, values were higher for girls than for boys, at pre-test than at post-test, and for controls than for cases. The subscapular skinfold was significantly higher at post-test for controls than for cases (p < 0.01). Tricipital skinfold was significantly higher for girls than for boys (p = 0.04), at pre-test than at post-test (p < 0.01), and among controls than among cases (p = 0.04).
Table 1- Age, gender and socioeconomic status of case and control groups
Cases (%) Controls (%) p
Age (years) 12.3±1.1 (10.4-14.5) 12.5±1.2 (10.4-14.7) 0.67
Gender 0.53
Male 96 (51.6) 108 (54.8)
Female 90 (48.4) 89 (45.2)
Socioeconomic status 0.21
A 72 (38.7) 84 (42.6)
B 100 (53.8) 106 (53.8)
C 14 (7.5) 7 (3.6)
Table 2- Puberty data between genders for case and control groups
Cases, 95%CI age (years) Controls, 95%CI age (years)
Puberty15,16 Male (n) Female (n) Male (n) Female (n)
1 30 (11.2-11.6) 27 (11.0-11.7) 29 (10.8-11.2) 18 (10.8-11.3)
2 29 (11.8-12.5) 40 (11.7-12.1) 35 (12.2-12.6) 42 (11.0-11.6)
3 27 (13.1-13.4) 13 (12.9-13.3) 29 (13.2-13.7) 15 (12.8-13.2)
4 10 (14.1-14.5) 8 (13.9-14.2) 15 (14.0-14.3) 9 (13.6-13.9)
5 - 2 (13.8-14.7) - 5 (13.8-14.3)
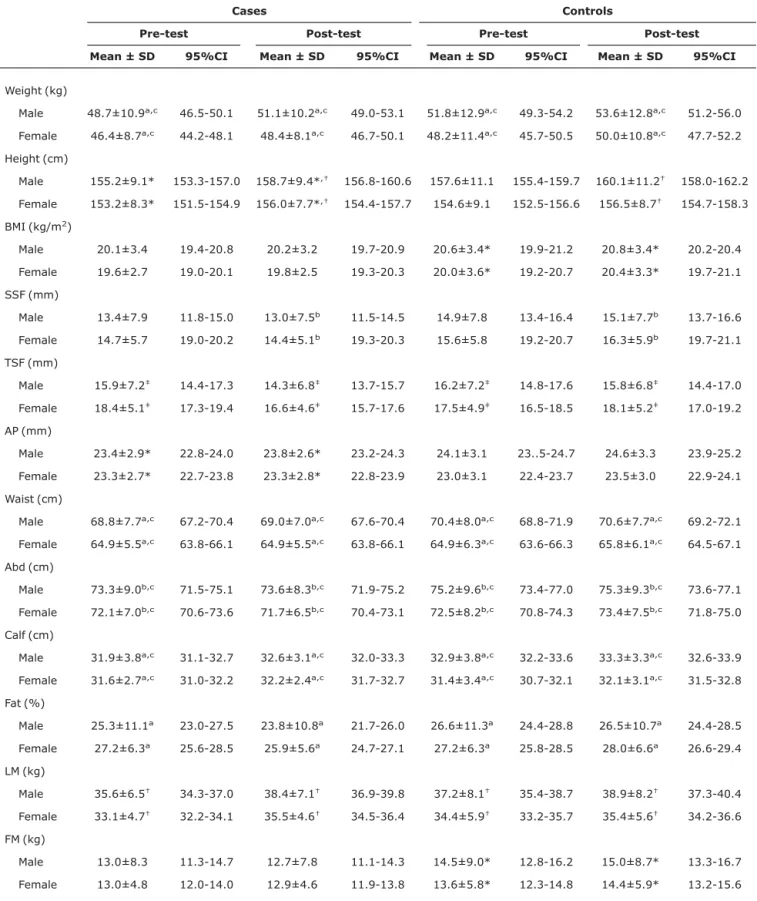
Table 3- Mean, standard deviation and 95% confidence interval data for weight, height, BMI, skinfolds, arm, waist, abdomen and calf perimeters, fat and lean and fat mass percentages by gender, group, case and control, and at pre- and post-test
Cases Controls
Pre-test Post-test Pre-test Post-test Mean ± SD 95%CI Mean ± SD 95%CI Mean ± SD 95%CI Mean ± SD 95%CI
Weight (kg)
Male 48.7±10.9a,c 46.5-50.1 51.1±10.2a,c 49.0-53.1 51.8±12.9a,c 49.3-54.2 53.6±12.8a,c 51.2-56.0
Female 46.4±8.7a,c 44.2-48.1 48.4±8.1a,c 46.7-50.1 48.2±11.4a,c 45.7-50.5 50.0±10.8a,c 47.7-52.2
Height (cm)
Male 155.2±9.1* 153.3-157.0 158.7±9.4*,† 156.8-160.6 157.6±11.1 155.4-159.7 160.1±11.2† 158.0-162.2
Female 153.2±8.3* 151.5-154.9 156.0±7.7*,† 154.4-157.7 154.6±9.1 152.5-156.6 156.5±8.7† 154.7-158.3
BMI (kg/m2)
Male 20.1±3.4 19.4-20.8 20.2±3.2 19.7-20.9 20.6±3.4* 19.9-21.2 20.8±3.4* 20.2-20.4
Female 19.6±2.7 19.0-20.1 19.8±2.5 19.3-20.3 20.0±3.6* 19.2-20.7 20.4±3.3* 19.7-21.1
SSF (mm)
Male 13.4±7.9 11.8-15.0 13.0±7.5b 11.5-14.5 14.9±7.8 13.4-16.4 15.1±7.7b 13.7-16.6
Female 14.7±5.7 19.0-20.2 14.4±5.1b 19.3-20.3 15.6±5.8 19.2-20.7 16.3±5.9b 19.7-21.1
TSF (mm)
Male 15.9±7.2‡ 14.4-17.3 14.3±6.8‡ 13.7-15.7 16.2±7.2‡ 14.8-17.6 15.8±6.8‡ 14.4-17.0
Female 18.4±5.1‡ 17.3-19.4 16.6±4.6‡ 15.7-17.6 17.5±4.9‡ 16.5-18.5 18.1±5.2‡ 17.0-19.2
AP (mm)
Male 23.4±2.9* 22.8-24.0 23.8±2.6* 23.2-24.3 24.1±3.1 23..5-24.7 24.6±3.3 23.9-25.2
Female 23.3±2.7* 22.7-23.8 23.3±2.8* 22.8-23.9 23.0±3.1 22.4-23.7 23.5±3.0 22.9-24.1
Waist (cm)
Male 68.8±7.7a,c 67.2-70.4 69.0±7.0a,c 67.6-70.4 70.4±8.0a,c 68.8-71.9 70.6±7.7a,c 69.2-72.1
Female 64.9±5.5a,c 63.8-66.1 64.9±5.5a,c 63.8-66.1 64.9±6.3a,c 63.6-66.3 65.8±6.1a,c 64.5-67.1
Abd (cm)
Male 73.3±9.0b,c 71.5-75.1 73.6±8.3b,c 71.9-75.2 75.2±9.6b,c 73.4-77.0 75.3±9.3b,c 73.6-77.1
Female 72.1±7.0b,c 70.6-73.6 71.7±6.5b,c 70.4-73.1 72.5±8.2b,c 70.8-74.3 73.4±7.5b,c 71.8-75.0
Calf (cm)
Male 31.9±3.8a,c 31.1-32.7 32.6±3.1a,c 32.0-33.3 32.9±3.8a,c 32.2-33.6 33.3±3.3a,c 32.6-33.9
Female 31.6±2.7a,c 31.0-32.2 32.2±2.4a,c 31.7-32.7 31.4±3.4a,c 30.7-32.1 32.1±3.1a,c 31.5-32.8
Fat (%)
Male 25.3±11.1a 23.0-27.5 23.8±10.8a 21.7-26.0 26.6±11.3a 24.4-28.8 26.5±10.7a 24.4-28.5
Female 27.2±6.3a 25.6-28.5 25.9±5.6a 24.7-27.1 27.2±6.3a 25.8-28.5 28.0±6.6a 26.6-29.4
LM (kg)
Male 35.6±6.5† 34.3-37.0 38.4±7.1† 36.9-39.8 37.2±8.1† 35.4-38.7 38.9±8.2† 37.3-40.4
Female 33.1±4.7† 32.2-34.1 35.5±4.6† 34.5-36.4 34.4±5.9† 33.2-35.7 35.4±5.6† 34.2-36.6
FM (kg)
Male 13.0±8.3 11.3-14.7 12.7±7.8 11.1-14.3 14.5±9.0* 12.8-16.2 15.0±8.7* 13.3-16.7
Female 13.0±4.8 12.0-14.0 12.9±4.6 11.9-13.8 13.6±5.8* 12.3-14.8 14.4±5.9* 13.2-15.6
95%CI = 95% confidence interval; Abd = abdomen; AP = arm perimeter; BMI = body mass index; FT = fat mass; LM = lean mass; SD = standard deviation; SSF = subscapular skinfold; TSF = tricipital skinfold.
p < 0.05 for a = time, b = type, c = gender. Interactions:
* a + b = time + type.
†a + c = time + gender.
For arm, waist, abdomen and calf perimeters, overall, val-ues were higher for boys than for girls, at post-test than at pre-test, and for controls than for cases. Arm perimeter was significantly higher at post-test than at pre-test for the case group (p = 0.04). Waist perimeter was significantly higher for boys than for girls (p < 0.01), and at post-test than at pre-test (p < 0.01). Abdominal perimeter was significantly higher for boys than for girls (p = 0.03) and for control than for cases (p = 0.03). Calf perimeter was significantly higher for boys than for girls (p = 0.03) and at post-test than at pre-test (p = 0.02).
Fat percentages were significantly higher at pre-test than at post-test (p < 0.01), and fat mass greater at post-test than at pre-test in the control group (p = 0.04). Lean mass was significantly higher for boys than for girls (p < 0.01), and at post-test than at pre-test (p < 0.01).
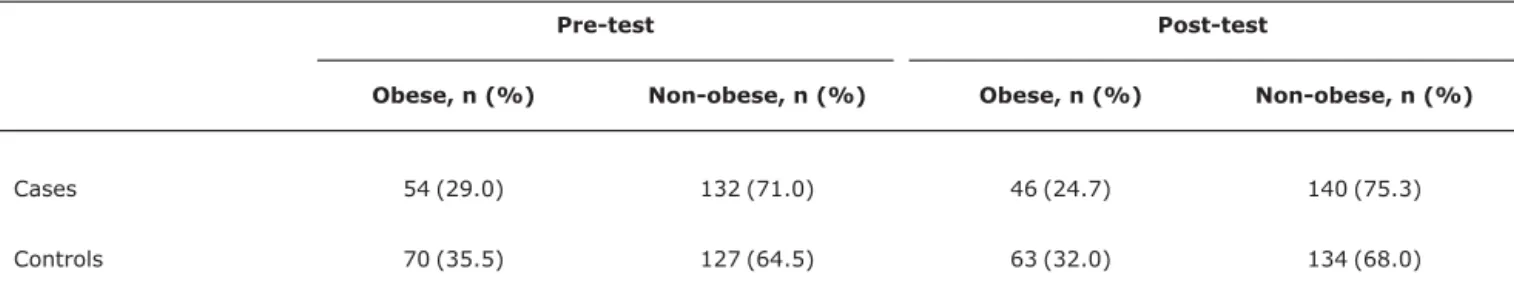
Table 4 shows the frequency of obesity and non-obesity (normal and overweight) cases according to BMI z score, divided into cases and controls and pre- and post-test. The case group saw significant drops in the ratio of obesity at post-test (24.7%) from pre-test (29%) (p = 0.04). The same drop was not found in the control group, which had 35.5% obese subjects at pre-test and 32% at post-test (p = 0.09).
Discussion
Regular physical activity programs have only come under greater scrutiny in the last few years. However, over time, sev-eral studies have sought to investigate the effects of this sort of training in improving different components of body composition.9-12,21
After adjusting for age and socioeconomic status before and after the intervention period, the results show changes in body composition variables, with a trend of decreasing body adiposity among the case group unseen among controls, especially in skinfolds, fat percentage, and fat mass.
For adolescents, we should stress that changes are not always so appreciable due to metabolic changes produced during the training process,21and, primarily, due to changes in growth and body composition characteristic of growth
spurts and sexual maturation,22when as a rule a positive energy balance is needed for accumulation as fat during this stage of development.23
Changes in skinfolds, especially the tricipital skinfold, with decreases in post-test values, especially for the case group, were also seen by other authors.24,25In this study, arm perim-eter increased significantly in relation to time for the case group, but remained stable among controls. Calf perimeter had time and gender differences for both groups. Arm and calf perimeters increased, except for female case arms, with higher results for boys, perhaps because of the prevalence of muscle development in these regions of the body among men. Possible factors for these results are strength work of the lower and upper limbs (arm, thigh, and leg) through physical train-ing developed durtrain-ing school physical activity, with greater fat burn and stimuli for muscles in the region; the intrinsic male characteristic of having greater muscle mass than girls; the fact that boys are more active than girls, especially in moder-ate and high physical activities which demand gremoder-ater strength.
Waist and abdominal perimeters are strong indicators of subcutaneous and visceral adiposity. They are highly corre-lated to individual predisposition to conditions such as diabe-tes and cardiovascular disease.3-8There were significant differences between both study groups (case and control) in the gender variable, showing greater enhancement for boys than for girls in terms of waist and abdomen measurements pre- and post-test. Such findings may be related to body com-position characteristics determined by gender during puberty.
Regarding fat percentage, both male and female subjects from the case group had decreases at post-test over pre-test measurements, but the same was not found in the control group, especially for girls. Thus, at the end of puberty, girls have proportionally twice as much fat as boys. Some inter-vention studies26,27done with adolescents show similar results regarding fat percentage.
The study showed significant increases in lean mass for time and gender in both study groups. This result can also be
Table 4- Obesity frequency data according to BMI z score for control and case groups at pre- and post-test
Pre-test Post-test
Obese, n (%) Non-obese, n (%) Obese, n (%) Non-obese, n (%)
Cases 54 (29.0) 132 (71.0) 46 (24.7) 140 (75.3)
explained by the body changes which coincide with the growth spurts of puberty. However, fat mass decreased for both gen-ders in the case group from pre- to post-test, which was not true for controls, which saw increases in fat mass. This data point can be associated to the positive effect the intensity of programmed physical activity had on fat mass directly. Changes from physical activity with increases in lean mass and decreases in fat mass are well documented in the literature.28,29
The current study also showed significant drops in the fre-quency of obesity in the case group (but not among controls) at post-test over pre-test. Therefore, we can say that physi-cal activity focused on promoting health, done during school activities, even if it does not promote significant decreases in body fat, while compliance lasts does at least prevent its increase. This is true even during puberty, a stage in people's lives in which changes in body composition more often pre-dispose adolescents to increases in body adiposity.
Acknowledgements
We would like to thank CNPq (E.S.F. and E.M.G.) and CAPES for doctoral scholarships (W.R.G.C. and A.D.B.), and to the Physical Education teachers of every school for their aid in our assessments.
References
1. Mauriello LM, Sherman KJ, Driskell MM, Prochaska JM.Using interactive behavior change technology to intervene on physical activity and nutrition with adolescents. Adolesc Med State Art Rev. 2007;18:383-99.
2. Rey-López JP, Vicente-Rodríguez G, Biosca M, Moreno LA.
Sedentary behaviour and obesity development in children and adolescents. Nutr Metab Cardiovasc Dis. 2008;18:242-51.
3. de Ferranti S, Mozaffarian D.The perfect storm: obesity, adipocyte dysfunction, and metabolic consequences.Clin Chem. 2008;54:945-55.
4. Wang Y, Liang H, Tussing L, Braunschweig C, Caballero B, Flay B. Obesity and related risk factors among low socio-economic status minority students in Chicago.Public Health Nutr. 2007;10:927-38.
5. Del-Rio-Navarro BE, Valazquez-Monroy O, Lara-Esqueda A, Violante-Ortiz R, Fanghanel G, Perez-Sanchez L, et al.Obesity and metabolic risks in children.Arch Med Res. 2008;39:215-21.
6. Rodrigues AN, Perez AJ, Carletti L, Bissoli NS, Abreu GR.The association between cardiorespiratory fitness and cardiovascular risk in adolescents.J Pediatr (Rio J). 2007;83:429-35.
7. Ferreira AP, Oliveira CE, França NM. Metabolic syndrome and risk factors for cardiovascular disease in obese children: the relationship with insulin resistence (HOMA-IR). J Pediatr (Rio J). 2007; 83:21-6.
8. Lottenberg SA, Glezer A, Turatti LA.Metabolic syndrome: identifying the risk factors. J Pediatr (Rio J.). 2007;83:S204-8.
9. McGovern L, Johnson JN, Paulo R, Hettinger A, Singhal V, Kamath C, et al.Treatment of pediatric obesity. A systematic review and meta-analysis of randomized trials. J Clin Endocrinol Metab. 2008 Dec;93(12):4600-5. Epub 2008 Sep 9.
10. Ortega FB, Ruiz JR, Castillo MJ, Sjöström M.Physical fitness in childhood and adolescence: a powerful marker of health. Int J Obes (Lond). 2008;32:1-11.
11. Fogelholm M.How physical activity can work?Int J Pediatr Obes. 2008;3 Suppl 1:10-4.
12. Doak CM, Visscher TLS, Renders CM, Seidell JC.The prevention of overweight and obesity in children and adolescents: a review of interventions and programmes.Obes Rev. 2006;7:111-36.
13. Howley ET, Duncan GE, Del Corral P. Optimum intensity of exercise for fat oxidation. Med Sci Sports Exerc. 1997;29:S199.
14. Associação Nacional de Empresas de Pesquisa (ABEP). Critério de classificação econômica - Brasil.http://www.anep.org.br/ mural/anep/04-12-97-cceb.htm. Access: 18/05/2005.
15. Marshall WA, Tanner SM. Variations in the pattern of puberal changes in girls. Arch Dis Child. 1969;44:291-303.
16. Marshall WA, Tanner SM. Variations in the pattern of puberal changes in boys. Arch Dis Child. 1970;45:13-23.
17. Petroski EL. Antropometria: técnicas e padronizações. 2ª ed. Porto Alegre: Pallotti; 2003.
18. National Center for Health Statistics. 2000.http://www.cdc.gov/ epiinfo/Epi6/Elln6.htm. Access: 20/11/2005.
19. Slaughter MH, Lohman TG, Boileau R A, Horswill CA, Stillman RJ, Van Loan MD, et al.Skinfold equations for estimation of body fatness in children and youth. Hum Biol. 1988;60:709-23.
20. Behnke AR, Wilmore JH. Evaluation and regulation of body build and composition. New Jersey: Prentice Hall; 1974.
21. Cawley J.The cost-effectiveness of programs to prevent or reduce obesity: the state of the literature and a future research agenda. Arch Pediatric Adolesc Med. 2007;161:611-4.
22. Parent AS, Teilmann G, Juul A, Skakkebaek NE, Toparri J, Bourguignon JP.The timing of normal puberty and the age limits of sexual precocity: variations around the world, secular trends, and changes after migration.Endocr Rev. 2003;24:668-93.
23. Jasik CB, Lustig RH.Adolescent obesity and puberty: the "perfect storm".Ann N Y Acad Sci. 2008;1135:265-79.
24. Dollman J, Ridley K, Magarey A, Martin M, Hemphill E.Dietary intake, physical activity and TV viewing as mediators of the association of socioeconomic status with body composition: a cross-sectional analysis of Australian youth.Int J Obes (Lond). 2007;31:45-52.
25. Singh AS, Chin A Paw MJ, Brug J, Van Mechelen WV.Short-term effects of school-based weight gain prevention among adolescents. Arch Pediatr Adolesc Med. 2007;161:656-71.
26. Ara I, Vicente-Rodrigues G, Perez-Gomez J, Jimenez-Ramirez J, Serrano-Sanchez JA, Dorado C, et al.Influence of extracurricular sport activities on body composition and physical fitness in boys: a 3-year longitudinal study.Int J Obes. 2007;30:1062-71.
28. Savoye M, Shaw M, Dziura J, Tamborlane WV, Rose P, Guandalini C, et al.Effects of a weight management program on body composition and metabolic parameters in overweigth children: a randomized controlled trial.JAMA. 2007;297: 2697-704.
29. Thornton MK, Potteiger JA.Effects of resistance exercise bouts of different intensities but equal work on EPOC.Med Sci Sports Exerc. 2002;34:715-22.
Correspondence: Gil Guerra-Júnior
Departamento de Pediatria - CP 6111 Faculdade de Ciências Médicas - UNICAMP CEP 13083-970 - Campinas, SP - Brazil Tel.: +55 (19) 3521.8923