Weed Dynamics during Transition to
Conservation Agriculture in Western Kenya
Maize Production
Judith A. Odhiambo1, Urszula Norton1,2*, Dennis Ashilenje3, Emmanuel C. Omondi4, Jay B. Norton4
1Department of Plant Sciences, University of Wyoming, Dept. 3354, 1000 E. University Ave., Laramie, WY 82071, United States of America,2Program in Ecology, University of Wyoming, Laramie, WY 82071, United States of America,3Manor House Agricultural Centre, Private Bag, Kitale, 30200, Kenya,4Department of Ecosystem Science and Management, Dept. 3354, 1000 E. University Ave., Laramie, WY 82071, United States of America
Abstract
Weed competition is a significant problem in maize (Zea mays, L.) production in Sub-Saharan Africa. Better understanding of weed management and costs in maize inter-cropped with beans (Phaseolus vulgaris, L.) during transition to conservation agricultural systems is needed. Changes in weed population and maize growth were assessed for a period of three years at Bungoma where crops are grown twice per year and at Trans-Nzoia where crops are grown once per year. Treatments included three tillage practices: minimum (MT), no-till (NT) and conventional (CT) applied to three cropping systems: continuous maize/bean intercropping (TYPICAL), maize/bean intercropping with relayed mucuna after bean harvest (RELAY) and maize, bean and mucuna planted in a strip intercropping arrangement (STRIP). Herbicides were used in NT, shallow hand hoeing and herbicides were used in MT and deep hoeing with no herbicides were used in CT. Weed and maize performance in the maize phase of each cropping system were assessed at both locations and costs of weed control were estimated at Manor House only. Weed density of grass and forb species declined significantly under MT and NT at Manor House and of grass species only at Mabanga. The greatest declines of more than 50% were observed as early as within one year of the transition to MT and NT in STRIP and TYPICAL cropping systems at Manor House. Transitioning to conservation based systems resulted in a decline of four out of five most dominant weed species. At the same time, no negative impact of MT or NT on maize growth was observed. Corresponding costs of weed management were reduced by $148.40 ha-1in MT and $149.60 ha-1in NT compared with CT. In conclusion, farmers can
benefit from effective and less expensive weed management alternatives early in the pro-cess of transitioning to reduced tillage operations.
OPEN ACCESS
Citation:Odhiambo JA, Norton U, Ashilenje D, Omondi EC, Norton JB (2015) Weed Dynamics during Transition to Conservation Agriculture in Western Kenya Maize Production. PLoS ONE 10(8): e0133976. doi:10.1371/journal.pone.0133976
Editor:Jose Luis Gonzalez-Andujar, Instituto de Agricultura Sostenible (CSIC), SPAIN
Received:August 11, 2014
Accepted:July 3, 2015
Published:August 3, 2015
Copyright:© 2015 Odhiambo et al. This is an open access article distributed under the terms of the Creative Commons Attribution License, which permits unrestricted use, distribution, and reproduction in any medium, provided the original author and source are credited.
Data Availability Statement:All relevant data are within the paper.
Introduction
Smallholder farmers in Sub-Saharan Africa (SSA) grow maize (Zea mays, L.) intercropped with beans (Phaseolus vulgaris, L.) every year. They use animal-drawn plows and hand hoes to invert the soil. Frequent deep tillage however, causes significant declines in soil fertility and conse-quently, crop yields [1,2]. Weed competition with crops is also a very serious problem in SSA and using tillage for weed control has not been very effective [3,4].
A number of conservation agriculture (CA) practices designed to replace or improve contin-uous maize/bean intercropping in the region intend to introduce nitrogen (N) fixing cover crops, reduce soil disturbance and retain surface crop residues [5]. Ultimately, these practices should improve crop yields [6], reduce costs of crop production [7], increase soil organic mat-ter (SOM) content and improve long-mat-term soil health [8]. However, adoption of CA is often hindered by farmers’limited understanding of the changes in weed control practices and crop performance during the transition period [9].
Western Kenya has a bimodal pattern of precipitation characterized by the long and short rainy seasons (Fig 1). Crops are grown during one long growing season in the cooler, higher-elevation region and during two growing seasons in the warmer, lower-higher-elevation region. Grow-ing crops durGrow-ing two growGrow-ing seasons however, necessitates more frequent tillage and results in shorter periods of soil rest [10].
Farmers recognize the benefits of reducing tillage but remain uncertain about managing weeds while converting from mechanical to chemical weed control. Better understanding of weed population changes during transition from frequently tilled continuous maize/bean inter-cropping to reduced or no-till CA practices can therefore, ensure successful adoption [11]. It is known that transition to reduced tillage practices without using herbicides has resulted in high weed densities and reduced crop yields in some areas of SSA [12]. Farmers often perceive the use of chemical weed control as cost prohibitive and they lack training on herbicide application [13]. In addition, effects of leguminous cover crops on weed species assemblages are unclear. For example, velvet bean, also known as mucuna (Mucuna pruriens(L.) DC.) is successfully used in other parts of the world. Not only does it fix atmospheric N, but its rapidly growing
Fig 1. Annual crop and field management practices associated with two growing seasons (Mabanga) and one growing season (Manor House).
doi:10.1371/journal.pone.0133976.g001 Competing Interests:The authors have declared
biomass is capable of suppressing weeds [14–16] and stimulating suicidal germination of the purple witchweed, also known as striga (Striga hermonthica), a parasite that targets maize [17].
This project is a part of a larger study assessing alternative CA practices that incorporate reducing tillage and introducing cover crops. The main objective was to evaluate the effects of transition from conventional maize/bean intercropping to CA tillage and cropping systems on weed population, maize growth and management costs. We hypothesized that reducing tillage and rotating maize/bean intercropping with mucuna cover crop result in declines in weed den-sity and diverden-sity with no negative impact on maize performance and reduction in weed man-agement costs.
Materials and Methods
Site Characteristics
The study was conducted for three years (2011 to 2013) at two sites in western Kenya. Manor House Agricultural Center (Manor House) in Trans-Nzoia County is located at 1,890 meters elevation, at 010°010N LAT and, 35° 000E LONG in the upper midland agro-ecological zone [18]. The site receives 1,300 mm of rainfall annually with mean average air temperature of 20°C [19]. Mabanga Farmers Training Center (Mabanga) in Bungoma County is located at 1,433 meters elevation, at 00°350N LAT and 34°340E LONG in the lower midland agro-ecologi-cal zone [18]. The site receives 1,100 mm of rainfall annually with mean average temperature of 23°C [19]. The two locations experience bimodal rainfall with a long rainy season between March and August and a short rainy season between September and November (Fig 1). Farm-ers in Trans-Nzoia grow crops during one long cropping season that spans both the long and short rainy seasons. In Bungoma average temperatures are 3°C higher than in Trans-Nzoia, which allows farmers to grow crops twice per year during long and short rainy seasons. Soils at both locations are Ferrasols with high contents of kaolinite clay and low pH [20]. Soils at Manor House are classified as sandy clay loams and soils at Mabanga are clay loams. Conven-tionally tilled continuous maize/bean production was practiced at both locations before treat-ment establishtreat-ment.
Study Design
Selection of crop varieties for the two locations was based on recommendations from Kenya Seed Company Ltd. Maize H6213 hybrid was planted at Manor House and H513 hybrid was planted at Mabanga. Common bean Rosecoco-GLP2 and white seed mucuna were planted at both sites. Planting for one growing season in Manor House and for the long rainy season at Mabanga was done in mid-March (Fig 1). Mucuna was planted in mid-March in STRIP and after bean harvest in RELAY, which occurred in July at Mabanga and August at Manor House. Maize was planted every 0.3 m with row spacing of 0.75 m. Beans in TYPICAL and RELAY cropping were planted at a spacing of 0.15 m between bean plants in maize inter-rows. Beans in STRIP cropping were planted at a spacing of 0.15 m between bean plants with row spacing of 0.38 m. Mucuna was planted at a 0.5-m within-row spacing, with planting in maize inter-rows in RELAY and with 0.75-m row spacing in STRIP. Mucuna residue remained on soil sur-face in NT and was incorporated to soil in MT and CT during tillage operations. Maize was fer-tilized with 57 kg of phosphate ha-1as di-ammonium phosphate (DAP) that also delivered 19.0 kg N ha-1at planting. Additional N was top-dressed at 37.5 kg N ha-1as calcium ammonium nitrate (CAN). Beans received 60 kg phosphate ha-1as single super-phosphate (SSP) at plant-ing time.
Herbicides recommended for maize and beans were used in MT and NT only. One week before planting in March, the non-selective pre-emergence herbicide, S-metolachlor [(Dual Gold), 2-chloro-N- (2-ethyl-6-methylphenyl)-N- (2-methoxy-1-methylethyl) acetamide] and glyphosate [(Touchdown), (N-phosphonomethyl) glycine)] were applied using a hand oper-ated backpack sprayer at the rate of 576 g and 750 g ha-1, respectively. The post-emergence herbicide, bentazone [(Basagran), (3-methylehyl)-1H-2, 3-Benzothiadiazin-4(3H)-one 2, 2-dioxide] was also applied using a hand operated backpack sprayer at the rate of 600 g ha-1in NT when maize and bean plants had two to three fully developed leaves.
Weed Measurements
All measurements of plant parameters were taken annually at each location eight weeks after planting (two weeks after the last weeding in CP and MT). At that time, maize plants had seven to eight fully developed leaves (V7-V8 growth stage). This stage of maize development can be most vulnerable to competition with weeds and hence, establishment of maize yield potential [21]. All individual plants were counted to assess plant cover using a 1.0- by 0.5-m frame placed at four random locations. Plants were divided to two groups: grasses and forbs. At Manor House, all plants were identified and Shannon Diversity Index was calculated for weeds present in field in 2012 and 2013. The Shannon Diversity Index (H') was calculated based on the formula developed by Magurran [22].
H0 ¼ X
s
i¼1 ni Nx log
ni
N ð1Þ
Where:
s = number of species present
ni= total number of individuals of the ithspecies N = total number of all individual species
Cost of Weed Control
operations and equipment rental also included fuel and labor and were based on actual costs incurred.
Maize Growth
Maize height and leaf area (LA) were determined at Manor House only on five randomly selected plants also at V7-V8 maize vegetative growth stage. Plant height was assessed using a measuring tape stretched between the plant base at the soil surface and the arch of the upper-most fully developed leaf. The number of fully developed leaves on each plant was counted and leaf length and leaf width were measured and recorded. Leaf length was measured from the junction of the leaf blade collar to the leaf sheath tip and leaf width was measured from edge to edge at the widest part of the leaf. Leaf area (LA) was calculated using the equation from Mokh-tarpour et al. [23].
LA¼CðLxWÞ ð2Þ
Where:
LA = leaf area (cm-2) L = leaf length (cm)
W = leaf maximum width (cm)
C = 0.75 (correction factor calculated by Aikins et al.[24])
Leaf area index (LAI) was calculated as the sum of LAs of all fully developed leaves on indi-vidual plants per meter square of ground area (m2m-2) [25]. Leaf N concentration (LNC) was determined on the lowest fully developed leaf at V7-8 stage. The leaf was cut at the base, oven dried at 65°C and finely ground. Approximately five grams were wrapped in a 5- x 9-mm tin capsule and analyzed by dry combustion using Carlo Erba combustion on EA 1100 C/N Ana-lyzer (Carlo Erba Instruments, Milan Italy).
Statistical Analyses
All statistical analyses were performed using R software version 2.15.3 [26]. Data were analyzed using analysis of variance (ANOVA) to test the significance of year, tillage and cropping treat-ments and their interactions for each location separately. When significant, means were sepa-rated atP0.05 using Fisher’s protected least significant difference (LSD). All data were subjected to Fligner-Killeen test (Fligner test) to determine the homogeneity of variance and Q-Q plots developed to assess data normality. Weed counts were log transformed [Log (Y +1)] before statistical analyses.
Agreements about the land use for the purpose of research were signed upon inception of this project between Project Leader, Jay B. Norton from the University of Wyoming, and the leadership of the Manor House Agricultural Centre in Kitale, Kenya, and with the leadership of Farmers Training Centre under the direct supervision from the Kenya Ministry of Agriculture in Mabanga, Kenya. Documents are available for viewing upon request.
Results
Weed Density: Manor House and Mabanga
lower grass cover and 29.1% lower forb cover when compared with CT in TYPICAL and STRIP cropping.
At Mabanga, only grass cover was significantly affected by a tillage-by-cropping system interaction (Table 1). Grass cover was 44.2% and 34.4% lower under NT and MT in TYPICAL cropping compared with under CT (Fig 2C). Moreover, MT and NT in STRIP cropping and TYPICAL cropping had 30.0% and 22.1% lower grass cover compared with MT and NT in RELAY cropping.
Table 1. F-values for ANOVA of the effect of year, tillage, cropping and their interactions for grass and forb weed counts, Shannon Diversity Index (SDI), maize height and leaf area index (LAI) at Manor-House and Mabanga for 2011–2013.”*”represents statistical significance atP0.05,“**”
repre-sents statistical significance atP0.01and“***”represent statistical significance atP0.001.
Manor House Mabanga
Source DF Grass Forb SDI Maize height Maize LAI Grass Forb Maize height Maize LAI
——————————————F value——————————— ——————————F value———————
-Year 2 42.1*** 94.6*** 0.06 68.4*** 110.8*** 3.33* 7.30** 20.0*** 90.8***
Tillage 2 12.28** 13.66*** 11.16** 8.56** 8.81* 1.76 0.16 0.32 0.53
Cropping 2 0.16 1.77 3.69* 0.35 0.66 0.37 1.46 0.61 0.09
Year-by-Tillage 4 13.27*** 11.97*** 5.76** 4.52** 3.45* 0.23 0.63 0.74 1.08
Year-by- Cropping 4 0.76 2.20 3.53* 2.38* 2.92* 0.84 1.75 1.31 0.98
Tillage-by- Cropping 4 2.31* 2.39* 1.46 1.31 2.56 3.7** 1.01 0.68 1.16
Year-by-Tillage-by-Cropping 8 0.78 0.90 0.42 0.94 0.99 0.62 1.12 0.83 0.65
doi:10.1371/journal.pone.0133976.t001
Fig 2. Grass and forb weed density (plants m-2) in conventional tillage (CT), minimum tillage (MT) and no-till (NT) systems at Manor House (a and b) and Mabanga (c and d).Error bars represent standard error of the mean (n = 12). Lower case letters represent statistically significant differences between cropping systems within tillage (P0.05).“*”indicates statistically significant difference between tillage systems within cropping (P0.05).
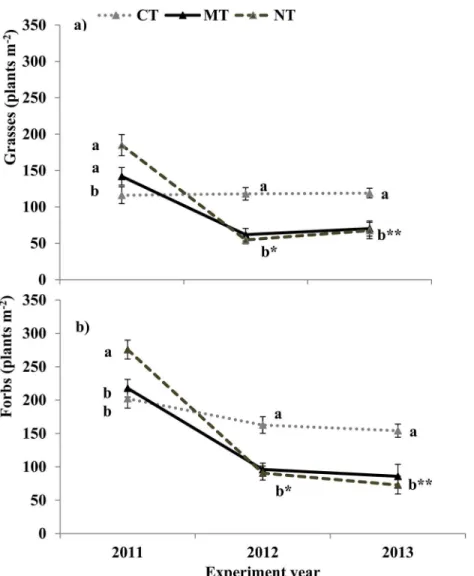
At Manor House, there was also a significant year-by-tillage interaction for grass and forb cover (Table 1). In 2011, the highest forb cover was under NT and amounted to 276 weeds m-2 followed by MT and CT. Similarly, the highest grass cover amounted to 185 weeds m-2in NT also followed by MT and CT. Weed cover in CT remained unchanged between 2011 and 2013 (Fig 3A and 3B). In 2012, however, NT demonstrated 61.4% decline in grass cover and 72.3% decline in forb cover with no change in forb and grass cover in 2013 (Fig 3A and 3B). Conse-quently, MT resulted in 51.0% decline in grass cover and 60.0% decline in forb cover between 2011 and 2012 and no change between 2012 and 2013.
Weed Species Diversity: Manor House
Three out of the nine most abundant weeds were from theAsteraceaefamily. The most fre-quently observed weeds wereAgeratum conyzoides(forb) andDigitaria abyssinica(grass). Four of the most abundant species were perennial and five were annuals. A number of weed Fig 3. Grass (a) and forb (b) weed density (plants m-2) in conventional tillage (CT), minimum tillage (MT) and no-till (NT) systems at Manor House in 2011, 2012 and 2013.Error bars represent standard error of the mean (n = 12). Lower case letters indicate statistical differences between tillage systems within each year (P0.05).“*”indicates statistically significant difference between 2011 and 2012 (P0.05) and“**”indicates statistically significant difference between 2011 and 2013 (P0.05).
species responded to tillage or cropping system but no significant response to tillage-by-crop-ping system interaction was observed (Table 2). Tillage did not affect the abundance of Agera-tum conyzoidesin contrast to the significant effect cropping system had. Moreover,Digitaria abyssinica, the second most frequently observed weed species, declined under MT but not NT in both STRIP and RELAY cropping. The greatest declines in abundance in response to reduc-ing tillage were observed inCyperus rotundus(grass) andCommelina benghalensisand Richar-dia brasiliensis(both forbs). RELAY cropping resulted in declines inAgeratum conyzoides (weak response),Digitaria abyssinica,Commelina benghalensisandCyprus rotunduswhile STRIP cropping significantly lowered the density ofAgeratum conyzoidesandDigitaria abyssi-nicaandCommelina benghalensis(weak response) andCyperus rotundus(weak response).
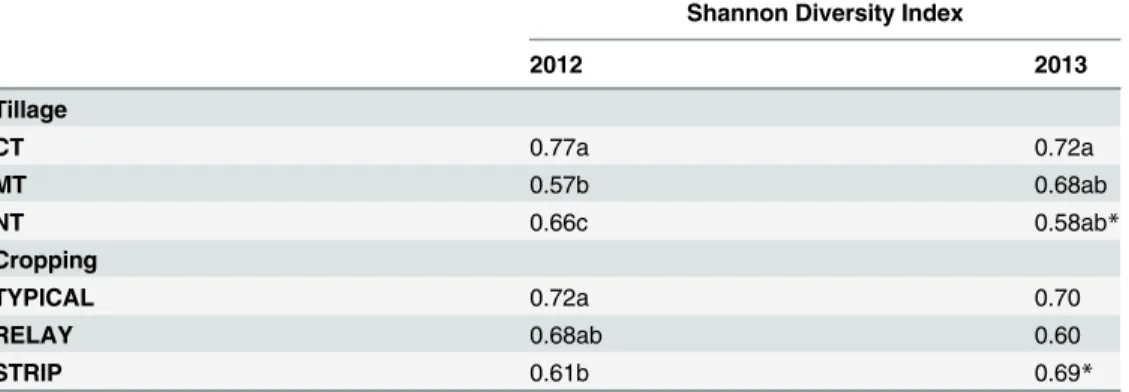
The Shannon Diversity Index demonstrated significant year-by-tillage and year-by- crop-ping system interactions (Table 1). In general, CT had the highest SDI of 0.75 in both years. The second highest SDI of 0.66 was under NT in 2012 but the values were comparable between MT and NT in 2013 (Table 3). Significant year-by-cropping interaction was observed in 2012 only when STRIP cropping had the highest SDI of 0.72 and TYPICAL cropping had the lowest SDI of 0.61 (Table 3).
Costs of Weed Control: Manor House
Costs associated with land preparation for planting were the highest in CT ($266.00 ha-1) and relied solely on animal drawn and hand hoe tillage operations (Table 4). In contrast, costs of land preparation and planting in MT and NT relied on herbicides and hand hoe or panga, which amounted to $50.00 ha-1. Costs associated with weed management after planting were $216.00 ha-1in CT and were $67.60 ha-1and $66.40 ha-1higher than in MT and NT, respec-tively. Costs of herbicides during this time amounted to $103.00 ha-1in MT and $136.00 ha-1 in NT while costs of labor associated with herbicide application amounted to $73.00 ha-1in MT and $143.00 ha-1in NT. Total costs of weed management amounted to $333.60 ha-1in MT, $332.40 ha-1in NT and $482.00 ha-1in CT.
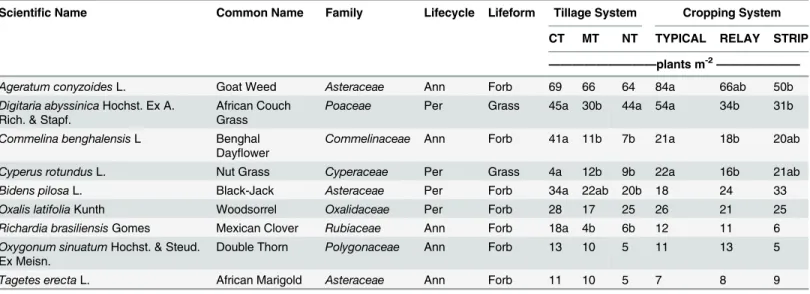
Table 2. Scientific name, common name, family, lifecycle, life-form and plant density (plants m-2) of most dominant weed species in conventional tillage (CT), minimum tillage (MT) and no-till (NT) and maize/bean intercropping (TYPICAL), maize/bean intercropping relayed with mucuna (RELAY) and maize/bean/mucuna in adjacent strips (STRIP) at Manor House in 2013.Lower case letters represent significant differences between treatments (P0.05).“Ann”stands for“annual”and“Per”stands for“perennial”.
Scientific Name Common Name Family Lifecycle Lifeform Tillage System Cropping System
CT MT NT TYPICAL RELAY STRIP
—————————plants m-2———————
Ageratum conyzoidesL. Goat Weed Asteraceae Ann Forb 69 66 64 84a 66ab 50b
Digitaria abyssinicaHochst. Ex A.
Rich. & Stapf.
African Couch Grass
Poaceae Per Grass 45a 30b 44a 54a 34b 31b
Commelina benghalensisL Benghal
Dayflower
Commelinaceae Ann Forb 41a 11b 7b 21a 18b 20ab
Cyperus rotundusL. Nut Grass Cyperaceae Per Grass 4a 12b 9b 22a 16b 21ab
Bidens pilosaL. Black-Jack Asteraceae Per Forb 34a 22ab 20b 18 24 33
Oxalis latifoliaKunth Woodsorrel Oxalidaceae Per Forb 28 17 25 26 21 25
Richardia brasiliensisGomes Mexican Clover Rubiaceae Ann Forb 18a 4b 6b 12 11 6
Oxygonum sinuatumHochst. & Steud.
Ex Meisn.
Double Thorn Polygonaceae Ann Forb 13 10 5 11 13 5
Tagetes erectaL. African Marigold Asteraceae Ann Forb 11 10 5 7 8 9
Maize Growth: Manor House
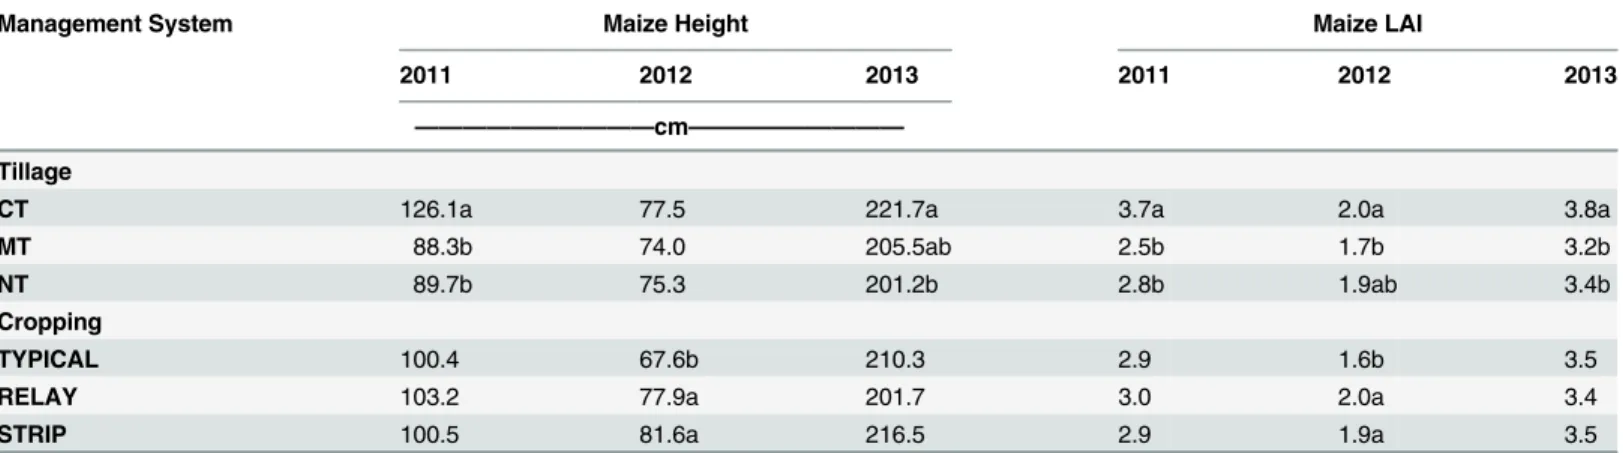
Despite large inter-annual variability observed at the two locations, interactions between year-by-tillage and year-by- cropping for LAI and maize height were significant at Manor House (Table 1). In 2011, maize plants in CT were 37.8 cm and 33.3 cm taller than in MT and NT, respectively, while in 2013, maize plants in CT were 20.5 cm taller than in NT (Table 5). Table 3. Shannon Diversity in conventional tillage (CT), minimum tillage (MT) and no-till (NT) and maize/bean intercropping (TYPICAL), maize/bean intercropping relayed with mucuna (RELAY) and maize/bean/mucuna in adjacent strips (STRIP) at Manor House in 2012 and 2013.Lower case letters indicate statistical differences between different tillage and cropping systems within a year (P0.05).“*” indi-cates significant differences between years within the same tillage or cropping system (P0.05).
Shannon Diversity Index
2012 2013
Tillage
CT 0.77a 0.72a
MT 0.57b 0.68ab
NT 0.66c 0.58ab*
Cropping
TYPICAL 0.72a 0.70
RELAY 0.68ab 0.60
STRIP 0.61b 0.69*
doi:10.1371/journal.pone.0133976.t003
Table 4. Production costs associated with weed control during land preparation and after planting in conventional tillage (CT), minimum tillage (MT) and no-till (NT) at Manor House obtained during long rainy season.
COSTS
CT MT NT
Management Mode/Active Ingredient Freq./
Rate
Materials Labor Total Materials Labor Total Materials Labor Total
——————US Dollars ha-1——————
Weed Control during Land Preparation:
Tillage Animal Drawn Moldboard Plow
2x 144.00
Harrowing Hand Hoe 1x 72.00 144.00
Planting Hand Hoe 1x 50.00 72.00 50.00 50.00
Jab Planter 1x 50.00 50.00 50.00
TOTAL 0.00 266.00 266.00 0.00 50.00 50.00 0.00 50.00 50.00
Weed Control after Planting:
Tillage Hand Hoe 2x (CT) 216.00 216.00 108.00 108.00
Herbicides: 1x (MT)
Dual Gold S-Metachlor 960 g L-1 576 g ha-1 54.20 36.50 90.70 54.20 36.50 90.70
Touchdown Glyphosate 500 g L-1 750 g ha-1 48.40 36.50 84.90 48.40 36.50 84.90
Basagran Bentazone 400 g L-1 600 g ha-1 33.80 73.00 106.80
TOTAL 0.00 216.00 216.00 102.60 181.00 283.60 136.40 146.00 282.40
GRAND TOTAL 0.00 482.00 482.00 102.60 231.00 333.60 136.40 196.00 332.40
Similarly, LAI in CT was consistently greater compared with MT and NT with the largest ferences of 1.2 and 0.9 between CT and MT and NT, respectively in 2011 and the smallest dif-ferences of 0.6 and 0.4 between CT and MT and NT, respectively in 2013.
In 2012, cropping system appeared to have a significant impact on both maize height and LAI (Table 5). Maize in RELAY cropping was 10.3 cm taller and in STRIP cropping was 14.0 cm taller compared with TYPICAL cropping. Similarly, LAI was 0.4 and 0.3 greater in RELAY and STRIP compared with TYPICAL cropping.
Tillage-by-cropping interaction also significantly influenced LNC (Table 5). The differences however, were observed in CT only. Specifically, CT in RELAY cropping had the highest N content of 33.2 mg g-1(data not presented).
Discussion
Weed competition is often the main limitation to adoption of CA systems on smallholder farms [27]. Results from this project suggest that introducing minimum till and no-till in west-ern Kenya resulted in immediate declines in grass and forbs populations. Not only did the over-all grass and forb cover declined, but the most notorious weeds (two perennial grasses and two annual forbs) showed significant reduction. These findings partially contradicted results from studies by Wrucke and Arnold [28] and Chauhan et al. [29] who observed declines in forb cover but increases in grass cover and attributed the increase in grass cover to the release from competition with forbs.
Reduction in weed density were more pronounced at the higher elevation Manor House site, where crops are grown during one long growing season and managed with fewer tillage operations. In contrast, weaker weed population responses to reducing tillage in lower eleva-tion areas where crops were grown twice per year were also observed by Mandumbu et al. [30]. Gopal et al. [31] observed higher weed density following more frequent tillage in rice
production.
Herbicide use was an intricate component of the MT and NT systems in this study. Thus, declines in weed cover during the transition were also attributed to using chemicals, also in line with observations by Nyamangara et al. [32]. Consequently, better understanding of herbicide use, availability at local distribution outlets and smaller packaging can aid with adoption of alternative tillage practices by smallholder farmers. Both MT and NT resulted in weed cover Table 5. Maize plant height and leaf area index (LAI) at V7-V8 growth stages in conventional tillage (CT), minimum tillage (MT) and no-till (NT) and maize/bean intercropping (TYPICAL), maize/bean intercropping relayed with mucuna (RELAY) and maize/bean/mucuna in adjacent strips (STRIP) at Manor House in 2011, 2012 and 2013.Lower case letters indicate statistical differences between different tillage and cropping systems within a year (P0.05).
Management System Maize Height Maize LAI
2011 2012 2013 2011 2012 2013
——————————cm—————————
Tillage
CT 126.1a 77.5 221.7a 3.7a 2.0a 3.8a
MT 88.3b 74.0 205.5ab 2.5b 1.7b 3.2b
NT 89.7b 75.3 201.2b 2.8b 1.9ab 3.4b
Cropping
TYPICAL 100.4 67.6b 210.3 2.9 1.6b 3.5
RELAY 103.2 77.9a 201.7 3.0 2.0a 3.4
STRIP 100.5 81.6a 216.5 2.9 1.9a 3.5
declines in STRIP cropping andAgeratum conyzoides, the most abundant weed species, dem-onstrated the greatest decline also under STRIP cropping. Mono-cropped strips likely facili-tated more effective weed control and use of herbicides compared with RELAY or TYPICAL cropping.
Greater declines in weed density in response to reduced tillage rather than new cropping systems confirmed that the effectiveness of using cover crops to control weeds may become evident later in the transition, also proposed by Riemens et al. [33]. Transitioning to RELAY combined with reduced tillage did not affect weed cover except for grass cover increase at Mabanga. Decline in the abundance of the four most dominant weed species in maize planted under RELAY cropping however, was statistically significant, but of much smaller magnitude than changes due to reduced tillage. This observation further indicated that is too early to see the response of cover crop-based CA systems on weed control. It is known that mucuna planted before maize can smother weeds as observed by Ngwira et al. [34] and Ikuenobe and Anoliefo [35], but also terminating mucuna before maize planting may require as much as 15 to 80% more herbicide application, as observed by Andersson and D’Souza [27]. More research on timing and herbicide application using dose response approaches could help farmers man-age multiple benefits associated with cover crops.
Monitoring maize height, LAI and LNC at V7-V8 stage helped determine a possibility of plants being stressed during the fast growing vegetative phase. Reducing tillage resulted in stag-gered plant growth and lower LAI compared with CT, which confirmed earlier observations by Aikins et al.[24]. Conversely, not only were the maize plants taller and had greater LAI in RELAY managed with CT, but the same combination also demonstrated higher LNC com-pared with other systems. Since no correlation between weed density and maize yields existed, the reduced maize performance at V7-V8 stage in MT and NT were likely due to other factors emerging during the early transition stage that were not measured during this experiment.
Using MT and NT lowered operational and input costs before and after planting by about 30%. Herbicides appeared to significantly reduce costs of otherwise more expensive manual labor or rental of the tillage equipment. Thus reduced- and no-till approaches can be viable options in socio-economic settings where farmers have access and capital to purchase herbi-cides. It is also a viable option in areas where reducing tillage does not negatively impact crop production due to, for example, high accumulation of clay in the sub-surface soil horizons. Costs of manual labor however, should be considered in relative terms, as some of the work is usually performed by family members, thus reducing the overall cash flow outside of the house-hold. A combination of both reduced tillage and herbicide use may bring the most desirable effects. In addition, under certain circumstances, reducing tillage may result in temporary increases in weed density and increase the demand for manual labor and operational costs, as observed by Baudron et al. [36].
Acknowledgments
Authors would like to thank Manor House Agricultural Centre and Mabanga Farmers Training Centre for housing the study sites, Rael Otuya, Erin Anders and Liam Stockwell for the assis-tance with field sampling, laboratory analyses and data processing and Andrew Kniss and Dan-nele Peck for comments on an earlier version of this manuscript.
Author Contributions
Conceived and designed the experiments: UN JO JBN EO DA. Performed the experiments: JO UN DA EO JBN. Analyzed the data: JO UN. Contributed reagents/materials/analysis tools: UN JBN DA. Wrote the paper: JO UN JN EO DA.
References
1. Ndakidemi PA. Manipulating legume/cereal mixtures to optimize the above and below ground interac-tions in the traditional African cropping systems. Afr J Biotechnol. 2006; 5:2526–2533.
2. Tatenda RJ, Stanford M. Efficacy and economics of manual and chemical weed control strategies in the first year of conservation agriculture adoption in the highveld areas of Zimbabwe. Global Advan Res J Agric Sci. 2013; 2:231–241.
3. Sanchez PA. Soil fertility and hunger in Africa. 2002; Science 295:2019–2020. PMID:11896257
4. Schlenker W, Lobell DB. Robust impacts of climate change on African agriculture. 2010; Environ Res Letters 5, 014010.
5. Corbeels M, Graaff JD, Ndah TH, Penot E, Baudron F, Naudin K et al. Understanding the impact of adoption of conservation agriculture in Africa: A multi-scale analysis. Agric Ecosyst Environ. 2014; 187:155–170.
6. Kabamba H, Muimba-Kankolongo A. Adoption and impact of conservation farming on crop productivity among smallholder farmers in Kapiri Mposhi District of Zambia. J. Animal Plant Sci. 2009; 3:205–214.
7. Govaerts B, Verhulst N, Castellanos-Navarrete A, Sayre KD, Dixon J, Dendooven L. Conservation agri-culture and soil carbon sequestration: Between myth and farmer reality. Crit Rev Plant Sci. 2009; 28:97–122.
8. Thierfelder C, Wall PC. Investigating conservation agriculture (CA) systems in Zambia and Zimbabwe to mitigate future effects of climate change. J Crop Improv. 2010; 24:113–121.
9. Giller KE, Corbeels M, Nyamangara J, Triomphe B, Affholder F, Scopel E et al. A research agenda to explore the role of conservation agriculture in African smallholder farming systems. Field Crop Res. 2011; 124:468–472.
10. Odhiambo JA, Norton U, Omondi EC, Ashilenje D, Norton JB. Soil carbon and nitrogen mineralization and crop parameters in typical maize-bean intercropping in western Kenya. Inter J of Plant and Soil Sci. 2014; 5:127–142.
11. Chauhan BS, Gill GS, Preston C. Tillage system effects on weed ecology, herbicide activity and persis-tence: a review. Aust J Exp Agric. 2006; 46:1557–1570.
12. Chikoye D, Ellis-Jones J, Riches C, Kanyomeka L. Weed management in Africa: experiences, chal-lenges and opportunities. XVI Inter Plnt Cong. 2007; pp. 652–653.
13. Hall MR, Swanton CJ, Anderson GW. The critical period of weed control in grain corn (Zea mays). Weed Sci. 1992; 40:441–447.
14. Mashingaidze N, Madakadze C, Twomlow S, Nyamangara J, Hove L. Crop yield and weed growth under conservation agriculture in semi-arid Zimbabwe. Soil Till Res. 2012; 124:102–110.
15. Ngome AFE, Becker M, Mtei KM. Leguminous cover crops differentially affect maize yields in three con-trasting soil types of Kakamega, Western Kenya. J Agric Rural Develop. Tropics Subtropics. 2012; 112:1–10.
16. Carsky RJ, Becker M, Hauser S. Mucuna fallow for the maintenance and restoration of soil fertility of tropical cropping systems: Potential and limitations. In: Tian G et al, editors. Sustaining soil fertility maintenance in west Africa. SSSA Special Publication No. 58. SSSA, Madison, WI USA; 2001. pp 111–136.
17. Odhiambo JA, Vanlauwe B, Tabu IM, Kanampiu F, Khan Z. Effect of intercropping maize and soybeans
18. Jaetzold R, Schmidt H, Hornetz B, Shisanya C. Farm management handbook of Kenya. Revised edi-tion. Vol. 2. Natural conditios and farm management informaedi-tion. Ministry of Agriculture/The German Agency for Technical Cooperation, Nairobi; 2005.
19. Mugalavai EM, Emmanuel C, Kipkorir EC, Raes D, Rao MS. Analysis of rainfall onset, cessation and length of growing season for western Kenya. Agric Forest Meteorol. 2008; 148:1123–1135.
20. Dixit PN, Cooper PJM, Dimes J, Rao KP. Adding value to field-based agronomic research through cli-mate risk assessment: a case study of maize production in Kitale, Kenya Exp Agric. 2011; 47:317–
338.
21. Islam MR, (Yani) Garcia SC, Henry D. Use of normalized difference vegetation index, nitrogen concen-tration, and total nitrogen content of whole maize plant and plant fractions to estimate yield and nutritive value of hybrid forage maize. Crop Pasture Sci. 2011; 62:374–382.
22. Magurran AE. Ecological diversity and its measurement. Princeton University Press, Princeton, NJ, 128 p; 1988.
23. Mokhtarpour H, Teh CBS, Saleh G, Selamat AB, Asadi ME, Kamar B. Non-destructive estimation of maize leaf area, fresh weight, and dry weight using leaf length and leaf width. Commun Biometry Crop Sci. 2010; 5:19–26.
24. Aikins SHM, Afuakwa JJ, Owusu-Akuoko O. Effect of four different tillage practices on maize perfor-mance under rainfed conditions. Agric Biol J North Am. 2012; 3:25–30.
25. Jordan-Meille L, Pellerin S. Leaf area establishment of a maize (Zea MaysL.) field crop under potas-sium deficiency. Plant Soil. 2004; 265:75–92.
26. R Core Team 2.15.3. R: A language and environment for statistical computing. R Foundation for Statis-tical Computing, Vienna, Austria. 2013; ISBN 3-900051-07-0.
27. Andersson JA, D’Souza S. From adoption claims to understanding farmers and contexts: A literature review of conservation agriculture (CA) adoption among smallholder farmers in southern Africa. Agric Ecosyst Environ. 2014; 187:116–132.
28. Wrucke MA, Arnold WE. Weed species distribution as influenced by tillage and herbicides. Weed Sci. 1985; 33:853–856.
29. Chauhan BS, Migo T, Westerman PR, Johnson DE. Post-dispersal predation of weed seeds in rice fields. Weed Res. 2010; 50:553–560.
30. Mandumbu R, Twomlow SJ, Jowah P, Mashingaidze N, Hove L, Karavina C. Weed seed bank response to tillage and residue management in semi-arid Zimbabwe. Archives Phytopathol. Plant Pro-tec. 2012; 45:2165–2176.
31. Gopal R, Jat RK, Malik RK, Kumar V, Alam MM, Jat ML, Mazid MA et al. Direct dry seeded rice produc-tion technology and weed management in rice based systems. Technical Bulletin: Internaproduc-tional Maize and Wheat Improvement Center, New Delhi, India, 28 p; 2010.
32. Nyamangara J, Mashingaidze N, Masvaya EN, Nyengerai K, Kunzekweguta M, Tirivavi R et al. Weed growth and labor demand under hand-hoe based reduced tillage in smallholder farmers’fields in Zimba-bwe. Agric Ecosyst Environ. 2014; 187:146–154.
33. Riemens MM, Groeneveld RMW, Lotz LAP, Kropff MJ. Effects of three management strategies on the seedbank, emergence and the need for hand weeding in an organic arable cropping system. Weed Res. 2007; 47:442–451.
34. Ngwira AR, Thierfelder C, Lambert DM. Conservation agriculture systems for Malawian smallholder farmers: long-term effects on crop productivity, profitability and soil quality. Renew Agric Food Syst. 2013; 28:350–363.
35. Ikuenobe CE, Anoliefo GO. Influence ofChromolaena odorataandMucuna pruriensfallow duration on weed infestation. Weed Res. 2003; 43:199–207.
36. Baudron F, Andersson JA, Corbeels M, Giller KE. Failing to yield? Ploughs, conservation agriculture and the problem of agricultural intensification: an example from the Zambezi Valley, Zimbabwe. J Develop Studies. 2012; 38:393–412.