ROUGHNESS OF AN OXISOL UNDER SIMULATED RAIN
Elói Panachuki(1)*, Ildegardis Bertol(2), Teodorico Alves Sobrinho(3), Paulo Tarso Sanches de Oliveira(4) and Dulce Buchala Bicca Rodrigues(4)
(1) Universidade Estadual de Mato Grosso do Sul, Aquidauana, Mato Grosso do Sul, Brasil.
(2) Universidade do Estado de Santa Catarina, Centro de Ciências Agroveterinárias, Departamento de Solos, Lages, Santa Catarina, Brasil.
(3) Universidade Federal de Mato Grosso do Sul, Centro de Ciências Exatas e da Terra, Campo Grande, Mato Grosso do Sul, Brasil. (4) Universidade de São Paulo, Escola de Engenharia de São Carlos, Departamento de Hidráulica e Saneamento, São Carlos, São
Paulo, Brasil. * Corresponding author.
E-mail: [email protected]
ABSTRACT
Surface roughness of the soil is formed by mechanical tillage and is also influenced by the kind and amount of plant residue, among other factors. Its persistence over time mainly depends on the fundamental characteristics of rain and soil type. However, few studies have been developed to evaluate these factors in Latossolos (Oxisols). In this study, we evaluated the effect of soil tillage and of amounts of plant residue on surface roughness of an Oxisol under simulated rain. Treatments consisted of the combination of the tillage systems of no-tillage (NT), conventional tillage (CT), and minimum tillage (MT) with rates of plant residue of 0, 1, and 2 Mg ha-1 of oats (Avena strigosa Schreb) and 0, 3, and 6 Mg ha-1 of maize (Zea mays L.).
Seven simulated rains were applied on each experimental plot, with intensity of 60±2 mm h-1
and duration of 1 h at weekly intervals. The values of the random roughness index ranged from 2.94 to 17.71 mm in oats, and from 5.91 to 20.37 mm in maize, showing that CT and MT are effective in increasing soil surface roughness. It was seen that soil tillage operations carried out with the chisel plow and the leveling disk harrow are more effective in increasing soil roughness than those carried out with the heavy disk harrow and leveling disk harrow. The roughness index of the soil surface decreases exponentially with the increase in the rainfall volume applied under conditions of no tillage without soil cover, conventional tillage, and minimum tillage. The oat and maize crop residue present on the soil surface is effective in maintaining the roughness of the soil surface under no-tillage.
INTRODUCTION
Diverse processes that occur at the soil-atmosphere interface, such as infiltration of water in the soil, surface runoff, soil disaggregation, gas exchanges, evaporation, heat flux (Huang and Bradford, 1992), and depressional storage of soil water (Onstad, 1984), are influenced by soil surface roughness. According to Dalla Rosa et al. (2012), the most common manner of expressing roughness is through the use of indices that represent the conformation of the soil surface. Among the different indices, the most used is the random roughness index (RR), which represents the chance distribution of the peaks and valleys resulting from clods of soil and organization of the aggregates (Zheng et al., 2013). The RR is calculated by the standard deviation of the heights of the microrelief after removal of the effect of the markings of soil tillage and the slope of the land (Allmaras et al., 1966).
Soil surface conditions are changed mainly as a result of tillage operations, of the impact of raindrops, and of the shear force of surface runoff (Eltz and Norton, 1997; Roisin, 2007; García Moreno et al., 2008; Panachuki et al., 2010). According to Linden and Van Doren (1986), farm implements change the configuration of the soil surface and lead to rupture, lifting, and resettling of soil aggregates during tillage operations. The intensity of these changes in the microrelief is affected by the types
of implements, number of operations, and soil moisture conditions (Allmaras et al., 1967). The stability of surface roughness is dependent on the soil cover provided by plant residue (Bertol et al., 1997). However, in Brazil there are few studies that evaluate the minimum amounts of plant residue necessary to reduce the effects of rain on soil surface roughness, especially for Cerrado conditions.
The Brazilian Cerrado is a biome characterized by the savanna, covering two million km2 (22 % of Brazilian territory), located in the central region of the country (Klink and Machado, 2005). It is responsible for more than half of Brazilian crop and livestock production. In this region, with the predominance of Oxisols, the mean annual temperature ranges from 22 to 27 °C, and the maximum annual temperature exceeds 40 °C. Mean annual rainfall is up to 2,000 mm, with scarce rains in the winter. Solar radiation is from 475 to 500 cal cm-1 d-1 (Adámoli et al., 1987). As a consequence of the long periods of water deficit seen in the winter, there is low plant biomass production in this period and, in the summer, climate conditions favor a high plant residue decomposition rate. These climate conditions, associated either with intensive soil tillage or with no-tillage without crop rotation, impede the maintenance of adequate plant cover on the soil. As a result, in part of the area cropped under no-tillage, the soil is frequently subjected to the mechanical operation of chisel plowing, Keywords: soil cover, soil surface microrelief, soil conservation systems.
RESUMO: EFEITO DO PREPARO DO SOLO E DE RESÍDUOS VEGETAIS SOBRE A
RUGOSIDADE DA SUPERFÍCIE DE UM LATOSSOLO, SOB CHUVA SIMULADA
A rugosidade superficial do solo é formada pelo preparo mecânico, sendo influenciada também pelo tipo e pela quantidade de resíduo vegetal, entre outros fatores, enquanto sua persistência temporal depende principalmente de características fundamentais da chuva e do tipo de solo. No entanto, poucos
estudos têm sido desenvolvidos no sentido de avaliar esses fatores em Latossolos. Neste estudo, foi
avaliado o efeito do preparo do solo e de doses de resíduos vegetais sobre a rugosidade da superfície
de um Latossolo, sob chuva simulada. Os tratamentos consistiram da combinação dos sistemas
semeadura direta (SD), preparo convencional (PC) e preparo mínimo (PM) com doses de resíduos vegetais
correspondentes a 0; 1; e 2 Mg ha-1 de aveia (Avena strigosa Schreb) e 0; 3; e 6 Mg ha-1 de milho (Zea
mays L.). Em cada parcela experimental, foram aplicadas sete chuvas, com intensidade de 60±2 mm h-1
e duração de 1 h, em intervalos semanais. Os valores do índice de rugosidade ao acaso variaram de 2,94 a 17,71 mm na aveia e de 5,91 a 20,37 mm no milho, demonstrando que o PC e PM são eficientes em aumentar a rugosidade da superfície do solo. Verificou-se que as operações de preparo do solo realizadas com o escarificador e a grade niveladora são mais eficientes no aumento da rugosidade do solo do que aquelas realizadas com grade aradora e grade niveladora. O índice de rugosidade da superfície do solo diminui exponencialmente com o aumento do volume de chuvas aplicadas, em condições de semeadura direta sem cobertura do solo, preparo convencional e preparo mínimo. Os resíduos culturais de aveia e milho presentes na superfície do solo são eficientes em manter a estabilidade da rugosidade da superfície do solo submetido a semeadura direta.
followed by a leveling disk harrow, for the purpose of breaking up the compacted soil layers, which increases soil surface roughness. These compacted layers in the no-tillage areas generally are a result of machine and farm implement traffic under wet soil conditions, and from management of the system without crop rotation. The use of crop rotation could provide the soil with physical conditions more favorable to sustainable farm production, with a greater contribution of plant biomass to the soil.
Thus, we see the great difficulty of maintaining plant biomass on the soil surface in the Cerrado biome. In the case of no-tillage, this absence of plant biomass contributes to reduction in soil surface roughness and the consequent increase in water erosion, due to the occurrence of intense concentrated rains, especially at the beginning of summer cropping.
Therefore, the aim of this study was to evaluate the effect of soil tillage and of rates of oat and maize plant residue on surface roughness of a Latossolo Vermelho aluminoférrico típico (Oxisol) under simulated rain.
MATERIAL AND METHODS
Area of study
The study was carried out in a Cerrado Biome region (latitude 22°14’ S and longitude 54º 49’ W). Soil in the area is classified as a Latossolo Vermelho aluminoférrico típico (Oxisol) with a very clayey texture and the following particle size distribution: 200, 94, and 706 g kg-1 of sand, silt, and clay, respectively, for the depth of 0-0.2 m. The location where the plots were set up, with mean slope of 0.03 m m-1, had been cropped for eight years under no-tillage or conventional tillage in a soybean-maize succession. The climate in the region, according to the Köppen international system, is classified as Tropical Wet and Dry or Savanna (Aw), with a dry winter and mean annual rainfall of 1,400 mm a year.
Soil cover and physical properties
In each experimental unit, at the time after distribution of crop residue, soil cover was evaluated by the photographic method described by Mannering (Lopes, 1984). Pictures were taken at 1.0 m from the soil surface with a digital camera placed perpendicular to the soil surface. A grid with 50 intersections was used, over which the pictures were projected for counting the intersections of the grid points that coincided with the presence of pieces of plant residue detected by the pictures.
For physical soil analysis, samples were taken in soil sample rings of 50 mm height and 50
mm diameter, centered at the depths of 0.025, 0.075, and 0.150 m, for evaluation of bulk density and macroporosity of the soil, according to Embrapa (1997). For evaluation of wet aggregate stability, soil monoliths with natural structure were collected. These monoliths, after air drying, were passed through a sieve with a 9.52 mm mesh, and aggregates retained in the 4.76 mm sieve were used in later analyses. These aggregates were then subjected to sieving for 10 min in a set of sieves with meshes of 2.0, 1.0, 0.5, 0.25, and 0.105 mm, within a container immersed in water. Mean geometric diameter (MGD) was adopted as an aggregate stability index, and calculations were made following the proposal of Kemper and Rosenau (1986).
Description of the experimental unit, treatments, and simulated rainfall applied
The experimental unit was delimited by a rectangular device made of a galvanized sheet (1.0 m length, 0.7 m width, and 0.2 m height) driven into the soil, with the length in the direction of the slope.
To carry out this study, oats (Avena strigosa Schreb) and maize (Zea mays L.) were grown under no tillage (NT), conventional tillage (CT), and minimum tillage (MT) systems. In the area under no-tillage, light scarification of the soil was observed only in the plant row as a result of the action of the furrowing shanks of the planter. Conventional tillage was characterized by heavy disk harrowing with mechanical action up to a 0.15 m depth, and two leveling disk harrowings to a 0.05 m depth. Minimum tillage, carried out in an area under no-tillage, was characterized by mechanical chiseling, with the shanks reaching a mean depth of 0.2 m, and one leveling disk harrowing to a 0.05 m depth. Over these management systems, three rates of crop residue were tested, which corresponded to the condition without soil cover, to half of the maximum amount produced, and to the maximum amount produced, for each crop.
In the oat crop, the treatments were: oats under no-tillage without residue (ONT0), oats under no tillage with 1.0 Mg ha-1 of residue (ONT1), oats under no tillage with 2.0 Mg ha-1 of residue (ONT2), oats under conventional tillage without crop residue (OCT0), oats under conventional tillage with 1.0 Mg ha-1 of residue (OCT1), oats under conventional tillage with 2.0 Mg ha-1 of residue (OCT2), oats under minimum tillage without residue (OMT0), oats under minimum tillage with 1.0 Mg ha-1 of
of residue (MCT3), maize under conventional tillage with 6.0 Mg ha-1 of residue (MCT6), maize under minimum tillage without residue (MMT0), maize under minimum tillage with 3.0 Mg ha-1 of residue (MMT3), and maize under minimum tillage with 6.0 Mg ha-1 of residue (MMT6).
In each treatment, seven simulated rains were applied at 1-week intervals between each evaluation. The rains were applied with constant intensity of 60±2 mm h-1 over the duration of 60 min using a rain simulator as described by Alves Sobrinho et al. (2008).
Obtaining the soil surface roughness index Evaluations of soil surface roughness were made at nine points in time, the first before tillage operations, the second after these operations and the others after application of each one of the simulated rains. Values for height of soil microrelief were determined by a mechanical surface roughness gauge with rods, assisted by a photographic camera, as described by Zoldan Junior et al. (2008). The gauge contained 20 aligned aluminum rods at a 33 mm distance from each other, allowing 400 height readings to be obtained in each experimental unit since 20 photos were taken in a useful area of 0.36 m2.
The roughness index used to represent the soil microrelief was random roughness (RR), calculated according to Kamphorst et al. (2000), considering the standard deviation of the 400 readings of the heights of the soil surface.
Experimental design and statistical data analysis
Nine treatments were studied with two replications, resulting in 18 experimental units for each crop. The treatments were arranged in a split-split-plot arrangement, where the time of application of the simulated rains was considered as the plot, the type of soil tillage corresponded to the split plot, and the rate of crop residue corresponded to the split-split plot, according to a completely randomized design.
To evaluate the effect of the treatments and obtain an estimate of residual variance, analysis of variance of the data was carried out, with subsequent application of the Tukey test at 5 % probability for comparison of means. The exponential regression model was fit to the data in question for the purpose of verifying the relations between the RR index and the accumulated volume of rain.
RESULTS AND DISCUSSION
Soil cover and physical properties
The increase in the amount of crop residue on the soil increased the surface cover, especially in
the treatment under no-tillage, in which it reached maximum values in the case of maize (Table 1).
In the case of oat residue, in the treatment under no-tillage (NT), the rate of 1.0 Mg ha-1 provided
soil coverage 9.1 and 3.8 times greater than that in conventional tillage (CT) and minimum tillage (MT), respectively, while at the rate of 2.0 Mg ha-1, it was 6.5 and 3 times greater considering the same treatments. In the case of maize residue, the rate of 3.0 Mg ha-1 provided 5 and 3.8 times greater soil coverage as compared to CT and MT, respectively, while at the rate of 6.0 Mg ha-1, this difference was
2.7 and 2.4 times greater.
In NT, bulk density was generally greater than in the other types of soil tillage, especially in the evaluation made at the time after performing soil tillage operations in the CT and MT (Table 2). This is explained by the effect of the active parts of the farm implements that turn over the soil and thus contribute to soil decompaction (Mazurana et al., 2011).
After application of simulated rains, there was a tendency toward an increase in bulk density in the CT and MT treatments, in agreement with the results observed by Bertol et al. (2006). This occurs because the recently tilled soil undergoes a process of reconsolidation over time, which is accelerated by the phenomenon of soil wetting and drying. In addition, the force of the rain in itself is a notable factor for compaction of the soil surface, as shown in the classic studies of Duley (1939) and Tackett and Pearson (1965). The soil mobilization carried out in these treatments intensifies, by mechanical action, the rupture of the aggregates which, with the impact of the raindrops, favors the formation of surface sealing (Abid and Lal, 2009), which represents an increase in density in the first millimeters of the soil surface (Ries and Hirt, 2008).
The values of rainfall intensities effectively applied did not undergo significant variation among
Table 1. Values of soil cover in the treatments under diverse rates of oat and maize residue
Soil tillage Oat residue Maize residue
Rate Cover Rate Cover
Mg ha-1 % Mg ha-1 %
No-tillage 0 0 0 0
1 73 3 100
2 84 6 100
Conventional tillage 0 0 0 0
1 8 3 20
2 13 6 37
Minimum tillage 0 0 0 0
1 19 3 26
the treatments, nor among the rainfall events applied in the same treatment. The rainfall intensity was 60±2 mm h-1, which provided a value for kinetic energy of the rain of 1.452±0.08 kJ m-2.
The values of MGD were greater in no tillage at all later evaluation times compared to soil tillage operations, indicating better conditions of aggregate stability in the no-tillage system compared to the other treatments (Table 3). Aggregate stability in no-tillage is related to the prolonged presence of organic matter, which acts as a cementing agent of primary particles of the soil and which, in the lack of soil turnover by tillage operations, has a reduced rate of decomposition. Mechanical action resulting from growth and the other physiological activities of the roots, microorganisms, and fauna of the soil lead to clustering of the microaggregates, resulting in the formation of stable macroaggregates, as shown by Tisdall and Oades (1982).
In CT and MT, a reduction was observed in the MGD at the time after soil tillage operations, which may be attributed to the disaggregation brought about by the farm implements (Table 3). Nevertheless, at later times (1st to 7th rains) there was structural reorganization of the soil mass, resulting in an increase in MGD. This fact may
be related to the recent implementation of the conventional tillage and minimum tillage systems in the experimental area because, according to Renard et al. (1997) and D’andréa et al. (2002), in the first years of implementation of these soil tillage systems, there is the residual effect of soil aggregation due to the activity of the crop roots under no-tillage. In spite of the observed differences, it may be seen that for all the conditions evaluated, the values of MGD may be attributed to the good state of soil aggregation. On average, they were near or greater than the values registered by Panachuki et al. (2006) and by Salton et al. (2008) for soils similar to those of this study in areas cropped under the same soil management systems.
In the treatments subjected to soil turnover, especially under the condition without soil cover, a more expressive reduction may be seen in the microrelief after application of simulated rains. In the treatments subjected to no-tillage with soil cover, less influence of the rain on the surface microrelief was seen, with soil roughness practically unchanged up to the end of the rains.
At the levels of 3.0 and 6.0 Mg ha-1 of plant residue in the maize crop under no-tillage, there was total coverage of the soil surface, not allowing direct Table 2. Values of bulk density in the treatments under diverse rates of oat and maize residue in the
0-0.05 m soil layer
Treatment Rate of residue Time of evaluation
After soil tillage Rain 1 Rain 3 Rain 5 Rain 7
Mg ha-1 kg dm-3
Oats
No-tillage 0.0 1.41 a 1.37 a 1.29 a 1.37 a 1.31 a
1.0 1.30 a 1.29 a 1.23 ab 1.19 b 1.24 ab
2.0 1.29 a 1.33 a 1.24 ab 1.23 b 1.13 bc
Conventional tillage 0.0 1.02 b 1.08 b 1.12 bc 1.10 c 1.11 c
1.0 1.03 b 1.09 b 1.19 ab 1.11 c 1.15 bc
2.0 1.05 b 1.08 b 1.06 c 1.12 c 1.10 c
Minimum tillage 0.0 1.09 b 1.17 b 1.09 bc 1.11 c 1.14 bc
1.0 1.10 b 1.16 b 1.21 ab 1.13 bc 1.12 b
2.0 1.12 b 1.16 b 1.07 c 1.14 bc 1.20 ab
Maize
No-tillage 0.0 1.33 a 1.27 a 1.25 b 1.33 a 1.30 ab
3.0 1.44 a 1.35 a 1.42 a 1.38 a 1.43 a
6.0 1.39 a 1.33 a 1.32 a 1.37 a 1.42 a
Conventional tillage 0.0 1.07 b 1.08 b 1.12 c 1.09 b 1.15 c
3.0 1.05 b 1.09 b 1.11 c 1.07 b 1.14 c
6.0 1.03 b 1.06 b 1.07 c 1.12 b 1.23 bc
Minimum tillage 0.0 1.04 b 1.14 b 1.07 c 1.09 b 1.21 bc
3.0 0.98 b 1.10 b 1.09 c 1.07 b 1.16 c
6.0 1.06 b 1.19 b 1.14 bc 1.09 b 1.15 c
exposure of the soil to the impact of the raindrops. In the treatments corresponding to conventional tillage and minimum tillage without soil cover, at the time prior to application of the simulated rains, it may be observed that the value of soil surface roughness was similar to the values obtained by Eltz (1993) and those referenced by Renard et al. (1997) for the Revised Universal Soil Loss Equation.
Effect of soil preparation on surface random roughness (RR)
The RR index ranged from 2.94 to 5.1 mm in the oat crop and from 4.15 to 11.31 mm in the maize crop at the time prior to soil tillage (Table 4). The values were greater in the area planted to maize in the treatments with soil cover due to the characteristics of the plant residue of this species, which makes for greater height differences in soil microrelief.
In the treatments under NT, soil tillage operations were not carried out and, for that reason, the roughness value remained unchanged up to the time of application of simulated rains. In these treatments, the values of the RR index were greater in the condition with maize residue because
the dimensions of this type of material and the amounts of dry matter produced, both with half the amount and with the maximum amount produced, were greater than those of oat, whereas Amaral et al. (2013) observed less roughness in the maize crop. The use of the heavy disk harrow and leveling disk harrow in the CT system, and of the chisel plow and leveling disk harrow in the MT system were important in raising soil surface roughness, just as verified by Guzha (2004) and Panachuki et al. (2010). The values of the RR index after soil tillage operations ranged from 3.14 to 17.71 mm in the oat crop, and from 5.91 to 20.37 mm in the maize crop. In the MT system, higher values were observed for the RR index than in the CT system because the repeated action of the leveling disk harrow in the CT system led to greater fragmentation of the soil clods and, thus, greater smoothness on the soil surface.
In the area with the oat crop under CT, soil tillage increased the RR index from an average of 4.05 to 8.01 mm, while in the maize crop it increased from 6.74 to 11.00 mm. In the treatments under MT, soil tillage operations increased the roughness values from 3.73 to 16.22 mm, in the case of the oat crop, while in the maize crop, the increase was from 7.54 Table 3. Values of mean geometric diameter of the aggregates in the treatments under diverse rates of
oat and maize residue in the 0-0.05 m soil layer
Treatment Rate of residue Time of evaluation
After soil tillage Rain 1 Rain 3 Rain 5 Rain 7
Mg ha-1 mm
Oats
No-tillage 0.0 4.64 a 4.31 a 3.57 bc 3.86 b 3.86 b
1.0 4.28 ab 4.40 a 4.31 a 4.74 a 4.74 a
2.0 4.53 a 4.23 a 4.06 ab 3.89 bcd 3.89 bcd
Conventional tillage 0.0 2.81 de 3.07 cd 3.28 cd 3.67 bcd 3.67 bcd
1.0 2.54 e 2.69 d 2.96 d 3.36 d 3.36 d
2.0 3.57 c 3.60 bc 3.46 bcd 3.37 d 3.37 d
Minimum tillage 0.0 3.71 bc 3.84 ab 3.94 ab 3.60 c 3.60 c
1.0 3.83 bc 3.94 ab 3.90 ab 4.27 ab 4.27 ab
2.0 3.36 cd 3.97 ab 4.20 a 4.10 bc 4.10 bc
Maize
No-tillage 0.0 4.62 a 4.26 a 4.02 ab 4.21 a 4.13 a
3.0 4.53 a 4.63 a 3.97 abc 4.21 ab 4.02 a
6.0 4.62 a 4.57 a 4.19 a 4.07 ab 4.07 a
Conventional tillage 0.0 3.01 bc 3.25 b 3.58 bc 3.73 ab 3.87 a
3.0 2.85 c 3.19 b 3.40 c 3.38 b 3.93 a
6.0 2.81 c 3.00 b 3.73 abc 3.94 a 3.85 a
Minimum tillage 0.0 3.51 b 3.22 b 3.65 abc 3.72 a 4.02 a
3.0 3.60 b 3.59 b 3.57 bc 3.38 b 3.75 a
6.0 3.22 bc 3.26 b 3.48 bc 3.43 b 3.49 a
to 19.46 mm, considering the mean of the treatments. Thus, it was seen that soil tillage increased surface roughness by 76 % in CT and 217 % in MT, in the mean of the oat and maize treatments. The greater roughness created in the MT system is due to the effect of the chisel plow shanks, which provided a roughness index that on average doubled the mean value of the CT for the same crop.
In the CT system, it was seen that in the OCT0 and MCT0 treatments, the soil tillage operations led to greater variation of soil roughness than the treatments with plant residue on the soil surface. This is due to the fact of the plant residue contributing more effectively to greater roughness in relation to the treatments without soil cover, especially in the case of the maize crop. In the OCT2, MCT3, and MCT6 treatments, there was less effect of the disking operations on the increase in soil roughness, and that may be explained by the presence of the plant residue, which lead to greater initial roughness, especially in the case of maize. Nevertheless, it should be observed that in all the treatments under CT, after soil tillage, the surface roughness values were not statistically different (Table 4). This is related to the fact of the soil preparation operations, in the case of the CT system, providing for incorporation of most of the plant residue, thus reducing its effect on the microrelief.
In minimum tillage, the action of the chisel plow and the leveling disk harrow was effective in altering soil roughness in all the treatments, with increases that ranged from 282 to 395 % in the case of oats, and from 60 to 559 % in the case of maize. In the MMT3 and MMT6 treatments, soil tillage made for smaller amplitudes of variation in the value of soil surface roughness because the amount of plant residue present on the surface before the tillage operations was enough to lead to higher values for soil roughness. Thus, in these treatments, there was a smaller effect of the tillage operations on the
increase in the roughness index, as also seen in the CT. According to Zhao et al. (2013), the increase in soil surface roughness has a direct effect on the increase in water infiltration in the soil because it creates irregularities on its surface that may store water.
Effect of rain on surface roughness
Analyzing the effect of rains on soil surface roughness, it may be considered that the intensity of the changes in soil microrelief decline with the increase in the amount of rain applied on the plots. In general, evaluating the mean values of the treatments in which there was reduction of random roughness, it may be observed that the first rain reduced the value of the RR index by 7.7, 11.8, and 13.4 % for no tillage, conventional tillage, and minimum tillage, respectively. The smaller variation in soil roughness that occurred in the treatments under NT is related, among other factors, to the greater stability of the soil aggregates in this management system (Table 3) and to the protective effect exercised by plant cover, which avoided the effect of direct impact of the raindrops on the soil. After the application of simulated rains, soil surface roughness decreased in all the treatments without soil cover and/or those subjected to soil tillage operations (Figures 1 and 2).
In the experimental plots with oat and maize crops, the rains applied significantly reduced soil surface roughness, with the exception of the ONT1, MNT3, and MNT6 treatments, where it was seen that the random roughness index remained constant throughout the period in which the seven simulated rains were applied. This stability of the soil microrelief, in the treatments under NT, is related to the favorable condition of aggregation of this management system (Table 3) and to the presence of plant residue on the soil surface, which acts to dissipate the kinetic energy of the rain, especially in the case of maize, providing for total soil cover.
Table 4. Random roughness index in the treatments under diverse rates of oat and maize residue
Treatment Before soil tillage After soil tillage Treatment Before soil tillage After soil tillage
mm mm
ONT0 3.14 Aa 3.14 Ac MNT0 5.91 Ab 5.91 Ac
ONT1 3.68 Aa 3.68 Ac MNT3 7.55 Aab 7.55 Abc
ONT2 4.55 Aa 4.55 Ac MNT6 9.63 Aa 9.63 Ab
OCT0 2.94 Ba 8.83 Ab MCT0 4.75 Bb 11.55 Ab
OCT1 4.10 Ba 8.00 Ab MCT3 7.33 Aab 10.09 Ab
OCT2 5.10 Aa 7.21 Ab MCT6 9.36 Aa 11.36 Ab
OMT0 3.46 Ba 15.08 Aa MMT0 4.15 Bb 20.37 Aa
OMT1 3.58 Ba 17.71 Aa MMT3 8.23 Ba 19.91 Aa
OMT2 4.16 Ba 15.89 Aa MMT6 11.31 Ba 18.12 Aa
In the oat crop, it was seen that the relation between random roughness after the application of the seventh rain and the random roughness after soil tillage was 0.80, 0.49, and 0.62 for no-tillage, conventional no-tillage, and minimum no-tillage, respectively. In the maize crop, these same relations
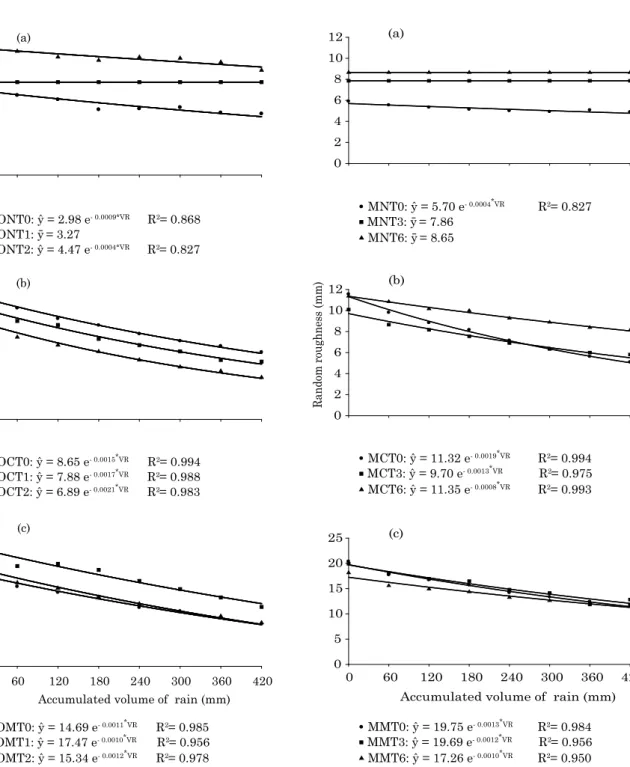
were 0.91, 0.58, and 0.62. These relations show that no tillage is the most effective system in maintaining soil roughness, especially under conditions of greater percentage of soil cover (Table 1). Guzha (2004), after applying the same amount of rain as in this study, found relations of 0.78 in no tillage, Figure 1. Random roughness of the soil surface
(RR) as a function of the accumulated volume of rain (VR) under different rates of oat residue: (a) no tillage; (b) conventional tillage; and (c) minimum tillage. * significant at 5 % by the t test.
0 1 2 3 4
5 (a)
0 1 2 3 4 5 6 7 8 9 10
OCT0: ŷ = 8.65 e- 0.0015*VR R2= 0.994 OCT1: ŷ = 7.88 e- 0.0017*VR R2 = 0.988 OCT2: ŷ = 6.89 e- 0.0021*VR R2= 0.983
(b)
Random roughness (mm)
0 60 120 180 240 300 360 420
6 8 10 12 14 16 18 20
OMT0: ŷ = 14.69 e- 0.0011*VR R2 = 0.985
OMT1: ŷ = 17.47 e- 0.0010*VR R2= 0.956
OMT2: ŷ = 15.34 e- 0.0012*VR R2= 0.978
ONT0: ŷ = 2.98 e- 0.0009*VR R2= 0.868
ONT1: yˉ = 3.27 ONT2: ŷ = 4.47 e- 0.0004*VR R2= 0.827
(c)
Accumulated volume of rain (mm)
Figure 2. Random roughness of the soil surface (RR) as a function of the accumulated volume of rain (VR) under different rates of maize residue: (a) no tillage; (b) conventional tillage; and (c) minimum tillage. * significant at 5 % by the t test.
0 2 4 6 8 10
12 (a)
0 2 4 6 8 10 12
Random roughness (mm)
(b)
0 60 120 180 240 300 360 420
0 5 10 15 20 25
Accumulated volume of rain (mm) (c)
MMT0: ŷ = 19.75 e- 0.0013*VR R2 = 0.984 MMT3: ŷ = 19.69 e- 0.0012*VR R2= 0.956 MMT6: ŷ = 17.26 e- 0.0010*VR R2= 0.950 MCT0: ŷ = 11.32 e- 0.0019*VR R2 = 0.994 MCT3: ŷ = 9.70 e- 0.0013*VR R2= 0.975 MCT6: ŷ = 11.35 e- 0.0008*VR R2= 0.993 MNT0: ŷ = 5.70 e- 0.0004*VR R2 = 0.827 MNT3: yˉ = 7.86
0.34 in conventional tillage, and 0.57 in minimum tillage, whereas Panachuki et al. (2010), under the soybean crop, obtained values of 0.70, 0.65, and 0.60 for relations of these variables in the same soil management systems.
In the oat and maize crop, the application of 420 mm of rain in the plots under conventional tillage reduced soil roughness to values similar to those observed in the conditions before soil tillage. According to Dalla Rosa et al. (2013), the application of rain on turned-over soil without cover causes degradation of the surface structure, which, afterwards, is reorganized and oriented at the surface. This is related to the low stability of the soil aggregates cultivated under this system, which is caused by the reduction in biological quality of the soil (Aziz et al., 2013) and by the effect of the increased number of diskings, which lead to break up of the surface layer of the soil.
In the minimum tillage system, the value of the roughness indices after the application of rains was less than the values observed after soil preparation, although in most treatments they remained greater than the values that the soil surface exhibited before soil tillage. In the MMT6 treatment, the presence of a large amount of plant residue on the soil, which led to 41 % of soil cover after tillage operations, was important in maintaining high roughness even after the application of simulated rains.
The exponential model obtained a good fit to the soil surface roughness values, which were altered by the energy transferred from the impact of raindrops, with high coefficients of determination (Figures 1 and 2), just as observed by Bertol et al. (2006), Panachuki et al. (2010), and Correa et al. (2012), who explained this fact by the greater effect of the first rains on soil roughness, considering the time after soil tillage. In the oat crop under no-tillage (Figure 1a), in the absence of soil cover, the decay coefficient was greater than with plant residue cover, and at the level of 1.0 Mg ha-1, soil roughness was not altered by rain activity. Nevertheless, it should be observed that in the absence of plant residue, the soil roughness value at the time before the application of simulated rain was already low and corresponded to 85 and 69 % of the values observed in the ONT1 and ONT2 treatments, respectively. In the treatments with the presence of oat residue, the reduction in random roughness was also small; however, in this case, through the effect of plant matter on the soil surface. At the level of 1.0 Mg ha-1, the exponential model did not fit the data set because, as of the first rain, the random roughness was already practically stabilized and, for that reason, the variations in its values were insignificant.
In the oat crop under conventional tillage (Figure 1b), it may be seen that the three amounts of residue exhibited the same tendency of variation of random roughness. The decay coefficients provided
reductions of 0.01121, 0.01137, and 0.01186 mm of random roughness per mm of rain applied in the OCT0, OCT1, and OCT2 treatments, respectively. In this case, it may be considered that the oat residue, after the sequence of plowing and diskings, did not affect the alterations in soil roughness. This fact may be associated with the low percentage of soil cover provided by this residue after soil tillage operations.
In the maize treatments under no-tillage with the presence of plant residue, the application of simulated rains did not have an effect on change in soil roughness (Figure 2a). In the treatment without plant residue (MNT0), there was a reduction of 17 %, whereas in the oat crop, the treatment without residue (ONT0) underwent a reduction of 31 %. In the MNT3 treatment, the value of the roughness index was not altered by rain activity, while in the MNT6, it was not very significant and only after the application of the first rain test. This may have occurred due to possible accommodation of the plant matter on the soil surface since this quantity formed a dense layer on the soil surface.
The relations that appear in Figure 2b in reference to the maize crop under conventional tillage show that the condition without soil cover was the most sensitive in regard to rain activity, while the condition of greater cover was more effective in maintaining random roughness. According to Bertol et al. (2007), the increase in the amount of maize residue semi-incorporated in the soil by the tillage operations reduces the effect of the rains on reduction of random roughness of the soil. The values of the decay coefficient were 0.0019, 0.0013, and 0.0008, which resulted in reductions of 0.01792, 0.01110, and 0.00858 mm of random roughness for each mm of rain in the MCT0, MCT3, and MCT6 treatments, respectively. Thus, after the application of 420 mm of rain, soil roughness, for these three treatments, decreased by 6.2, 4.1, and 3.3 mm, respectively.
Analyzing the fitted equations (Figure 2c), it may be seen that there were no differences among random roughness decays for the amounts of maize residue under minimum tillage. This is due to the fact of the chiseling and leveling disk harrowing operations bringing about partial incorporation of the plant residue and the amounts exposed at the soil surface not being sufficient to have an effect on reduction of soil surface roughness.
that roughness was higher in minimum tillage at the end of the rain tests regardless of the amount of cover. In minimum tillage, the decay coefficients of random surface roughness were similar among the oat and maize crops at the three amounts of soil cover, indicating greater influence of the soil tillage system than the type and amount of plant matter.
CONCLUSIONS
T h e s o i l t i l l a g e o p e r a t i o n s u s i n g t h e combinations of heavy disk harrow-leveling disk harrow, and chisel plow-leveling disk harrow increase the soil surface roughness in relation to the absence of tillage.
Soil tillage with a chisel plow and leveling disk harrow is more effective in increasing soil roughness than tillage with a heavy disk harrow and leveling disk harrow.
The random roughness index of the soil surface decreases exponentially with the increase in rain volume under no-tillage conditions without crop residue in soil tillage with a heavy disk harrow-leveling disk harrow, and in soil tillage with a chisel plow-leveling disk harrow.
In general, the oat and maize crop residue present on the soil surface under no-tillage conditions increases roughness on the soil surface.
Plant cover associated with a management system that does not break up the soil surface, such as crops under no tillage, favors the temporal stability of roughness on the soil surface even after intense rains.
REFERENCES
Abid M, Lal R. Tillage and drainage impact on soil quality: II. Tensile strength of aggregates, moisture retention and water infiltration. Soil Till Res., 2009;103:364-72.
Adámoli J, Macêdo J, Azevedo LG, Netto JM. Caracterização da região dos Cerrados. In: Goedert WJ, editor. Solos dos Cerrados - Tecnologias e estratégias de manejo. São Paulo: Nobel; 1987. p.33-74. Allmaras RR, Burwell RE, Larson WE, Holt RF. Total porosity and roughness of the interrow zone as influenced by tillage.
Washington: United States Department of Agriculture; 1966. 22p.
Allmaras RR, Burwell RE, Holt RF. Plow-layer porosity and surface roughness from tillage as affected by initial porosity and
soil moisture at tillage time. Soil Sci Soc Am Proc. 1967;31:550-6.
Alves Sobrinho T, Macpherson HG, Gómes JA. A portable integrated rainfall and overland flow simulator. Soil Use Manage.
2008;24:163-70.
Amaral JÁ, Cogo NP, Bertol I, Santos PG, Werner RS. Erosão hídrica e escoamento superficial em função de tipos e doses
de resíduo cultural em dois modos de semeadura direta. R Ci Agrovet. 2013;12:163-74.
Aziz I, Mahmood T, Islam KR. Effect of long-term no-till and conventional tillage practices on soil quality. Soil Till Res.
2013;13:28-35.
Bertol O, Amado TJC, Schlosser JF, Reinert DJ. Desempenho de mecanismos sulcadores de semeadura sob condições de preparo
reduzido do solo. R Bras Ci Solo. 1997;21:257-62.
Bertol I, Amaral AJ, Vidal Vázquez E, Paz González A, Barbosa FT, Brignoni LF. Relações da rugosidade superficial do solo com
o volume de chuva e com a estabilidade de agregados em água. R Bras Ci Solo. 2006;30:543-53.
Bertol I, Paz Gonzáles A, Vidal Vázquez E. Rugosidade superficial
do solo sob diferentes doses de resíduo de milho submetido à chuva simulada. Pesq Agropec Bras. 2007;42:103-10.
Correa IMC, Bertol I, Ramos JC, Takizawa MM. Rugosidade
da superfície de um Cambissolo Húmico relacionada com o
preparo e compactação do solo sob chuva natural. R Bras Ci
Solo. 2012;36:567-76.
Dalla Rosa J, Cooper M, Darboux F, Medeiros JC. Soil roughness evolution in different tillage systems under simulated rainfall
using a semivariogram-based index. Soil Till Res. 2012;124:226-32.
Dalla Rosa J, Cooper M, Darboux F, Medeiros JC. Processo de formação de crostas superficiais em razão de sistemas de preparo
do solo e chuva simulada. R Bras Ci Solo. 2013;37:400-10.
Duley FL. Surface factors affecting the rate of intake of water by
soils. Soil Sci Soc Am Proc. 1939;4:60-4.
D’andréa AF, Silva MLN, Curi N, Ferreira MM. Atributos de
agregação indicadores da qualidade do solo em sistemas de manejo na região dos cerrados no sul do Estado de Goiás. R Bras
Ci Solo. 2002;26:1047-54.
Eltz FLF, Norton LD. Surface roughness changes as affected by rainfall erosivity, tillage, and canopy cover. Soil Sci Soc Am J.
1997;61:1746-55.
Eltz FLF. Surface roughness changes as affected by tillage and rainfall erosivity [tese]. West Lafayette: Purdue University; 1993.
Empresa Brasileira de Pesquisa Agropecuária - Embrapa.
Manual de métodos de análise de solo. Rio de Janeiro: Serviço Nacional de Levantamento e Conservação de solo; 1997. García Moreno R, Díaz Álvarez MC, Tarquis Alonso A, Barrington S, Saa Requejo A. Tillage and soil type effects on soil surface
roughness at semiarid climatic conditions. Soil Till Res. 2008;98:35-44.
Guzha AC. Effects of tillage on soil microrelief, surface depression
storage and soil water storage. Soil Till Res. 2004;76:105-14. Huang C, Bradford JM. Application of a laser scanner to quantify soil microtopography. Soil Sci Soc Am J. 1992;56:14-21. Kamphorst EC, Jetten V, Guérif J, Pitkanen J, Iversen NV, Douglas JT, Paz Gonzáles A. Predicting depressional storage from soil surface roughness. Soil Sci Soc Am J. 2000;64:1749-58. Kemper WD, Rosenau RC. Aggregate stability and size distribution. In: Klute A, ed. Methods of soil analysis: Physical
and mineralogical methods. 2a ed. Madison: American Society of Agronomy; 1986. Part 1, p.425-441.
Klink CA, Machado RB. Conservation of the Brazilian Cerrado.
Linden DR, Van Doren Jr. DM. Parameters for characterizing tillage-induced soil surface roughness. Soil Sci Soc Am J.
1986;50:1560-5.
Lopes PRC. Relações da erosão com tipos e quantidades de
resíduos culturais espalhados uniformemente sobre o solo
[dissertação]. Porto Alegre: Universidade Federal do Rio Grande
do Sul; 1984.
Mazurana M, Levien R, Muller J, Conte O. Sistemas de preparo de solo: alterações na estrutura do solo e rendimento das culturas.
R Bras Ci Solo. 2011;35:1197-1206.
Onstad CA. Depressional storage on tilled soil surfaces. Trans Am Soc Agric Eng. 1984;27:729-32.
Panachuki E, Alves Sobrinho T, Vitorino ACT, Carvalho DF,
Urchei MA. Avaliação da infiltração de água no solo, em sistema de integração agricultura-pecuária, com uso de infiltrômetro de
aspersão portátil. Acta Sci Agron. 2006;28:129-37.
Panachuki E, Bertol I, Alves Sobrinho T, Vitorino ACT, Souza CMA, Urchei MA. Rugosidade da superfície do solo sob diferentes
sistemas de manejo e influenciada por chuva artificial. R Bras
Ci Solo. 2010;34:443-51.
Renard KG, Foster GR, Weesies GA. Predicting soil erosion by water: a guide to conservation planning with the revised
universal soil loss equation (RUSLE). Washington: United States Department of Agriculture; 1997.
Ries JB, Hirt U. Permanence of soil surface crusts on
abandoned farmland in the Central Ebro Basin/Spain. Catena. 2008;72:282-96.
Roisin CJC. A multifractal approach for assessing the structural state of tillage soils. Soil Sci Soc Am J. 2007;71:15-25.
Salton JC, Mielniczuk J, Bayer C, Boeni M, Conceição PC, Fabrício AC, Macedo MCM, Broch DL. Agregação e estabilidade
de agregados do solo em sistemas agropecuários em Mato Grosso do Sul. R Bras Ci Solo. 2008;32:11-21.
Tackett JL, Pearson RW. Some characteristics of soils crusts formed by simulated rainfall. Soil Sci. 1965;99:407-13.
Tisdall JM, Oades JM. Organic matter and water stable aggregates in soils. J Soil Sci. 1982;33:141-63.
Zhao L, Wang L, Liang X, Wang J, Wu F. Soil surface roughness effects on infiltration process of a cultivated slopes on the Loess
Plateau of China. Water Res Manage. 2013;27:4759-71.
Zheng Z, He S, Wu F. Changes of soil surface roughness under
water erosion process. Hydrol Proc. 2013;28:3919-29.
Zoldan Junior WA, Bertol I, Pegoraro R, Fabian EL, Zavaschi E, Vidal Vázquez E. Rugosidade superficial do solo formada por escarificação e influenciada pela erosividade da chuva. R Bras