Promoter Motifs Regulating Gene Expression in Spore
and Infection Stages of
Phytophthora infestans
Sourav Roy, Meenakshi Kagda, Howard S. Judelson*
Department of Plant Pathology and Microbiology, University of California, Riverside, California, United States of America
Abstract
Most eukaryotic pathogens have complex life cycles in which gene expression networks orchestrate the formation of cells specialized for dissemination or host colonization. In the oomycetePhytophthora infestans, the potato late blight pathogen, major shifts in mRNA profiles during developmental transitions were identified using microarrays. We used those data with search algorithms to discover about 100 motifs that are over-represented in promoters of genes up-regulated in hyphae, sporangia, sporangia undergoing zoosporogenesis, swimming zoospores, or germinated cysts forming appressoria (infection structures). Most of the putative stage-specific transcription factor binding sites (TFBSs) thus identified had features typical of TFBSs such as position or orientation bias, palindromy, and conservation in related species. Each of six motifs tested inP. infestanstransformants using the GUS reporter gene conferred the expected stage-specific expression pattern, and several were shown to bind nuclear proteins in gel-shift assays. Motifs linked to the appressoria-forming stage, including a functionally validated TFBS, were over-represented in promoters of genes encoding effectors and other pathogenesis-related proteins. To understand how promoter and genome architecture influence expression, we also mapped transcription patterns to theP. infestansgenome assembly. Adjacent genes were not typically induced in the same stage, including genes transcribed in opposite directions from small intergenic regions, but co-regulated gene pairs occurred more than expected by random chance. These data help illuminate the processes regulating development and pathogenesis, and will enable future attempts to purify the cognate transcription factors.
Citation:Roy S, Kagda M, Judelson HS (2013) Genome-wide Prediction and Functional Validation of Promoter Motifs Regulating Gene Expression in Spore and Infection Stages ofPhytophthora infestans. PLoS Pathog 9(3): e1003182. doi:10.1371/journal.ppat.1003182
Editor:Brett Tyler, Oregon State University, United States of America
ReceivedSeptember 8, 2012;AcceptedDecember 20, 2012;PublishedMarch , 2013
Copyright:ß2013 Roy et al. This is an open-access article distributed under the terms of the Creative Commons Attribution License, which permits unrestricted use, distribution, and reproduction in any medium, provided the original author and source are credited.
Funding:This work was supported by grants from the United States Department of Agriculture, National Institute of Food and Agriculture (2008-35319-04536) and the National Science Foundation (IOS-0949426 and MCB-1120225). The funders had no role in study design, data collection and analysis, decision to publish, or preparation of the manuscript.
Competing Interests:The authors have declared that no competing interests exist.
* E-mail: [email protected]
Introduction
Eukaryotic pathogens typically employ specialized structures for dissemination and infection. Most filamentous fungi and oomycetes, for example, proliferate in their hosts as vegetative hyphae, which generate spores that are used to reach new infection sites [1]. The spores of many plant pathogens, especially those with a biotrophic disease stage, germinate to form structures known as appressoria that are used to breach the host epidermis. Transitions between these stages requires the precise control of transcription, which is accomplished through interac-tions between transcription factors and their binding sites (TFBSs) in DNA [2]. Some transcription factors and their cognate TFBSs have been identified in filamentous fungal and oomycete pathogens [3–6], but relatively little is known about the structure or regulation of their promoters compared to those of model saprophytes and animals. Studies in Saccharomyces cerevisiae have shown that its promoters typically contain only a small number of regulatory sequences located a few hundred bases upstream of the transcription start site [7]. This contrasts with metazoans, where genes are also controlled by more distant motifs, which often bind many transcription factors and exert long-range effects across chromatin domains [8].
Identifying TFBSs in the promoters of pathogen genes is an important step towards characterizing the networks that regulate growth, differentiation, and pathogenesis. The classic strategy for identifying regulatory motifs by promoter mutagenesis is laborious and not suited to genome-wide application, especially in non-model systems which include most plant and animal pathogens. In recent years, bioinformatic analyses enabled by genome sequenc-ing and expression profilsequenc-ing have helped accelerate the discovery of promoter motifs in model organisms. Typically, co-regulated promoters are searched for over-represented motifs using methods that include enumerative search, expectation maximization, or Gibbs Sampling algorithms [9–12]. Comparative genomics also offers methods for predicting motifs by searching cross-species promoter alignments for phylogenetic footprints, i.e. regions of conservation [13]. The over-representation and evolutionary approaches have both been used with some success, since many of the resulting motifs resemble those identified by traditional methods [10,13–17].
Relatively little is known about the organization and function of promoters in oomycetes, a group of eukaryotes that includes important pathogens of plants and animals. Studies of the potato late blight pathogenPhytophthora infestansand relatives revealed a novel genome structure comprised of gene-dense and gene-sparse
regions [18].P. infestansgrows by extending tubular hyphae which then form sporangia, each of which can release multiple biflagellated zoospores [19]. In response to external cues, the motile zoospores transform into walled cysts which extend germ tubes that form infection structures called appressoria. In prior studies, we used the traditional strategy of promoter mutagenesis to identify three motifs directing transcription during sporulation and zoosporogenesis [20–22].
Resources enabling high-throughput promoter analysis have recently been developed for P. infestans, including a genome sequence and microarray data [18,23]. In this report, we combine bioinformatic and functional approaches to identify TFBSs involved in stage-specific expression. More than 100 motifs associated with five life-stages were identified based on over-representation analysis. Most are high-confidence candidates since they also showed conservation in related species or positional bias within promoters. Functional testing of six motifs using reporter genes in P. infestans transformants confirmed their predicted activities.
Results
Overview of transcriptional landscape inP. infestans
To obtain data for planning the strategy for motif discovery, the genome-wide distribution of intergenic distances, GC-content in intergenic regions, gene orientations, and stage-specific expression patterns were analyzed. Previous researchers reported that the P. infestans genome is partitioned into gene-dense and gene-sparse regions [18]. We repeated that analysis, incorporat-ing data on gene orientation (Figure 1A). We focused on the 67% of genes that had 59 intergenic distances of ,2 kb, since their transcriptional regulatory sequences would be more likely to interact with those of adjacent genes. Of gene pairs separated by
,2 kb, 41% are transcribed from a common intergenic region, with transcripts in the 59 to 59 orientation; in such cases the median intergenic distance was 430 nt. Since 59 UTRs in P. infestansaverage about 41 nt [24], this implies that two functional promoters can reside within as little as 300 nt. By comparison, median intergenic regions inS. cerevisiae,Arabidopsis thaliana, and Homo sapiensare 0.45, 1.5 and 35 kb, respectively [25–27]. The
remaining 59% ofP. infestansgenes are transcribed in the same orientation, with the 39end of one gene being adjacent to the 59
end of its neighbor; their median intergenic distance was 441 nt. We also studied if intergenic regions varied in size depending on how genes were expressed, as this would help indicate the best search space for motifs. This took advantage of a prior microarray study of five developmental stages [23]. Five sets of promoters from 100 genes induced strongly (.7.5-fold) in each of the stages were assembled. These were from genes up-regulated in sporangia compared to hyphae (‘‘sporangia promoter set’’), sporangia chilled for 1 hr to stimulate zoosporogenesis versus untreated sporangia (‘‘cleavage set’’), zoospores versus chilled sporangia (‘‘zoospore set’’), and germinating cysts forming appressoria versus zoospores (‘‘germinating cyst/appressoria set’’). A hyphal set was also developed from genes with higher mRNA levels in hyphae than the other stages. In addition, 150 constitutive genes were identified for which mRNAs varied by less than 25% between stages. Each gene model was curated manually, guided by EST data and sequences fromPhytophthora ramorumandPhytophthora sojae. Correc-tions were applied to the 59ends of 13% of theP. infestansgene models.
The resulting data suggested that stage-induced promoters are larger than those from constitutive genes. This involved sorting the genes into groups with the different expression patterns, and then calculating median 59intergenic distances for the subset that were closely spaced, i.e. 2 kb or less from another gene (Figure 1B). Although each dataset spanned a broad range, the median 59
intergenic region of constitutive genes was the smallest at 317 nt. Values from the inducible genes ranged from 373 for the sporangia set to 616 for the hyphal set. This resembles trends in other species, presumably since variably-expressed genes bind more transcription factors [25].
To develop background models for evaluating the statistical significance of motif frequencies, we also measured AT content 1-kb upstream of ATG codons. This averaged 49.6%, but rose to 54% near the start of genes (Figure 1C). The profile of the curve in the figure may reflect the small size of the typical P. infestans promoter, if its functional regions have a uniform AT content. Alternatively, the core promoter (the site that nucleates the assembly of a functional preinitiation complex; [28]) may be more AT-rich than other upstream regions, where most stage-specific TFBSs are expected. Genome-wide, intergenic regions are 49.3% AT compared to 46.1% for coding sequences [18].
Influence of gene location and orientation on expression In light of the close proximity of most P. infestans genes, we examined whether genes influenced the transcription of their neighbors. This would be relevant to motif discovery since a TFBS between two genes might influence both. For the analysis, we mapped expression patterns alongP. infestanssupercontigs and also calculated correlations between adjacent gene pairs.
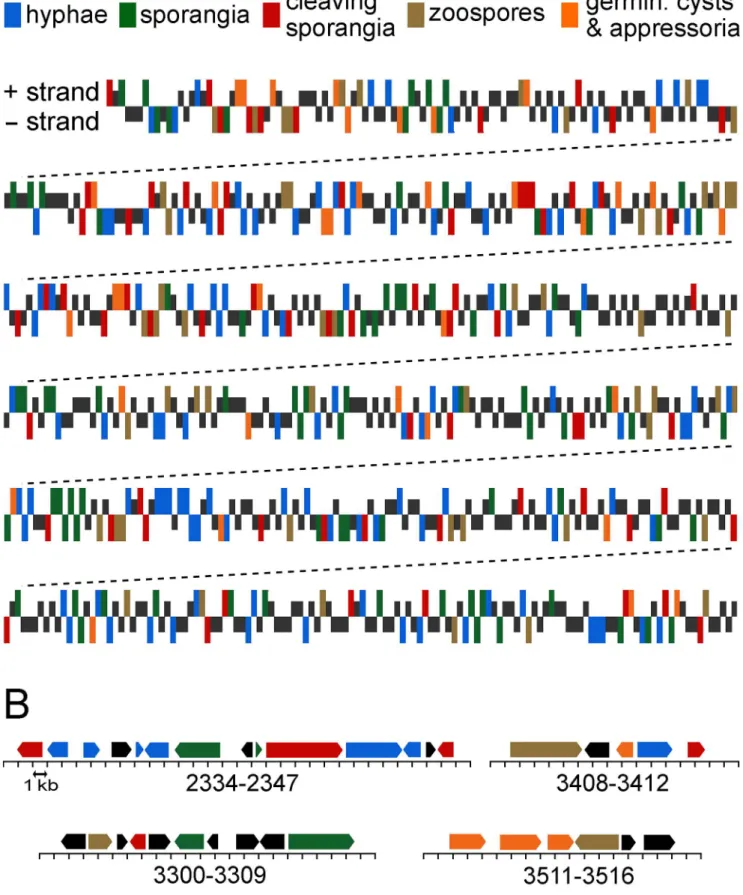
For mapping expression patterns, we linked features in the microarrays to gene models in the P. infestans assembly, upon which the transcription patterns were plotted. This is illustrated in Figure 2A for a representative portion of Supercontig 1 (not drawn to scale), in Figure 2B for four selected regions (drawn to scale), and in Figure S1 for all genes. In these figures, genes showing. 2-fold higher mRNA levels than average in one of the five stages are color-coded based on the stage with the maximum level; for example, green means highest in sporangia. Genes with the same stage-induced pattern were not typically adjacent, for example there were no physical clusters of genes having peak expression in sporangia. We also calculated the probability of adjacent genes having the same stage-induced pattern, focusing on 3744 pairs of Author Summary
neighboring genes as well as a subset of 2937 genes residing within 2 kb of each other; whileP. infestansencodes about 17,797 genes, not all were represented or yielded signals on the arrays. With a few exceptions, adjacent genes showed unrelated patterns of stage-specific induction. Most exceptions involved tandemly repeated gene families, which would be expected to be co-expressed since both promoter and coding regions were likely to have undergone duplication. This occurred most for genes induced in the germinating cysts with appressoria stage; only for this stage were co-induced genes clustered more than expected by random chance at a 95% confidence interval. This was attributable to tandemly duplicated sets ofb-glucanases, protein kinases, glucose transport-ers, and bZIP transcription factors, among others. One example is presented in the lower right portion of Figure 2B, which illustrates three co-expressedb-glucanases (PITG_03511, PITG_03512, and PITG_03513). A second example is an array of genes annotated as glucose transporters (PITG_13001 to PITG_13007). Such obser-vations are consistent with prior studies that showed that genes induced in this pre-infection stage are rapidly evolving and prone to duplication [29].
In addition to the above which focused on the distribution of stage-induced patterns, we also measured global expression between gene pairs since this might detect subtle interactions. There was a weak tendency for pairs to be co-expressed, with an average Pearson correlation coefficient (r) of 0.11. Moreover, the distribution of r values between gene pairs and pairs from a scrambled dataset were significantly different based on a
Kolmogorov-Smirnov test (p,0.001). The expression of 375 pairs were highly correlated (r.0.8) and 87 were anticorrelated (r,20.8). Of the 375 co-regulated pairs, 53% were transcribed in the same direction, and 55% of these represented duplicated genes. In contrast, only about 10% of the co-regulated 59-to-59
genes were duplicated. There was little correlation between 59
intergenic distance and co-regulation (r=20.09).
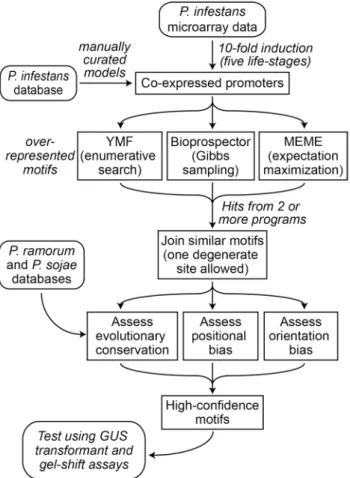
Discovery of over-represented stage-specific motifs The scheme illustrated in Figure 3 was used to identify candidate specific TFBSs. In brief, the five sets of stage-induced promoters were searched for motifs that were over-represented compared to total P. infestans promoters. A search space of 1-kb of 59sequences was selected since this should include most TFBSs, based on the data in Figure 1B. The motifs were then tested for positional bias, orientation bias, and evolutionary conservation.
Each of the five stage-induced datasets were searched separately for motifs using BioProspector, MEME, and YMF. These programs were selected since they employ independent methods and scored well in prior comparisons [11,30]. We focused on promoters from genes induced.10-fold between developmental transitions (443 genes in the five promoter sets); this fold cut-off was raised compared to our earlier analyses to reduce noise in motif discovery. We also focused on motifs detected by at least two of the programs, allowing degeneracy at two sites. About 145 motifs fit this requirement, which were consolidated to 107 by Figure 1. Characteristics of promoters inP. infestans.(A)Intergenic distances between genes oriented 59to 59and 39to 59are shown in the top and bottom graphs, respectively. Values are based on 15,471 genes from the largestP. infestanssupercontigs.(B)Median 59intergenic distances in genes with different patterns of expression, based on the subset of genes having intergenic distances,2 kb. As described in Results, these were from constitutively expressed genes (CON), or those induced.7.5-fold in sporangia (SP), swimming zoospores (ZO), germinated cysts (GC), cleaving sporangia (CL), or hyphae (HY).(C)A+T content of DNA upstream of start codons, calculated in 50-nt bins. Little change was observed further
upstream.
joining those that were similar in sequence and had similar patterns of over-representation. Based on ap-value threshold of 1022, 103 showed significant over-representation in at least one stage, which is shown in heat-map format in Figure 4; the motif sequences and number of hits in each dataset are in Table S1. The overall AT content of the 103 motifs was 49.9%, five were palindromes, and lengths ranged from 6 to 9 nt.
Approximately 80% of the 103 motifs were linked strongly to one developmental stage or two consecutive stages, and are therefore good candidates for binding sites for transcription factors that determine stage-specific expression. Based on the number of stages for each motif that passed the p-value threshold of 1022, about 52 motifs were specific for a single stage. Examples include motif 82 (M82), which was significantly over-represented in sporangia-induced promoters (p= 1028) but not the other sets, M95 which associated only with germinating cysts with appres-soria (p= 10212), and M99 which associated only with hyphae (p= 10212).
About 21 motifs were significantly over-represented in promot-ers from two sequential stages, and 10 from three sequential stages. About half of the 21 were over-represented in the germinated cyst/appressoria and hyphal promoters, such as M87 (p= 10214
and 10213, respectively). This was not unexpected, since cyst germ tubes are very similar to hyphae and transition into hyphae. Several motifs were over-represented in sporangia and cleaving sporangia-induced promoters, such as M43 (p= 10211and 1027, respectively). This was also not surprising since these stages are separated only by a 1-hr cold treatment, and many mRNAs induced in sporangia continue to rise during zoosporogenesis and/ or during the zoospore stage. Accordingly, some motifs such as M64 were also over-represented in the sporangia, cleaving, and swimming zoospore promoters (p= 1024 and 1023, and 1023 respectively). Likewise, several motifs were over-represented in hyphal and sporangia-induced promoters, such as M86 (p= 1026 and 1028, respectively). This may be explained by the fact that oomycete sporangia develop directly from hyphae, or that some tissue samples used for microarray analysis were not very synchronous. Regardless of the explanation, the approximately 80 motifs that associated with promoters from one or two sequential life stages are all good candidates for sites that bind transcription factors with stage-specific activities.
Two motifs matched the three promoter sites that were shown previously by mutagenesis to be needed for stage-specific transcription. M97, which was over-represented in the cleavage promoter set, is a close match (in the reverse orientation) to a site required for inducing the NifC gene during that stage [20]. Sporangia-associated motif M43 is an exact match to the site required for inducing thePks1gene during sporulation [22], and a close match (in the reverse orientation) to the region needed to induceCdc14during sporulation [21].
Not all motifs were associated only with consecutive stages. About 15 were over-represented in promoters from nonconsec-utive stages, or both developmental or constitnonconsec-utive promoters (Figure 4, Table S1). One example is M60, which was over-represented in sporangia and swimming zoospore-induced promoters (p= 10216 and 10213, respectively) but not the intervening stage of cleaving sporangia (p= 0.8). A total of six motifs (M1, M8, M13, M60, M64, M67) occurred more in total promoters than expected by random chance; these may act as general enhancers.
Positional and orientation bias
Many transcription factors need to act at a certain distance from the transcription start site or other regulatory locations, and therefore their TFBSs concentrate at a certain site within promoter space [31,32]. Whether any of the motifs exhibited this bias was determined by mapping them within 200-nt bins from the relevant promoter set; 65 motifs were found to have positionally biased distributions (column ‘‘Pos. Bias’’ in Figure 4, Table S1). This may be an underestimate, since convincing evidence of bias could not be drawn for low-frequency motifs.
Data for 18 representative positionally biased motifs are shown in Figure 5. About one-third, such as M8 and M38, had distributions matching overall promoter size as shown in Figure 1A indicating that these TFBSs lack a strong positional bias. In contrast, motifs such as M68 and M83 tended to reside 200–600 nt upstream of the start codon. Others such as M30, M39, M53 (not shown in Figure 5), M57, and M82 were found closer to the transcription start site. M30 and M39 do not match known oomycete core promoter motifs, but M53 resembled the
order and not distance, and marks above and below the axis represent genes transcribed to the right and left, respectively.(B)Four selected regions, drawn to scale, showing gene orientations and expression patterns using the key from panel A. One division equals 1-kb, and gene numbers trimmed of their PITG prefixes are shown below the scale.
doi:10.1371/journal.ppat.1003182.g002
Figure 3. Strategy for characterizing stage-specific motifs from
P. infestans.
Inr or Initiator [33]. Interestingly, M53 was over-represented in promoters induced in the germinating cyst with appressoria stage. As a control, we observed that similar biases were not observed in total promoters, where most matches may be false hits. This is illustrated at the base of Figure 5 for three representative motifs, M87, M95, and M97. These had biased distributions in induced promoters (Figure 5, second row from bottom), but very different patterns in total promoters (Figure 5, bottom row). Due to variation in AT-content across promoters (Figure 1C), the controls are not expected to have similar values in each bin. As AT-rich motifs, hits to M87 and M95 due to random chance are more common in the 39portion of total promoters, which are AT-rich. The opposite was observed for GC-rich motifs such as M97.
Some transcription factors must orient in a certain direction to fulfill their regulatory function. InS. cerevisiae, for example, 47% of TFBSs were found to have an orientation bias [32]. As shown in the column labeled ‘‘F/R bias’’ in Figure 4 and Table S1, this was the case for 50 of the 98 non-palindromic motifs (52%) fromP. infestans, using a p-value threshold of 1022. Cleaving sporangia-associated motif M33, for example, was detected 87 times in the forward orientation in the 95 cleavage-induced promoters but only 50 times in the reverse orientation. After correcting for the false discovery rate, the bias is even greater at 71 versus 27.
Conservation of motifs inPhytophthora
About 78% of P. infestans motif candidates were judged to be conserved in orthologous promoters fromP. ramorumorP. sojae. A conclusion about whether a motif was conserved was developed by aligning promoters from about five genes; a match in at least some was considered to be indicative of conservation. Assessments for each motif are shown individually in the ‘‘Evol. Con.’’ column in Figure 4 and in Table S1, and results for all motifs are summarized in Figure 6A. Evidence for conservation betweenP. infestansand both of the other two species was obtained for 52% of motifs. About 10% of motifs were conserved betweenP. infestansand P. ramorumonly, and 16% between P. infestans and P. sojaeonly. In 11% of cases, motifs were absent from bothP. ramorumandP. sojae. In 11% of cases, the motifs were detected at new locations in one or both species; this was taken as an ambiguous result, since while promoter rearrangements are common [34] they are hard to distinguish from false hits.
Figure 6 shows representative alignments where conservation was detected. For cleavage-inducedP. infestansgene PITG_16321 and its P. ramorum and P. sojae orthologs, for example, perfect matches to M51 were detected in the same location in all three species. The PITG_16321 alignment also reflects the common Figure 4. Features of the 103 motifs fromP. infestans.The heat map indicates p-values associated with over-representation in the hyphal (HY), sporangia (SP), cleaving sporangia (CL), swimming zoospore (ZO), and germinated cyst (GC)-induced promoter sets compared to total promoters. Also graphed arep-values in constitutive promoters (CON). For clarity,p-values below 1026are shown as 1026;
the original values are in Table S1. The first column of ovals on the right of the heatmap indicates if motifs were evolutionarily conserved inP. ramorumorP. sojae(Evol. Con.), with black indicating yes in at least one species, white meaning no, and grey denoting ambiguous,i.e.motifs were found but in new locations. The next column indicates whether motifs were positionally biased (Pos. Bias), with black marking yes, white meaning no, and grey indicating ambiguous since the motifs did not occur enough in the relevant promoter database for trustworthy analysis. The column of ovals on the right indicates whether motifs had a significant (p,1022) orientation bias, with black meaning yes and
white no. An asterisk next to the motif name indicates those that were subjected to functional testing inP. infestanstransformants.
relationship seen between orthologous promoters: two to four sequence blocks are typically conserved. One usually spans the transcription start site, which in this case contains an Initiator-like sequence at 271 in P. infestans. Other conserved regions are typically found 40–200 nt upstream. For PITG_16321 these are the M51-containing block at2177, and another at2114. As will be shown later, the2114 block and conserved nucleotides a few bases to the left and right of M51 do not determine stage-specific expression.
Results for three ortholog sets containing sporulation-associated motif M58 are also shown in Figure 6. For PITG_03886, M58 is conserved perfectly in the three species. In PITG_09960, a three-way match also exists allowing for one base change inP. sojae;this was scored as a positive hit, since TFBSs often vary between species [35]. The PITG_14222 alignments show M58 at the same location in P. infestans and P. sojae, but 80-nt upstream in P. ramorum.Since the latter could be a false hit, our scoring scheme classifies M58 in PITG_14222 as conserved only between P. infestansandP. sojae.Since M58 was at the expected location inP. ramorumandP. sojaeorthologs of PITG_03886 and PITG_09960, however, its overall classification is ‘‘conserved’’.
High-confidence motifs
Nearly all of the motifs demonstrated one or more character-istics typical of authentic TFBSs besides over-representation, such as interspecific conservation, positional bias, orientation bias, or palindromy (Figure 7). Of the 103 motifs, 101 had at least one of these features in addition to over-representation, 78 had at least two, and 25 had three. These classifications help indicate which motifs have the highest likelihood of having a function, in addition to suggesting how they interact with the transcriptional apparatus.
The two motifs lacking these additional characteristics were M1 and M66. These may still be real TFBSs, since not all experimentally confirmed sites exhibit positional bias or direction-ality, or reside in the same location in orthologs. The two motifs were over-represented in at least one developmental stage with p-values ranging from 1024to 1025and thus are unlikely to be false hits.
A few of the ‘‘high-confidence’’ motifs were close in sequence. These were M93 (TACATGTA) and M94 (TACCGGTA), which are palindromes differing only at the two central bases, M32 (AGC[AG]CAAG) and M34 (AGCTGAAG) which also differ at the two central bases, and M16 (AAATAAA) and M91 (TAAATAA) which overlap. As mentioned earlier, most motifs from BioProspector, MEME, and YMF had been merged if they differed at two or fewer sites and were over-represented in the same stages. The six motifs remained unmerged since their biases and/or probability distributions and varied. For example, M16 but not M91 was over-represented in hyphal-induced promoters (p= 1026 and p= 1021, respectively), and M93 was more over-represented than M94 in hyphal promoters (p= 10226,p= 1022).
Functional tests of motifs
Six of the motifs were subjected to experimental analysis to see if they could drive b-glucuronidase (GUS) expression with the expected stage-induced pattern in transformants ofP. infestans. As described below, each yielded the expected pattern. First analyzed was M51, which was predicted to confer expression during zoosporogenesis (i.e. sporangial cleavage). Interestingly, M51 is flanked by two sequence blocks that are conserved inP. ramorumand P. sojae, which are labeled LB and RB in Figure 6. These flanking sequences were not over-represented in cleaving sporangia Figure 5. Positional bias of representative motifs within
promoter space. The relative frequency of each motif is mapped across 200-nt bins taken from the relevant stage-induced promoter set, normalized to a value of 1.0 for the most populous bin. Marked in each panel is the motif and promoter dataset used for analysis, using the abbreviations in Figure 4. The bottom row shows three controls, indicating the frequency of three motifs in 2000 randomly selected promoters. The actual number of hits for each motif in the stage-induced promoter sets are in Table S1.
promoters, but we considered the possibility that our definition of M51 was smaller than the authentic TFBS.
Initial experiments showed that at least part of the LB-M51-RB region was required for zoosporogenesis-specific expression. Plasmid pDEL312, which contains a 312 nt promoter fused to GUS, yielded expression in sporangia treated at 10uC for 1-hr to induce the cleavage of sporangia into zoospores, but not sporangia maintained at 22uC; for this plasmid and others described below, similar results were observed in multiple transformants. The zoosporogenesis-specific activity of the promoter fragment was shown first by histochemical staining (as in Figure 8), and later by RNA blot analysis in which bands of the expected size were detected only in the chilled samples (Figure 9). No activity was seen in hyphae. Indistinguishable results were obtained using a 500 nt promoter (not shown). pDEL187, which lacked bases upstream of the LB-M51-RB region, showed the same staining pattern and gene induction was confirmed by RNA blot analysis. pDEL104, which lacks the LB-M51-RB block, showed no expression.
Subsequent experiments specifically tested the functions of LB, M51, and RB by mutating those regions within pDEL187, and led to the conclusion that only M51 conferred stage-specific expres-sion. Similar results were obtained from histochemical staining (not shown) and RNA blot analysis (Figure 9). Specifically mutating LB had no effect on stage-specific expression (pMUT1), while altering M51 prevented expression (pMUT2). As a control, we showed that the native gene in the transformants was induced in sporangia by the cold-treatment. Mutating RB did not block cold-induction of the transgene, although its basal expression seemed to be slightly elevated (pMUT3). Next, oligonucleotides containing the LB-M51-RB block or M51 alone were fused to the NifSminimal promoter, which contains a transcriptional start site but is not expressed on its own [21]. As shown in Figure 9, a fusion of LB-M51-RB to the minimal promoter, separated by a 37-nt spacer of random DNA, drove the normal chilling-specific expression of GUS (pOLIGO1). As a final and definitive test, an oligonucleotide containing M51 alone was shown to also confer this wild-type pattern to transformants (pOLIGO2).
Figure 6. Interspecific conservation of motifs.(A)Pie chart illustrating the fraction of the 103 motifs that were detected at the same (i.e. expected) location in alignments of orthologous promoters fromP. infestans(Pi),P. ramorum(Pr) andP. sojae(Ps), in the same location inP. ramorum orP. sojaecompared toP. infestans, in a new location inP. ramorumorP. sojae, or not detected outside ofP. infestans. (B)Representative CLUSTAL alignments. Shown on the left side of the figure are alignments of PITG_16321 (containing M51) with its orthologs fromP. ramorumandP. sojae. Conserved blocks to the left and right of M51 are labeled as LB and RB, respectively. Shown in the right column are alignments of PITG_03886, PITG_09960, and PITG_14222, which contain M58. Also marked is the Initiator core promoter element, INR, which normally spans the transcriptional start site.
Since the above experiments indicated that at least some motifs could act autonomously, we next tested five other predicted stage-specific motifs by fusing them one at a time to theNifSminimal promoter. Motifs M39, M58, M64, and M75 were most over-represented in the sporangia stage, and each resulted in the sporulation-specific accumulation of GUS (Figure 8). No staining was seen in nonsporulating hyphae. The effects of the motifs were subtly different, however. Transformants containing M58 showed GUS staining at the earliest stage; these showed expression within hyphae soon after cultures were stimulated to sporulate, and then later in sporangiophore and mature sporangia. This illustrated in Figure 8 where the three panels show (left to right) staining within a small segment of a hypha in a sporulating culture, immature sporangia (lacking basal septa and papilla), and mature sporangia. Transformants containing M39 and M64 first exhibited GUS staining in hyphal-like structures that are presumed to be sporangiophores, and then in mature sporangia. In contrast, expression driven by M75 seemed to be activated at a later stage, since staining was first observed in sporangia near maturity. It should be noted that while M58 was most over-represented in the sporangia stage (p= 1028), it was also over-represented in hyphae (p= 1026) and constitutive promoters (p= 1023); perhaps it binds a
transcription factor which does not become activated until sporulation is induced.
Also tested as a fusion with the minimal promoter was M95, which was associated with transcription in germinated cysts and appressoria. This resulted in the accumulation of GUS in germinated cysts, including their germ tubes and appressoria (Figure 8). Staining was first observed 2 hours after encystment. No expression was observed in hyphae, sporangia, chilled sporangia, or zoospores. As described later, this motif is associated with the expression of many pathogenesis-related proteins.
Gel-shift assays
Further support for the motifs was provided by electrophoretic mobility shift assays (EMSA) involving M51, M58, and M75. As shown in Figure 10, each motif bound a protein from nuclear extracts of cleaving sporangia (M51) or sporangia (M58, M75). Binding appeared to be specific based on comparing different unlabeled competitors. These included a specific competitor (same sequence as the labeled probe), a nonspecific competitor (a random sequence), and mutated competitor (same as the labeled probe, but with the motif mutated). In each case the nonspecific and mutated competitors had little effect in reducing the binding Figure 7. Summary of results from analysis of evolutionary conservation, positional bias, forward/reverse directionality, and palindrome analysis.Of the 103 predicted TFBSs, 101 show at least one of these features and are included in the figure.
of the labeled probe, compared to the specific competitor. For M51, several bands were detected, which was suggestive of a multi-protein complex or the binding of proteins of different sizes.
Association of motifs with pathogenicity factors
Several classes of proteins have been identified that play roles in pathogenesis, of which many are secreted and sometimes induced during infection [29,36,37]. To assess the usefulness of our data for understanding how such genes are regulated, we checked their promoters for the motifs, focusing on motifs associated with the germinating cyst/appressoria stage. This involved analyzing the main classes of genes annotated by Raffaele et al. [29] as potentially encoding secreted pathogenicity factors, of which many are induced during plant infection. As shown in Table 1, four motifs associated with the germinating cyst/appressoria stage and ten linked to both the hyphal and germinating cyst/appressoria stages were over-represented (p,0.05) in such genes. These included those encoding plant cell-wall degrading enzymes, glucanase inhibitors, Nep1-like (NLP) toxins, PcF toxins, elicitins and elicitin-like proteins (potential sterol carriers), proteases, protease inhibitors, and RXLR effectors. As expected, motifs linked to stages such as sporangia and zoospores were typically under-represented (Table S2).
Not all genes in each group contained a germinated cyst/ appressoria motif in their promoters, however. For example, such motifs were in only 225 of the 493 RXLR promoters, with 66 containing M95, 163 having M101, and 49 having M103 (Table S2). As only some RXLR genes are induced during infection [18,29,38], we checked for a correlation between motif and expression pattern. RXLR genes with a germinated cyst/ appressoria motif were more likely to be infection-induced than those without; many had more than one motif, with a correlation between the degree of induction and motif number (r= 0.27, p= 0.04). Crinkler genes, which are not typically infection-induced but are considered to encode pathogenicity factors due to the ability of some to produce necrosis in plants [18], had M93 as the sole over-represented motif. M93, a palindrome, is over-repre-sented in both germinated cyst/appressoria and hyphal-induced genes and occurs 4150 times within P. infestans promoters. Its abundance suggests that it is associated with general growth and not specifically with pathogenesis.
Predictive value of motifs
We assessed the extent to which the presence of a motif predicts a gene’s expression pattern. This involved searching promoters of all 7,862 genes on the microarrays for motifs associated with sporangia-induced genes and germinated cyst/appressoria genes, using 500-nt of DNA upstream of the start codon as the search space. We then compared motif frequencies in promoters induced by.5-fold at each stage versus non-induced promoters. The 99 sporangia-induced and 103 germinated cyst/appressoria-sporangia-induced promoters Figure 8. Histochemical staining of GUS under control of stage-specific motifs in stable transformants of P. infestans. For cleavage-associated motif M51, shown are the staining patterns of sporangia kept at 22uC or incubated at 10uC for 1-hr, in a representative transformant containing pDEL187. No staining was seen in hyphae. Similar patterns were seen in transformants in which M51 alone was fused to theNifSminimal promoter (not shown). For the other motifs, the transformants contained fusions of the motifs to the minimal promoter, and the images presented illustrated when GUS expression was first detected. These were at early and late stages of sporulation (M39, M58, M64, M75) or in germinated cysts (M95). Labeled in the M95 panel are the cyst (c), germ tube (gt), and appressorium (a).
used originally for motif discovery were excluded from these analyses, to test if our earlier results extended to allP. infestansgenes. Each of the 11 sporangia-associated motifs occurred more often in the induced promoters than non-induced controls (Table 2). On average, each motif was 66% more likely to occur in an induced promoter, with individual motifs showing a 21 to 100% enrichment. For example, M8 was found in 14.3% of induced promoters compared to 11.6% of non-induced promoters, representing a 23% enrichment. It is important to note that hits due to random chance are always expected to greatly exceed the number of functional TFBSs for reasons elaborated upon in Discussion [39].
Most of the 15 motifs linked to the germinated cyst/appressoria stage were also over-represented in that stage when the total microarray data were analyzed (Table 2). Each was on average 19% more likely to be in an induced promoter compared to controls. It is notable that four of the motifs were not enriched in the genome-wide set of induced promoters, including M95. Since our functional tests showed that M95 conferred expression in the germinated cyst/appressoria stage, it is possible that M95 binds a bifunctional transcription factor or has its activity mediated by other transcription factors.
We also checked for the association of a sporulation-associated motif with expression pattern in ten genes from P. infestansthat were not on the microarrays. Motif M8 was chosen for this exercise simply since it was first on the list in Table 2. We identified promoters containing M8, used RT-qPCR to measure mRNA in sporangia and nonsporulating hyphae, and assessed if M8 was within the orthologous promoter fromP. sojae(Table 3). Of sixP. infestansgenes in which theP. sojaeortholog also contained the motif, five were induced by.2-fold in sporangia. This was significant (p= 0.004), compared to the likelihood of this fraction of genes being induced by random chance. In contrast, none of the fourP. infestansgenes that lacked M8 in theirP. sojaeortholog was induced based on the 2-fold cutoff.
Discussion
Genome-wide searches for promoter motifs shared by co-expressed genes have been performed in model animals, plants, and fungi [14–17], but only on a limited scale in pathogens [40,41]. The strategy seemed attractive for Phytophthora since its modest transformation efficiencies make motif discovery through traditional means challenging [42]. The success of our approach was shown not only by the identification of 100 putative TFBSs, but the fact that all six motifs tested performed as predicted in functional assays. Nearly all motifs also exhibit at least one feature typical of TFBSs besides over-representation such as positional bias, orientation bias, or evolutionary conservation. Discovering the motifs, which include several associated with pathogenicity factors, is a key step towards understanding the networks that control development and host infection inPhytophthoraand similar approaches should be useful in other pathogens.
Several features contributed to our approach by increasing the sensitivity of our searches and reducing false positives. First, our requirement that motifs be identified by two of three algorithms
served as a stringent filter. Second, we focused on promoters that show large changes, which was possible since major shifts in mRNA levels occur during theP. infestanslife cycle as about 12% of genes change by.100-fold in the stages addressed by this study [23]. Third, gene models were manually curated to accurately define the search space. Finally, since intergenic distances are typically small in P. infestans, most regulatory regions were probably within the 1-kb search space.
Our analysis of the overall transcriptional landscape of P. infestanshas also helped illuminate the structure and function of its promoters; few promoter studies have previously been performed in the entire Kingdom Stramenopila, which includes diatoms and brown algae in addition to oomycetes [43]. Remarkably, the median intergenic distance within gene-dense regions ofP. infestans is even less than that of most yeasts [25,44]. The ratio of adjacent P. infestansgenes that are transcribed in the same direction versus from a shared or adjacent promoter region is 1.43, which is higher than that of S. cerevisiae and A. thaliana [45]. This presumably reflects functional constraints associated with having small adjacent promoters, which is reflected in the co-expression or anti-correlated profiles of about 10% of adjacentP. infestansgenes. Excluding cases where co-expressed pairs are duplicated genes, most adjacent genes in P. infestans are nevertheless transcribed independently. Our prediction of directionality for more than half of the motifs helps to explain how this independence is mediated. The predominant mechanism for regulating transcription in Phytophthora may also not involve chromatin-level effects, which in yeasts and metazoans are inferred to extend up to 4 kb and tens of kilobases, respectively [46]. Nevertheless, of the approximately 300 transcription factors annotated within each Phytophthora genome, several belong to families associated with chromatin remodeling [47].
Relative simplicity in transcriptional regulation inP. infestansis also implied by our finding that each of six stage-induced motifs tested conferred tissue-specific expression with a minimal promot-er. Combinatorial control, not counting transcription factor heterodimerization, thus may not be a principal feature of stage-specific regulation in oomycetes, unlike other eukaryotes with complex genomes [48,49]. Since position effects in P. infestans make it challenging to compare transgene expression between transformants [50], our data are silent on roles of other TFBSs in quantitative expression. The potential involvement of only a few TFBSs per gene is consistent with our observation of limited blocks of similarity betweenP. infestans,P. ramorumandP. sojaepromoters, as shown in Figure 6. As the three organisms are relatively distant in molecular phylogenies [51] and have significant morphological differences, it would be useful to know if the orthologs had similar patterns of expression.
Our analyses of motifs associated with sporangia and germi-nated cyst/appressoria stages (Table 2) suggests that the occur-rence of a motif has utility in predicting expression pattern. However, it is important to recognize the limitations of this approach. Since TFBSs are short and often degenerate, they occur by random chance in great abundance. Moreover, TFBS function depends on chromatin structure and often the co-occurrence of other TFBSs. Some transcription factors are also bifunctional, Figure 9. Constructs used to demonstrate function of M51 from promoter PITG_16321.Each contains sequences fused to the GUS reporter, which was transformed intoP. infestans. Shown for each construct are results from RNA blot analysis of two representative transformants (TF1, TF2). RNA was extracted from sporangia immediately after harvesting (2) or after a 1-hr cold treatment (+). RNA was hybridized with probes for the GUS reporter (gus), or the PITG_16321 open reading frame to detect the endogenous transcript (native). The top three constructs contained serial 59deletions of the wild-type promoter, and the bottom five contained oligonucleotides with the LB, M51, and RB sequences (represented by circles) fused to the minimalNifSpromoter (MIN) and GUS. Shown as loading controls are a photograph of rRNA and hybridization with theactA(actin) gene ofP. infestans.
leading to different outcomes depending on post-translational modification or co-regulators [52]. Because of such complications, Wasserman and Sandelin [39] posited the ‘‘futility theorem’’ which states that the great majority of predicted TFBSs lack function: it is thus futile to predict expression based on the occurrence of a promoter motif. Our experience inP. infestanswas more encouraging, however. For example, while the presence of a sporulation-associated motif was a weak forecaster of expression pattern, the predictive value was fairly strong if the motif was conserved in anotherPhytophthora.The limits of predictions based solely on motif presence can be illustrated for the 11 sporulation-associated motifs in Table 2. Based on their average size and base composition, and using 500-nt of promoter sequences as a search space, about 8250 promoters should contain one or more of the 11 motifs by random chance. Extrapolating from microarray data, however, only about 2200 genes are sporulation-induced, so random hits exceed functional TFBSs by a 4 to 1 ratio. Nevertheless, a future can be envisioned where better predictions of expression based on motif occurrence alone may be possible. In S. cerevisiae, a network model that integrated expression patterns of 2,587 genes under 255 conditions of growth and development with 666 TFBS definitions using AND, OR, and NOT logic resulted in fairly good predictions of expression of about 3/4 of the genes [53,54].
Inferences about the complexity of the networks that control development and pathogenesis inP. infestansmay be drawn from our observation that roughly 10 to 20 motifs were linked to each stage of the life cycle. This is consistent with observations that show that sporangia and zoospore formation involves several steps and signaling pathways [20,55,56]. Characterizing transcription factors that bind the motifs will help reveal details of these pathways, and enable chromatin immunoprecipitation studies to confirm the target genes [57]. Studying the transcription factors may also lead to strategies for blocking diseases, by interfering with the expression of proteins used for overcoming host barriers and defenses.
Materials and Methods
Microarray and promoter datasets forP. infestans
Expression data were from a prior study that used Affymetrix microarrays to measure mRNA during the stages addressed by this paper [23]. Reliable expression calls were detected for 12,463 of the 15,650 sequences targeted by the arrays. Since the microarrays predated the current draft genome which is based on strain T30-4 (available from the Broad Institute of Harvard and MIT), we linked the microarray sequences to annotated T30-4 genes using BLASTN, but excluded genes on small contigs to reduce errors in analyses of intergenic distances and co-expression. By selecting the best hit with
.97% identity, 7,862 genes with reliable expression data in the five life-stages were matched, including 3944 adjacent gene pairs of which 2937 were within 2 kb of each other. These were mapped to the assembly, omitting unexpressed or missing genes.
Datasets ofP. infestanspromoters included 1-kb of sequences 59of predicted open reading frames. Total promoters were downloaded from the Broad Institute database, and then subsets were extracted using custom scripts. Sets included promoters from the differential-ly-expressed gene sets described above, in which mRNA levels were induced by at least 7.5-fold compared to the prior development stage (p,0.05 based on replicates). Sets of at least 100 promoters were used for calculating 59 intergenic distances. For identifying over-represented motifs, analyses were limited to genes induced
.10-fold, which corresponded to 99, 95, 46, 103, and 100 in the sporangia, cleavage, zoospore, germinated cyst, and hyphal sets, respectively. Prior to extracting promoters, gene models were examined and corrected as needed (changing 8, 14, 17, 3, and 9 promoters, respectively). This mostly involved eliminating introns that contradicted EST evidence, or spanned regions that when converted to exons maintained the reading frame and had high similarity to P. ramorum and P. sojae orthologs. In addition, a constitutive promoter dataset was established from 150 genes that showed ,25% variation between the stages. Promoters from P.
Figure 10. Electrophoretic mobility shift assays.Nuclear proteins from cleaving sporangia or sporangia were mixed with32P-labeled double-stranded oligonucleotides containing M51, M75, and M58, and subjected to electrophoresis. Reactions were performed either with no competitor, or unlabeled competitors at 56, 256, and 1256the concentration of labeled probe. These were either a specific competitor (same as labeled probe), a nonspecific competitor containing unrelated sequences, or mutated competitors derived from the specific competitor but mutated for the motif. Stars indicate the specific bands, and FP stands for free probe.
doi:10.1371/journal.ppat.1003182.g010
Table 1.Motifs associated with early infection stages in promoters of genes encoding secreted pathogenesis candidate proteins.
Name of over-represented motif (number of genes)
Protein group GC-associated GC and HY-associated
Cell wall degrading enzymes (cutinase, polygalacturonase, pectin esterase, pectate lyase)
M19 M87, M93
Crinklers none M93
Glucanase inhibitors M103 M4, M80, M87, M93
Nep1-like (NLP) proteins M19, M95 M4, M12, M13, M87, M89, M93
PcF toxins M101 M4, M12, M87, M93, M94
Potential sterol carriers (elicitin and elicitin-like) M95 M4, M87, M89, M93, M94
Proteases M19, M95 M80
Protease inhibitors M95, M103 M4, M87, M89, M92, M93
RXLR effectors M95, M101, M103 M4, M80, M87, M89, M92, M93, M94, M96
Gene groupings employed the annotations of Raffaele et al. [29]. The table reports motifs associated with the germinating cyst with appressoria (GC) or the GC and hyphal (HY) stages that were over-represented in each group atP,0.05; the complete data are in Table S2.
Table 3.Expression pattern of genes containing M8.
Motif locations (within 600 nt 59of translation start)
P. infestansgene P. infestans P. sojaeortholog mRNA ratio (sporangia/hyphae)
PITG_02417 2137 2192 24.5
PITG_02250 2224 2230 6.8
PITG_03691 2112 2131 6.5
PITG_02149 2128 288 6.1
PITG_02224 2356 2167 3.8
PITG_02027 2289 2301 1.9
PITG_02337 2226 none 1.6
PITG_02430 2337 none 1.4
PITG_02048 2499 none 0.9
PITG_02729 2203 none 0.9
doi:10.1371/journal.ppat.1003182.t003
Table 2.Frequency of motifs in up-regulated promoters.
Occurrence of motif
Motif and associated stage % of induced genes (I) % of non-induced genes (NI) Ratio (I/NI)
Sporangia M8 14.3 11.6 1.23
M10 2.0 1.0 2.00
M29 0.6 0.4 1.60
M32 6.1 3.9 1.57
M43 12.3 7.3 1.69
M45 3.7 2.8 1.35
M64 6.6 4.5 1.45
M65 6.1 4.6 1.33
M68 3.7 1.9 1.99
M82 3.9 3.1 1.26
M90 2.0 1.7 1.21
Germinated M4 29.2 20.8 1.40
cysts with M13 13.5 12.6 1.07
appressoria M14 1.3 1.4 0.93
M15 1.3 1.4 0.93
M26 1.3 1.1 1.18
M48 1.4 1.2 1.17
M80 5.2 4.1 1.27
M85 1.5 1.2 1.25
M87 18.0 12.1 1.49
M88 14.1 11.5 1.23
M89 11.0 9.3 1.18
M92 1.9 1.5 1.27
M93 19.3 13.9 1.39
M95 3.8 3.8 1.00
M96 12.0 12.2 0.98
Values are percent of genes containing the indicated motifs within 500-nt of the start codon. For the two classes of motifs, induced genes (I) are defined as having 5-fold or higher mRNA levels in sporangia relative to hyphae, or in germinated cysts relative to zoospores. Non-induced genes were those having mRNA levels that did not change or were down-regulated during the transition. Motifs were not included if they were over-represented in constitutive promoters.
ramorum and P. sojae were extracted from genome assemblies downloaded from the Virginia Bioinformatics Institute.
Algorithms for detecting over-represented motifs Stand-alone versions of MEME (version 4.3.0; [12]), YMF (version 3.0; [9]), and BioProspector (release 2; [10]) were employed. MEME ran with minimum and maximum widths of 5 and 8, respectively, using 5 iterations. Gap opening and extension costs were 11 and 1, respectively, any number of repetitions were allowed, and the E-value cut-off was 1025. YMF used a value of 8 for lenOligo (the number of non-spacer characters) and output was sorted byz-score. BioProspector used a value of 8 for motif width, with the 100 top motifs reported per run. The program was run 10 times on each set of promoters and a PERL script was used to eliminate redundant motifs.
Initial outputs (382 motifs from BioProspector from the five stage-induced promoter datasets, 450 from MEME, and 1261 from YMF) were submitted to a PERL script to detect motifs detected by at least two programs. These were then merged to eliminate redundancy, allowing degeneracy at two sites.Pvalues for over-representation of the final motifs were calculated based on a hypergeometric distribution, using Fisher’s Exact test. The locations, numbers, and orientations of each motif were extracted from the datasets using custom Perl scripts, with tests for orientation bias employing Chi square. Motifs that were position-ally biased were identified by counting the number of hits per 200-nt bin, extending 1-kb upstream of the start codon, and checking for deviations from a random allocation model using a 2 by 5 Fisher’s Exact test.
Tests for evolutionary conservation
Candidate orthologs were identified inP. capsici,P. ramorum, and P. sojaegenome databases (from the Joint Genome Institute of the U. S. Department of Energy) using BLASTP. Their promoters were then extracted, and aligned with CLUSTALW using gap opening and extension penalties of 10 and 0.1, respectively, and DIALIGN using default parameters [58,59]. After preliminary tests,P. capsiciwas omitted since the version of its genome assembly available at the time contained too many gaps and erroneous gene models. Putative three-way orthologs (P. infestans, P. ramorum, P. sojae) were identified for 66% of genes. Up to five genes (mean = 4.6) were typically examined for each motif. If a motif appeared in the alignment at the same position in at least one comparison it was scored as being evolutionarily conserved. A score of ‘‘ambiguous’’ was given for motifs found in a different location (including by searching in both orientations); on average, 8% of promoters would have a false positive. Conservation at the same site in ortholog sets for all genes was never expected: gene models in the different species often started at different locations, errors may have occurred in selecting orthologs, not all orthologs might have similar expression patterns, and promoter rearrange-ments are common during evolution.
Manipulations ofP. infestans
Stable transformants were generated from isolate 1306 (from tomato in California, USA) using a liposome-assisted protoplast method as described [42], except that Extralyse (Laffort, Bordeaux, France) was used as theb-glucanase. Non-sporulating mycelia were obtained by inoculating clarified rye-sucrose broth with a sporangial suspension (104/ml), followed by 48 hr incubation at 18uC. Sporangia were obtained from rye-sucrose agar cultures by adding water, rubbing with a glass rod, and passing the fluid through a 50mm mesh to remove hyphal fragments. To induce cleavage, sporangia were placed in 100 mm
glass culture dishes resting on ice (internal temperature 8–10uC) for 60 min. Germinated cysts were obtained by allowing the chilled sporangia to release zoospores, to which CaCl2was added
to 0.5 mM followed by vortexing for 1 minute and incubation at 18uC for up to 9 hr. Gene expression analyses involved RNA blotting andb-glucuronidase (GUS) staining as described [21].
Constructs for testing promoters were based on pNPGUS, which is an improved version of pOGUS [60], and pNIFS-NPGUS. Each contains a promoterless GUS gene and an nptII selectable marker driven by the ham34 promoter. The improve-ments in pNPGUS included the addition of additional cloning sites upstream of GUS (the polylinker from pBS-KS2+) and transla-tional stop codons upstream of the polylinker to reduce the number of cryptic transcripts with GUS activity. pNIFS-NPGUS contains a 74-nt minimal promoter from the NifS gene of P. infestans[21,61] cloned intoXmaI andEcoRI sites of the polylinker. Promoter fragments were inserted into pNPGUS or pNIFS-NPGUS as fragments amplified by polymerase chain reaction, or by ligating double-stranded oligonucleotides into the XbaI and XmaI sites of the vectors. Oligonucleotides used for cloning are listed in Table S3.
Electrophoretic mobility shift assays (EMSA)
Nuclear protein isolation and EMSA were as described [22], except that heparin agarose was not used for the extractions. EMSA involved mixing 5mg of nuclear protein with 1mg poly dI-dC and 1.6 ng of32P-labeled probe in buffer containing 1 mM dithiothreitol for 15 min at room temperature followed by 30 min on ice, followed by electrophoresis at room temperature on a 4.5% acrylamide gel. For competition assays, protein was incubated with unlabeled DNA for 15 min and then the labeled probe for 30 min on ice. Double-stranded oligonucleotides generated using the sequences in Table S3 were used as probe and cold (unlabeled) competitors. Mutated competitors were altered for the predicted motifs (A«C, G«T), and the nonspecific probe was a random sequence.
Quantitative RT-PCR
qRT-PCR employed DNAse-treated RNA, pooled from two biological replicates, which was reverse-transcribed using oligo-dT with a first-strand synthesis kit from Invitrogen (Carlsbad, CA, USA). Amplifications employed hot-start Taq polymerase with primers targeted to the 39 regions of genes, typically yielding amplicons of 100 to 125 nt, using SYBR Green as a reporter. Reactions were performed in duplicate using the following conditions: one cycle of 95uC for 8 min, and 35 cycles of 95uC for 20 s, 55uC for 20 s, and 72uC for 30 s. Controls lacking reverse transcriptase and melting curves were used to test the data. Results were normalized based on primers for a constitutively expressed gene encoding ribosomal protein S3a, and expression was determined by theDDCT method.
Supporting Information
Figure S1 Distribution of genes with different expression patterns withinP. infestans supercontigs. Color-coding is the same as in Figure 2.
(TIF)
Table S1 Details of promoter motifs. (XLS)
Table S2 Occurrence of motifs in promoters of potential secreted pathogenicity genes.
Table S3 Oligonucleotides employed in this study. (PDF)
Acknowledgments
We thank Tao Jiang, Thomas Girke, Jason Stajich, and Katherine Borkovich for helpful discussions.
Author Contributions
Conceived and designed the experiments: HSJ. Performed the experi-ments: SR MK HSJ. Analyzed the data: SR MK HSJ. Wrote the paper: SR MK HSJ.
References
1. Latijnhouwers M, de Wit PJGM, Govers F (2003) Oomycetes and fungi: similar weaponry to attack plants. Trends Microbiol 11: 462–469.
2. Latchman DS (2008) Eukaryotic Transcription Factors. San Diego: Academic Press.
3. Zhang H, Zhao Q, Liu K, Zhang Z, Wang Y, et al. (2009) MgCRZ1, a transcription factor ofMagnaporthe grisea, controls growth, development and is involved in full virulence. FEMS Microbiol Lett 293: 160–169.
4. Zhang M, Lu J, Tao K, Ye W, Li A, et al. (2012) A myb transcription factor of Phytophthora sojae, regulated by MAP kinase PsSAK1, Is required for zoospore development. Plos One 7: e40246.
5. Schweizer A, Rupp S, Taylor BN, Rollinghoff M, Schroppel K (2000) The TEA/ATTS transcription factor CaTec1p regulates hyphal development and virulence in Candida albicans. Mol Microbiol 38: 435–445.
6. Basse CW, Farfsing JW (2006) Promoters and their regulation inUstilago maydis and other phytopathogenic fungi. FEMS Microbiol Lett 254: 208–216. 7. Struhl K (1987) Promoters, activator proteins, and the mechanism of
transcriptional initiation in yeast. Cell 49: 295–297.
8. Lenhard B, Sandelin A, Carninci P (2012) Metazoan promoters: emerging characteristics and insights into transcriptional regulation. Nat Rev Genet 13: 233–245.
9. Sinha S, Tompa M (2003) YMF: A program for discovery of novel transcription factor binding sites by statistical overrepresentation. Nucleic Acids Res 31: 3586–3588.
10. Liu X, Brutlag DL, Liu JS (2001) BioProspector: discovering conserved DNA motifs in upstream regulatory regions of co-expressed genes. Pac Symp Biocomput 6: 127–138.
11. Tompa M, Li N, Bailey TL, Church GM, De Moor B, et al. (2005) Assessing computational tools for the discovery of transcription factor binding sites. Nat Biotechnol 23: 137–144.
12. Bailey TL, Bode´n M, Buske FA, Frith M, Grant CE, et al. (2009) MEME SUITE: tools for motif discovery and searching. Nucleic Acids Res 37: W202– W208.
13. Janky R, van Helden J (2008) Evaluation of phylogenetic footprint discovery for predicting bacterial cis-regulatory elements and revealing their evolution. BMC Bioinform 9: 37.
14. Down TA, Bergman CM, Su J, Hubbard TJ (2007) Large-scale discovery of promoter motifs inDrosophila melanogaster.PLoS Comput Biol 3: e7.
15. Zhao G, Ihuegbu N, Lee M, Schriefer L, Wang T, et al. (2012) Conserved Motifs and Prediction of Regulatory Modules inCaenorhabditis elegans.G3 2: 469– 481.
16. Xie X, Lu J, Kulbokas EJ, Golub TR, Mootha V, et al. (2005) Systematic discovery of regulatory motifs in human promoters and 39UTRs by comparison of several mammals. Nature 434: 338–345.
17. Hughes JD, Estep PW, Tavazoie S, Church GM (2000) Computational identification of cis-regulatory elements associated with groups of functionally related genes inSaccharomyces cerevisiae.J Mol Biol 296: 1205–1214.
18. Haas BJ, Kamoun S, Zody MC, Jiang RH, Handsaker RE, et al. (2009) Genome sequence and analysis of the Irish potato famine pathogenPhytophthora infestans. Nature 461: 393–398.
19. Judelson HS, Blanco FA (2005) The spores ofPhytophthora:weapons of the plant destroyer. Nat Microbiol Rev 3: 47–58.
20. Tani S, Judelson HS (2006) Activation of zoosporogenesis-specific genes in Phytophthora infestansinvolves a 7-nucleotide promoter motif and cold-induced membrane rigidity. Eukaryot Cell 5: 745–752.
21. Ah Fong A, XIang Q, Judelson HS (2007) Architecture of the sporulation-specific Cdc14 promoter from the oomycetePhytophthora infestans. Eukaryot Cell 6: 2222–2230.
22. Xiang Q, Kim KS, Roy S, Judelson HS (2009) A motif within a complex promoter from the oomycetePhytophthora infestansdetermines transcription during an intermediate stage of sporulation. Fungal Genet Biol 46: 400– 409.
23. Judelson HS, Ah-Fong AM, Aux G, Avrova AO, Bruce C, et al. (2008) Gene expression profiling during asexual development of the late blight pathogen Phytophthora infestansreveals a highly dynamic transcriptome. Mol Plant Microbe Interact 21: 433–447.
24. Win J, Kanneganti T-D, Torto-Alalibo T, Kamoun S (2006) Computational and comparative analyses of 150 near full-length cDNA sequences from the oomycete plant pathogenPhytophthora infestans. Fungal Genet Biol 43: 20–33. 25. Kristiansson E, Thorsen M, Tamas MJ, Nerman O (2009) Evolutionary forces
act on promoter length: identification of enriched cis-regulatory elements. Molec Biol Evol 26: 1299–1307.
26. Zhan S, Horrocks J, Lukens LN (2006) Islands of co-expressed neighboring genes inArabidopsis thalianasuggest higher-order chromosome domains. Plant J 45: 3347–3357.
27. Chen C, Gentles AJ, Jurka J, Karlin S (2002) Genes, pseudogenes, and Alu sequence organization across human chromosomes 21 and 22. Proc Natl Acad Sci USA 99: 2930–2935.
28. Smale ST, Kadonaga JT (2003) The RNA polymerase II core promoter. Ann Rev Biochem 72: 449–479.
29. Raffaele S, Win J, Cano LM, Kamoun S (2010) Analyses of genome architecture and gene expression reveal novel candidate virulence factors in the secretome of Phytophthora infestans. BMC Genomics 11: 637.
30. Das MK, Dai HK (2007) A survey of DNA motif finding algorithms. BMC Bioinformatics 8 Suppl 7: S21.
31. Bellora N, Farre D, Alba MM (2007) Positional bias of general and tissue-specific regulatory motifs in mouse gene promoters. BMC Genomics 8: 459. 32. Elemento O, Slonim N, Tavazoie S (2007) A universal framework for regulatory
element discovery across all genomes and data types. Molec Cell 28: 337–350. 33. McLeod A, Smart CD, Fry WE (2004) Core promoter structure in the oomycete
Phytophthora infestans. Eukaryot Cell 3: 91–99.
34. Chuzhanova N, Krawczak M, Nemytikova LA, Gusev VD, Cooper DN (2000) Promoter shuffling has occurred during the evolution of the vertebrate growth hormone gene. Gene 22: 9–18.
35. Moses AM, Pollard DA, Nix DA, Iyer VN, Li XY, et al. (2006) Large-scale turnover of functional transcription factor binding sites in Drosophila. PLoS Comput Biol 2: e130.
36. Stassen J, Van den Ackerveken G (2011) How do oomycete effectors interfere with plant life? Current Opin Plant Biol 14: 407–414.
37. Jiang RH, Tyler BM (2012) Mechanisms and evolution of virulence in oomycetes. Ann Rev Phytopathol 50: 295–318.
38. Wang Q, Han C, Ferreira AO, Yu X, Ye W, et al. (2011) Transcriptional programming and functional interactions within thePhytophthora sojaeRXLR effector repertoire. Plant Cell 23: 2064–2086.
39. Wasserman WW, Sandelin A (2004) Applied bioinformatics for the identification of regulatory elements. Nat Rev Genet 5: 276–287.
40. Schrettl M, Kim HS, Eisendle M, Kragl C, Nierman WC, et al. (2008) SreA-mediated iron regulation inAspergillus fumigatus. Mol Microbiol 70: 27–43. 41. Ihmels J, Bergmann S, Berman J, Barkai N (2005) Comparative gene expression
analysis by differential clustering approach: application to theCandida albicans transcription program. PLoS Genet 1: e39.
42. Judelson HS, Tyler BM, Michelmore RW (1991) Transformation of the oomycete pathogen,Phytophthora infestans. Molec Plant Microbe Inter 4: 602–607. 43. Adl SM, Simpson AG, Farmer MA, Andersen RA, Anderson OR, et al. (2005) The new higher level classification of eukaryotes with emphasis on the taxonomy of protists. J Eukaryot Microbiol 52: 399–451.
44. Chen WH, Wei W, Lercher MJ (2011) Minimal regulatory spaces in yeast genomes. BMC Genomics 12: 320.
45. Woo YH, Li WH (2011) Gene clustering pattern, promoter architecture, and gene expression stability in eukaryotic genomes. Proc Natl Acad Sci USA 108: 3306–3311.
46. Fukuoka Y, Inaoka H, Kohane IS (2004) Inter-species differences of co-expression of neighboring genes in eukaryotic genomes. BMC Genomics 5: 4. 47. Rayko E, Maumus F, Maheswari U, Jabbari K, Bowler C (2010) Transcription
factor families inferred from genome sequences of photosynthetic stramenopiles. New Phytol 188: 52–66.
48. Remenyi A, Scholer HR, Wilmanns M (2004) Combinatorial control of gene expression. Nat Struct Mol Biol 11: 812–815.
49. Lindlof A, Brautigam M, Chawade A, Olsson O, Olsson B (2009) In silico analysis of promoter regions from cold-induced genes in rice (Oryza sativaL.) and Arabidopsis thaliana reveals the importance of combinatorial control. Bioinfor-matics 25: 1345–1348.
50. Judelson HS, Dudler R, Pieterse CMJ, Unkles SE, Michelmore RW (1993) Expression and antisense inhibition of transgenes in Phytophthora infestansis modulated by choice of promoter and position effects. Gene 133: 63–69. 51. Blair JE, Coffey MD, Park SY, Geiser DM, Kang S (2008) A multi-locus
phylogeny for Phytophthorautilizing markers derived from complete genome sequences. Fungal Genet Biol 45: 266–277.
52. Ozcan S, Leong T, Johnston M (1996) Rgt1p ofSaccharomyces cerevisiae, a key regulator of glucose-induced genes, is both an activator and a repressor of transcription. Molec Cell Biol 16: 6419–6426.
54. Yuan Y, Guo L, Shen L, Liu JS (2007) Predicting gene expression from sequence: a reexamination. PLoS Comput Biol 3: e243.
55. Maltese CE, Conigliaro G, Shaw DS (1995) The development of sporangia of Phytophthora infestans. Mycol Res 99: 1175–1181.
56. Hardham AR, Hyde GJ (1997) Asexual sporulation in the oomycetes. Adv Botan Res 24: 353–398.
57. MacIsaac KD, Wang T, Gordon DB, Gifford DK, Stormo GD, et al. (2006) An improved map of conserved regulatory sites forSaccharomyces cerevisiae.BMC Bioinformatics 7: 113.
58. Thompson JD, Higgins DG, Gibson TJ (1994) CLUSTAL W: Improving the sensitivity of progressive multiple sequence alignment through sequence
weighting, position-specific gap penalties and weight matrix choice. Nucleic Acid Res 22: 4673–4680.
59. Morgenstern B (2004) DIALIGN: multiple DNA and protein sequence alignment at BiBiServ. Nucleic Acid Res 32: 33–36.
60. Cvitanich C, Judelson HS (2003) A gene expressed during sexual and asexual sporulation inPhytophthora infestansis a member of the Puf family of translational regulators. Eukaryot Cell 2: 465–473.