www.ocean-sci.net/12/1003/2016/ doi:10.5194/os-12-1003-2016
© Author(s) 2016. CC Attribution 3.0 License.
Impact of vertical and horizontal advection on nutrient
distribution in the southeast Pacific
Bàrbara Barceló-Llull1, Evan Mason2, Arthur Capet3, and Ananda Pascual2
1Universidad de Las Palmas de Gran Canaria, ULPGC, Las Palmas de Gran Canaria, Spain 2Institut Mediterrani d’Estudis Avançats, IMEDEA (CSIC-UIB), Mallorca, Spain
3CNR, OGS, Trieste, Italy
Correspondence to:Bàrbara Barceló-Llull ([email protected]) Received: 13 July 2015 – Published in Ocean Sci. Discuss.: 29 September 2015 Revised: 18 July 2016 – Accepted: 8 August 2016 – Published: 25 August 2016
Abstract.An innovative approach is used to analyze the im-pact of vertical velocities associated with quasi-geostrophic (QG) dynamics on the redistribution and uptake of nitrate in the southeast Pacific (SEP). A total of 12 years of verti-cal and horizontal currents are derived from an observation-based estimate of the ocean state. Horizontal velocities are obtained through the application of thermal wind balance to weekly temperature and salinity fields. Vertical veloci-ties are estimated by integration of the QG omega equation. Seasonal variability of the synthetic vertical velocity and ki-netic energy associated with the horizontal currents is coin-cident, with peaks in austral summer (November–December) in accord with published observations. The impact of verti-cal velocity on SEP nitrate uptake rates is assessed by using two Lagrangian particle tracking experiments that differ ac-cording to vertical forcing (ω=ωQGvs.ω=0). From iden-tical initial distributions of nitrate-tagged particles, the La-grangian results show that vertical motions induce local in-creases in nitrate uptake reaching up to 30 %. Such inin-creases occur in low uptake regions with high mesoscale activity. De-spite being weaker than horizontal currents by a factor of up to 10−4, vertical velocity associated with mesoscale activity is demonstrated to make an important contribution to nitrate uptake, hence productivity, in low uptake regions.
1 Introduction
Mesoscale dynamics make an important contribution to bio-geochemical cycles through the redistribution of nutrients and passive marine organisms by both horizontal advection and vertical exchange. Vertical motion plays a key role in the exchange of heat, salt and biogeochemical tracers between the surface and deep ocean. In coastal upwellings, frontal ar-eas and mesoscale eddies, the vertical velocity has funda-mental importance and can significantly contribute to nutri-ent supply in the euphotic zone (Mahadevan, 2014).
Previous remote sensing studies (Chelton et al., 2011a) have revealed that chlorophyll a distributions within mesoscale eddies are characterized by dipole-like patterns, with extreme values found at the eddy peripheries. Chel-ton et al. (2011a) proposed that eddy horizontal advection could explain these distributions. On the other hand, the im-portance of vertical exchange for phytoplankton growth and chlorophylla distributions in mesoscale oceanic eddies has been attributed to various mechanisms such as eddy pump-ing, eddy-induced Ekman pumping or vortex Rossby waves (McGillicuddy et al., 1998; Siegel et al., 1999; Mahadevan et al., 2012; Martin and Richards, 2001; McGillicuddy et al., 2007; Benítez-Barrios et al., 2011; Buongiorno Nardelli, 2013; Gaube et al., 2013, 2015).
ve-data (temperature and salinity) in the form of discrete vertical profiles over a global, but sparse, grid. The ARMOR3D esti-mate of the ocean state (Guinehut et al., 2012) is an innova-tive product where remote sensing observations (sea surface temperature and sea level anomalies) are merged with in situ Argo temperature and salinity profiles. The resulting mul-tivariate observation-based data set is freely available (see Section 3).
The southeast Pacific has a variety of different trophic regimes (Ras et al., 2008) such as the upwelling zone near the Peru–Chile coast that is rich in nutrients and has high chlorophyll a concentrations, and the area associated with the central part of the South Pacific Gyre, which is the most oligotrophic area in the global ocean (Morel et al., 2010). Mesoscale effects on chlorophyllaproduction can be consid-ered to differ between regions with different dynamical char-acteristics. Lathuiliere et al. (2011) demonstrate that, while mesoscale activity in upwelling regions leads primarily to offshore export of phytoplankton, in the oligotrophic gyres mesoscale processes promote vertical advection of nutrients into the euphotic layer, thereby stimulating primary produc-tion. The present work is focused on the same area ana-lyzed by Chelton et al. (2011a), the offshore southeast Pa-cific (white box in Fig. 1), where nutrient input by mesoscale vertical exchange is considered to play a lead role in primary production (Lathuiliere et al., 2011).
Figure 1 shows the time-averaged eddy kinetic energy (EKE) at the surface computed from daily AVISO (DT14, Capet et al. (2014)) sea level anomalies. The EKE in the South Pacific Gyre has lower values in comparison with more active regions such as the Gulf Stream or Agulhas Current (Pascual et al., 2006; Imawaki et al., 2013). How-ever, this gyre also includes a region with relatively high EKE values corresponding to the midwest South Pacific. Qiu and Chen (2004) and Qiu et al. (2008) attribute the high EKE values found in this region to baroclinic insta-bility of the eastward-flowing surface Subtropical Counter-current (STCC) and the westward-flowing South Equatorial Current (SEC). Although the SEC is a surface current near the equator, it has a subsurface component that Qiu and Chen (2004) observed to as far south as 30◦
S, where it underlies the STCC (see Fig. 3 of Qiu and Chen (2004)). Moreover, they also find that in this region seasonal EKE modulation is related to the seasonal intensification/decay of the STCC– SEC baroclinic instability, with a maximum in November– December. In the same way, the gyre has another region with
interannual EKE variability.
Figure 1 shows high EKE values off the Peru–Chile coast which is characterized by an important coastal upwelling and the consequent generation of mesoscale eddies and filaments (Brown et al., 2008; Brink and Robinson, 2005; Strub et al., 2013). The region of study (white box in Fig. 1) is character-ized by relatively low EKE, with higher EKE values in the southwest corner that are related to the STCC–SEC system and, in the eastern section, to coastal upwelling eddy gener-ation. However, the SEP has important eddy activity due, in part, to eddy formation in the Peru–Chile coastal upwelling (Chelton et al., 2011a) .
A brief description of the synthetic temperature and salin-ity fields and biogeochemical data is given in Sect. 2. Sec-tion 3 describes the methodology used to diagnose the quasi-geostrophic vertical velocity, together with a description of the Lagrangian particle-tracking code utilized for the nitrate uptake simulation. In Sect. 4 the results of the vertical veloc-ity and kinetic energy analysis as well as the results of the Lagrangian simulations are discussed. Section 5 summarizes and concludes the results.
2 Data
We use the ARMOR3D observation-based product which is based on the merging of gridded satellite sea level anomaly (SLA) and sea surface temperature (SST) remote sensing ob-servations with in situ vertical profiles of temperature and salinity to provide a global 3-D data set of temperature and salinity (Guinehut et al., 2012). The data are computed on a 1/3◦
Mercator horizontal grid with weekly temporal reso-lution covering the period 1998–2009, over 24 vertical lev-els from the surface to 1500 m depth. A validation of AR-MOR3D is presented by Mulet et al. (2012) who use a con-sistent data set from a model reanalysis.
Figure 1.Map of the southeast Pacific. Colors show annual mean eddy kinetic energy (EKE) computed from daily AVISO (DT14, Capet et al., 2014) sea level anomaly data for the period 1993–2013. The white box shows the limits of the area of study. Key: SEC, South Equatorial Current; SECC, South Equatorial Countercurrent; STCC, Subtropical Countercurrent; PC, Peru Current. Green dashed line is the coastal upwelling. The small arrow indicates the poleward extent of the subsurface component of the SEC as observed by Qiu and Chen (2004) between 12 and 30◦S at 170◦E.
Figure 2.Climatological January nitrate from WOAPISCES in the southeast Pacific.(a)Horizontal section at 200 m depth,(b)vertical section at 20.5◦S and(c)vertical section at 105.5◦W. Dashed black lines in(b)and(c)indicate the 2 mol L−1isoline. White dots are a random sample of the simulated water parcels at their initial positions.
nitrate values near the Peru–Chile coast are associated with the coastal upwelling. In the zonal section (Fig. 2b) the uplift of the nitracline due to the coastal upwelling off the Peru– Chile coast is evident. In the meridional section (Fig. 2c) ni-trate concentrations increase northward.
Light conditions are used in Sect. 4.2 to assess the relevance of the Lagrangian nitrate transport estimates. Surface photosynthetically active radiation (E0) and at-tenuation coefficient at 490 nm (k) are obtained from the MERIS monthly climatology (http://oceandata.sci.gsfc.nasa. gov/MERIS/Mapped/Monthly_Climatology/9km/par/, http://oceandata.sci.gsfc.nasa.gov/MERIS/Mapped/ Monthly_Climatology/9km/Kd/).
3 Methodology
3.1 Computation of 3-D velocity
Horizontal geostrophic velocities are computed at all depths
zi through the thermal wind equations:
ug(zi)=ug(0)−
g ρf
0 Z
zi
∂ρ
∂ydz (1a)
vg(zi)=vg(0)+
g ρf
0 Z
zi
∂ρ
∂xdz, (1b)
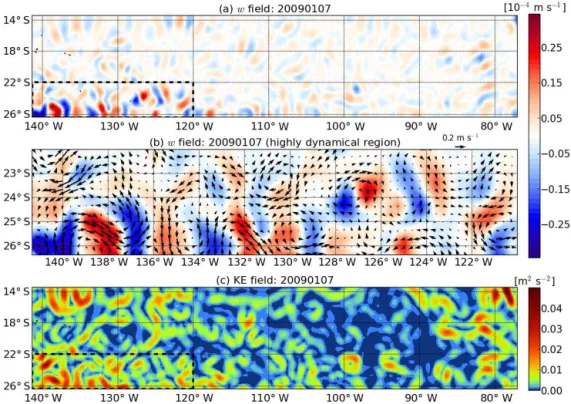
Figure 3. (a)Vertical velocity on 7 January 2009 at 200 m depth. Black box delimits the region of high mesoscale eddy activity.(b)Zoom of vertical velocity and horizontal geostrophic currents over the high mesoscale eddy activity region in(a).(c)Kinetic energy on 7 January 2009 at 200 m depth.
Vertical velocity is estimated using the quasi-geostrophic approximation by integrating the QG omega equation, pre-sented here in itsQvector formulation (Hoskins et al., 1978; Tintoré et al., 1991; Buongiorno Nardelli et al., 2012; Pas-cual et al., 2015):
N2∇2hw+f 2∂2w
∂z2 =2∇·Q, (2a) where
Q= g
ρ0 ∂v
g
∂x ·∇ρ
′,∂vg
∂y ·∇ρ
′
, (2b)
wherevg is the geostrophic velocity vector,ρ′is the depar-ture from the mean density profile, N2 the Brunt–Väisälä frequency and f the Coriolis parameter. In this implemen-tation,N2 only depends on depth. The Rossby number for mesoscale eddies in the SEP is generally less than 0.1 (Chel-ton et al., 2011b), hence we assume QG theory to be a good approximation for computing the vertical velocity in this re-gion.
Following Eq. (2), vertical velocity is estimated from den-sity stratification and the geostrophic velocity field. The computational code is derived following the QG vorticity and thermodynamic equations (Buongiorno Nardelli et al., 2012). Lateral boundaries are placed within the limits 68.4– 141.3◦
W and 13.4–26.4◦
S. Boundary conditions are
con-structed by considering zero vertical velocity at the upper, lower and lateral boundaries.
A sensitivity analysis was carried out in order to evaluate the influence of reference level choice on the vertical velocity estimation. The choice of reference level is influential over the first hundred meters above the bottom due to the imposed boundary condition; away from the bottom the same patterns were seen for different choices of reference level (500 and 1000 m). Testing the 500 m reference level, the vertical ve-locity patterns pointed to a maximum decrease in magnitude of 50 %. Hence, a reference level of 1000 m depth was cho-sen. Dirichlet and Neumann conditions at the lateral bound-aries were tested for which we found no significant impacts on results a few points away from the boundaries.
3.2 Lagrangian simulations
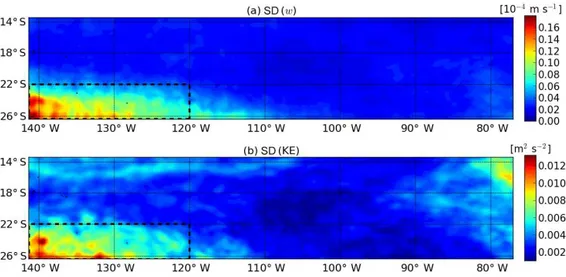
Figure 4. (a)Standard deviation of vertical velocity and(b)kinetic energy over the period 7 January 1998 to 30 December 2009 at 200 m depth. The discontinuous line delimits the region of high mesoscale variability.
geostrophic horizontal velocity was applied but vertical ve-locity was set to zero (UV). A total of 1000 passive floats were released each week over a period of 364 days (initial date 31 December 2008) at random positions within a re-lease area determined by the nitrate depletion depth (Fig. 2). This depth was estimated for each week following Omand and Mahadevan (2015) by selecting the depth at which nitrate content is 2 µmol L−1 from temporally and vertically inter-polated climatological nitrate fields (WOAPISCES). Bound-aries to the north, south and west are open; the eastern bound-ary is closed (see white box in Fig. 1). Float positions were stored every day as output of the Lagrangian simulation.
The initial nitrate concentrations for each float,
N (r(t0), t0) with r(t )=(x(t ), y(t ), z(t )), are interpo-lated in time and space from the monthly WOAPISCES climatology. In this way, the particles in each weekly release are initialized with local nutrient concentrations. The evolution of the nitrate content is then estimated along the Lagrangian tracks by considering an uptake term, U and a remineralization term,R:
∂N
∂t = −U+R (3)
U = U0·
N N+KN
· E
E+KE
(4)
R = max(0,NC−N
r ). (5)
The maximum uptake rate, U0 (µmol L−1d−1), is mod-ulated by two Michaelis–Menten functions represent-ing nitrate and light limitations, respectively (MacIsaac and Dugdale, 1972). The light conditions E(r(t ), t )=
E0((x(t ), y(t ),0), t )·e−k·z(t )are derived along each track by interpolation in time and space from the MERIS monthly climatology of surface Photosynthetically Active Radiation (E0) and attenuation coefficient at 490 nm (k) (Marra et al.,
2014). The values tested for the light half saturation param-eter,KE=0.5, 1 and 5 µE m−2s−1, are taken in the range 1–10 % of the typical surface PAR intensity (MacIsaac and Dugdale, 1972). The half saturation constant for nitrate limi-tation is taken asKN=0.2 µmol L−1which is characteristic for oligotrophic marine regions (Eppley et al., 1969).
Remineralization is represented by a relaxation toward climatological nitrate values whenever the actual float N
content falls below NC, the climatological nitrate field (WOAPISCES). r is a characteristic relaxation timescale (days). We considered the valuesrof 5 and 10 days.
4 Results
4.1 QG vertical velocity and kinetic energy from observation-based product
A comparison between vertical velocity (w) and ki-netic energy (KE) computed from the ARMOR3D-derived geostrophic velocities is carried out in order to evaluate their relationship. An energetic region with high vertical velocities and mesoscale eddy activity is located in the southwest of the SEP, in both the vertical velocity (Fig. 3a) and kinetic energy (Fig. 3c) maps. This high eddy energy is related to baroclinic instabilities associated with the eastward surface STCC and the westward underlying SEC system (Qiu and Chen, 2004; Qiu et al., 2008). Figure 3c shows other regions with elevated mesoscale activity that are associated with less intense verti-cal velocity values. These regions are the coastal upwelling and the SECC–SEC system explained in Sect. 1.
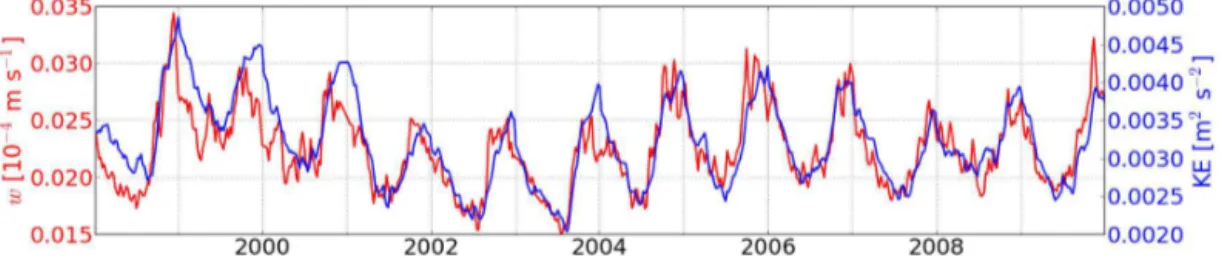
coefficient between vertical velocity and kinetic energy is 0.84.
Figure 6.Nitrate uptake rates considering(a)both QG vertical velocity and geostrophic horizontal velocity (UVW);(b)only geostrophic horizontal velocity (UV);(c)relative increase of nitrate uptake rates when including vertical velocity. These fields were obtained forr=
10 days,U0=0.1 µmol L−1d−1,KE=1 µE m−2s−1andKN=0.2 µmol L−1.
downwelling cells at the eddy peripheries (e.g., 126–128◦
W and 23–25◦
S). Vertical velocity around anticyclonic mean-ders (e.g., 136–139◦
W and 24–26◦
S or 120–122◦
W and 24–26◦
S) shows the expected upwellings in the upstream and downwellings in the downstream portions of the mean-der crests (Woods, 1988; Bower, 1991; Pollard and Regier, 1992; Pascual et al., 2015). Similarly, downwellings and up-wellings in cyclonic meanders (e.g., 137–140◦
W and 24.5– 26◦
S) are located upstream and downstream of the crest, re-spectively.
In order to analyze the variability ofw, the standard devi-ation over the period 7 January 1998 to 30 December 2009 is computed and shown in Fig. 4a; Fig. 4b shows the
stan-dard deviation of the KE. The active region in the southwest of the SEP presents high temporal variability in both fields. The correlation coefficient between both fields in this region reaches 0.85. Considering the whole area of study, the corre-lation coefficient is 0.79. It should be noted that this high cor-relation between the two variables could not be anticipated a priori as the relationship is not linear (see Eq. 2).
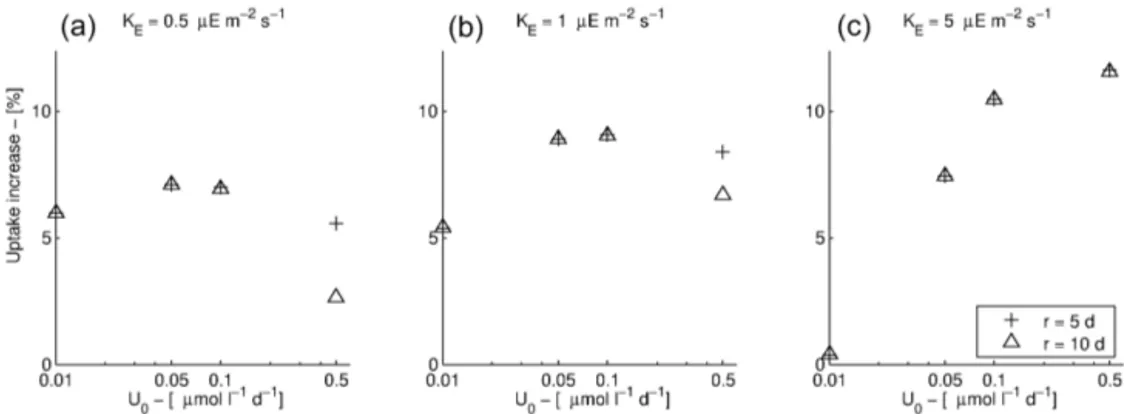
Figure 7.Average increase of nitrate uptake rates in the region of high mesoscale eddy activity (ca. 120–140◦W and 22–26◦S) for different values of the uptake coefficientU0and relaxation timescaler.
baroclinic instability (Qiu et al., 2008). Interannual variabil-ity and weak variabilvariabil-ity of high frequency are also shown in these figures. When averaging over only the highly energetic region in the southwest (not shown) the tendency is similar but the magnitude is double.
4.2 Lagrangian simulations
In order to evaluate the potential biological impacts of the vertical velocities, we analyzed the nitrate uptake rates along the Lagrangian tracks resulting from successive weekly parti-cle releases within the nitrate depletion depth (see Sect. 3.2). To compare nitrate uptake rates in the simulations with (UVW) and without (UV) vertical motions, we computed the median of the nitrate uptake terms in bins of 0.5◦×
0.5◦
over the full annual simulations. The deeper particle tracks, for which uptake terms were lower than 0.001 (µmol L−1d−1), were disregarded in these computations. As expected, nitrate uptake rates (Fig. 6) are higher in the northeastern upwelling region. Intermediate uptake values can also be seen in the region of high mesoscale activity (ca. 120–140◦W and 22–
26◦S). While the restricted resolved vertical velocities leave
the overall pattern of nitrate uptake unchanged, local nitrate uptake increases reach up to 30 % in the region characterized by low uptake rates and high mesoscale activity (Fig. 6c).
The simplified nutrient model considered here is not suit-able for a detailed study of the dynamics of nitrate, in par-ticular as it does not consider planktonic biomass and diver-sity. However, we tested the sensitivity of the results to the
U0,r andKE parameters. In Fig. 7 we show that spatially averaged increases in uptake rates over the region of high mesoscale activity vary between 0.4 and 11.6 %, with an av-erage of 6.5 % for the considered range of parameter values. Larger increases are observed in the cases with high maxi-mum uptake rates and strong light limitation.
5 Discussion and Conclusions
This paper analyses vertical velocities associated with QG dynamics as derived through an innovative approach that uses the ARMOR3D global observation-based product. Weekly horizontal geostrophic velocity and QG vertical ve-locity are computed from ARMOR3D temperature and salin-ity in the southeast Pacific. We analyze the QG vertical veloc-ity in order to understand its distribution. The southwest of the SEP has relatively high mesoscale activity with vertical velocities exceeding 2 m d−1, which is on the order of 10−4 times the horizontal velocity. Vertical velocity and kinetic en-ergy in the SEP have similar and intense seasonal variability with maximums in austral summer (November–December), which suggests that these quantities are mostly influenced by the seasonal modulation of STCC–SEC vertical shear (Qiu and Chen, 2004; Qiu et al., 2008).
pri-motions on nutrient redistribution. The wide-swath SWOT altimeter will allow unique observations in the 15–100 km range of wavelength scales when it comes online in the next decade (Fu and Ferrari, 2008).
6 Data availability
Data and codes are available from the first author upon re-quest.
Acknowledgements. This work has been carried out as part of the
E-MOTION (CTM2012-31014) project funded by the Spanish National Research Program. Additional funding from the local government of the Balearic Islands (CAIB-51/2011 grant) is also acknowledged. Bàrbara Barceló-Llull is supported by a doctoral grant from the Spanish National Research Program associated with the PUMP (CTM2012-33355) project. Evan Mason is supported by a post-doctoral grant from the Conselleria d’Educació, Cultura i Universitats del Govern de les Illes Balears (Mallorca, Spain) and the European Social Fund. Arthur Capet is funded by the European Union under FP7- People-Co-funding of Regional, National and International Programmes, GA no. 600407. The ARMOR3D data set was produced by CLS with support from the MyOcean project (EU no. P7-SPACE-2007-1 grant agreement 218812). Nitrate data were extracted from the WOAPISCES biogeochemical climatology (http://www.romsagrif.org/).
Edited by: M. Hecht
Reviewed by: P. Gaube and X. Capet
References
Benítez-Barrios, V., Pelegrí, J. L., Hernández-Guerra, A., Lwiza, K. M. M., Gomis, D., Vélez-Belchí, P., and Hernández-León, S.: Three-dimensional circulation in the NW Africa coastal transi-tion zone, Prog. Oceanogr., 91, 516–533, 2011.
Bower, A. S.: A simple kinematic mechanism for mixing fluid parcels across a meandering jet, J. Phys. Oceanogr., 21, 173–180, 1991.
Brink, K. H. and Robinson, A. R. (EDS.): The Sea, Volume 11: The Global Coastal Ocean: Regional Studies and Syntheses, Harvard University Press, 2005.
Brown, S. L., Landry, M. R., Selph, K. E., Jin Yang, E., Rii, Y. M., and Bidigare, R. R.: Diatoms in the desert: Plankton community response to a mesoscale eddy in the subtropical North Pacific, Deep-Sea Res., 55, 1321–1333, 2008.
Eastern Boundary Upwelling Systems, Geophys. Res. Lett., 41, 7602–7610, 2014.
Capet, X. J., Campos, E. J., and Paiva, A. M.: Submesoscale activ-ity over the Argentinian shelf, Geophys. Res. Lett., 35, L15605, doi:10.1029/2008GL034736, 2008.
Carr, S. D., Capet, X. J., McWilliams, J. C., Pennington, J. T., and Chavez, F. P.: The influence of diel vertical migration on zooplankton transport and recruitment in an upwelling re-gion: estimates from a coupled behavioral-physical model, Fish. Oceanogr., 17, 1–15, 2008.
Chelton, D. B., Gaube, P., Schlax, M. G., Early, J. J., and Samelson, R. M.: The Influence of Nonlinear Mesoscale Eddies on Near-Surface Oceanic Chlorophyll, Science, 334, 328–332, 2011a. Chelton, D. B., Schlax, M. A., and Samelson, R. M.: Global
ob-servations of nonlinear mesoscale eddies, Prog. Oceanogr., 91, 167–216, 2011b.
Dibarboure, G., Pujol, M.-I. ., Briol, F., Le Traon, P.-Y., Larnicol, G., Picot, N., Mertz, F., and Ablain, M.: Jason-2 in DUACS: Up-dated system description, first tandem results and impact on pro-cessing and products, Mar. Geod., 34, 214–241, 2011.
Ducet, N., Le Traon, P.-Y., and Reverdin, G.: Global high-resolution mapping of ocean circulation from TOPEX/Poseidon and ERS-1 and -2, J. Geophys. Res., 105, 19477–19498, 2000.
Eppley, R. W., Rogers, J. N., and McCarthy, J. J.: Half-saturation constants for uptake of nitrate and ammonium by marine phyto-plankton, Limnol. Oceanogr., 14, 912–920, 1969.
Fu, L.-L. and Ferrari, R.: Observing Oceanic Submesoscale Pro-cesses From Space, Eos Trans. AGU, 89, 488–488, 2008. Gaube, P., Chelton, D. B., Strutton, P. G., and Behrenfeld, M. J.:
Satellite observations of chlorophyll, phytoplankton biomass, and Ekman pumping in nonlinear mesoscale eddies, J. Geophys. Res., 118, 6349–6370, 2013.
Gaube, P., Chelton, D. B., Samelson, R. M., Schlax, M. G., and O’neill, L. W.: Satellite Observations of Mesoscale Eddy-Induced Ekman Pumping, J. Phys. Oceanogr., 45, 104–132, 2015.
Guinehut, S., Dhomps, A.-L., Larnicol, G., and Le Traon, P.-Y.: High resolution 3-D temperature and salinity fields derived from in situ and satellite observations, Ocean Sci., 8, 845–857, doi:10.5194/os-8-845-2012, 2012.
Hoskins, B. J., Draghici, I., and Davies, H. C.: A new look at the ω-equation, Q. J. R. Met. Soc., 104, 31–38, 1978.
Klein, P. and Lapeyre, G.: The Oceanic Vertical Pump Induced by Mesoscale and Submesoscale Turbulence, Annu. Rev. Mar. Sci., 1, 351–375, 2009.
Lathuiliere, C., Levy, M., and Echevin, V.: Impact of eddy-driven vertical fluxes on phytoplankton abundance in the euphotic layer, J. Plank. Res., 33, 827–831, 2011.
MacIsaac, J. and Dugdale, R.: Interactions of light and inorganic nitrogen in controlling nitrogen uptake in the sea, Deep-Sea Res.-Oceanogr. Abstracts, Elsevier, 19, 209–232, 1972.
Mahadevan, A.: Eddy effects on biogeochemistry, Nature, 506, 168–169, 2014.
Mahadevan, A., D’Asaro, E., Lee, C., and Perry, M. J.: Eddy-driven stratification initiates North Atlantic spring phytoplankton blooms, Science, 336, 54–58, 2012.
Marra, J. F., Lance, V. P., Vaillancourt, R. D., and Hargreaves, B. R.: Resolving the ocean’s euphotic zone, Deep-Sea Res. Pt. I, 83, 45–50, 2014.
Martin, A. P. and Richards, K. J.: Mechanisms for vertical nutrient transport within a North Atlantic mesoscale eddy, Deep-Sea Res. Pt. II, 48, 757–773, 2001.
Mason, E., Colas, F., and Pelegrí, J. L.: A Lagrangian study tracing water parcel origins in the Canary Upwelling System, Sci. Mar., 76, 79–94, 2012.
McGillicuddy, D. J., Robinson, A. R., Siegel, D. A., Jannasch, H. W., Johnson, R., Dickey, T. D., McNeil, J., Michaels, A. F., and Knap, A. H.: Influence of mesoscale eddies on new produc-tion in the Sargasso Sea, Nature, 394, 263–266, 1998.
McGillicuddy, D. J., Anderson, L. A., Bates, N. R., Bibby, T., Bues-seler, K. O., Carlson, C. A., Davis, C. S., Ewart, C., Falkowski, P. G., Goldthwait, S. A., Hansell, D. A., Jenkins, W. J., Johnson, R., Kosnyrev, V. K., Ledwell, J. R., Li, Q. P., Siegel, D. A., and Steinberg, D. K.: Eddy Wind interactions stimulate extraordinary mid-ocean plankton blooms, Science, 316, 1021–1026, 2007. Morel, A., Claustre, H., and Gentili, B.: The most oligotrophic
sub-tropical zones of the global ocean: similarities and differences in terms of chlorophyll and yellow substance, Biogeosciences, 7, 3139–3151, doi:10.5194/bg-7-3139-2010, 2010.
Mulet, S., Rio, M.-H., Mignot, A., Guinehut, S., and Morrow, R.: A new estimate of the global 3D geostrophic ocean circulation based on satellite data and in-situ measurements, Deep-Sea Res. Pt. II, 77-80, 70–81, 2012.
Omand, M. M. and Mahadevan, A.: The shape of the oceanic nitra-cline, Biogeosciences, 12, 3273–3287, doi:10.5194/bg-12-3273-2015, 2015.
Pascual, A., Faugère, Y., Larnicol, G., and Le Traon, P.-Y.: Im-proved description of the ocean mesoscale variability by com-bining four satellite altimeters, Geophys. Res. Lett., 33, L02611, doi:10.1029/2005GL024633, 2006.
Pascual, A., Ruiz, S., Buongiorno Nardelli, B., Guinehut, S., Iu-dicone, D., and Tintoré, J.: Net primary production in the Gulf Stream sustained by quasi-geostrophic vertical exchanges, Geo-phys. Res. Lett., 42, 441–449, 2015.
Penven, P., Marchesiello, P., Debreu, L., and Lefèvre, J.: Software tools for pre- and post-processing of oceanic regional simula-tions, Environ. Modell. Softw., 23, 660–662, 2008.
Pollard, R. T. and Regier, L. A.: Vorticity and Vertical Circulation at an Ocean Front, J. Phys. Oceanogr., 22, 609–625, 1992. Qiu, B. and Chen, S.: Seasonal modulations in the Eddy Field of the
South Pacific Ocean, J. Phys. Oceanogr., 34, 1515–1527, 2004. Qiu, B., Scott, R. B., and Chen, S.: Length Scales of Eddy
Gen-eration and Nonlinear Evolution of the Seasonally Modulated South Pacific Subtropical Countercurrent, J. Phys. Oceanogr., 38, 1515–1528, 2008.
Ras, J., Claustre, H., and Uitz, J.: Spatial variability of phytoplank-ton pigment distributions in the Subtropical South Pacific Ocean: comparison between in situ and predicted data, Biogeosciences, 5, 353–369, doi:10.5194/bg-5-353-2008, 2008.
Siegel, D. A., McGillicuddy Jr., D. J., and Fields, E. A.: Mesoscale eddies, satellite altimetry, and new production in the Sargasso Sea, J. Geophys. Res.-Ocean., 104, 13359–13379, 1999. Strub, P. T., Combes, V., Shillington, F. A., and Pizarro, O.:
Cur-rents and Processes along the Eastern Boundaries, chap. 14, in: Ocean Circulation and Climate A – 21st Century Perspective, edited by: Siedler, G., Griffies, S. M., Gould, J., and Church, J. A., Academic Press, 103, 339–384, 2013.
Tintoré, J., Gomis, D., Alonso, S., and Parrilla, G.: Mesoscale Dynamics and Vertical Motion in the Alborán Sea, J. Phys. Oceanogr., 21, 811–823, 1991.