Nucleotide Diversity Analysis of Three Major
Bacterial Blight Resistance Genes in Rice
Waikhom Bimolata1, Anirudh Kumar1, Sai Kiran Reddy M1, Raman Meenakshi Sundaram2, Gouri Sankar Laha3, Insaf Ahmed Qureshi4, Irfan Ahmad Ghazi1*
1Department of Plant Sciences, School of Life Sciences, University of Hyderabad, Prof. C. R. Rao Road, Gachibowli, Hyderabad, 500046, India,2Crop Improvement Section, Directorate of Rice Research, Rajendranagar, Hyderabad, 500030, India,3Crop Protection Section, Directorate of Rice Research, Rajendranagar, Hyderabad, 500030, India,4Department of Biotechnology and Bioinformatics, School of Life Sciences, University of Hyderabad, Prof. C. R. Rao Road, Gachibowli, Hyderabad, 500046, India
Abstract
Nucleotide sequence polymorphisms amongRgene alleles influence the process of co-evolutionary interaction between host and pathogen by shaping the response of host plants towards invading pathogens. Here, we present the DNA sequence polymorphisms and di-versities present among natural alleles of three rice bacterial blight resistance genes,Xa21, Xa26andxa5. The diversity was examined across different wild relatives and cultivars of Oryzaspecies. Functional significance of selected alleles was evaluated through semi-quantitative reverse transcription polymerase chain reaction and real time PCR. The great-est nucleotide diversity and singleton variable sites (SVS) were present inXa26(π= 0.01958; SVS = 182) followed byxa5andXa21alleles. The highest frequency of single nu-cleotide polymorphisms were observed inXa21alleles and least inxa5. Transition bias was observed in all the genes and‘G’to‘A’transitions were more favored than other form of tran-sitions. Neutrality tests failed to show the presence of selection at these loci, though nega-tive Tajima’s D values indicate the presence of a rare form of polymorphisms. At the interspecies level,O.nivaraexhibited more diversity thanO.sativa. We have also identified two nearly identical resistant alleles ofxa5and two sequentially identical alleles ofXa21. The alleles ofxa5showed basal levels of expression whileXa21alleles were functionally not expressed.
Introduction
Plants are constantly exposed to various biotic stresses like insect pests and pathogens and have evolved several mechanisms to guard themselves these stresses. As pathogens challenge the fitness of the plant, they are regarded as natural selective agents shaping evolutionary dy-namics of host-pathogen co-evolution [1,2]. In crops like rice, infections by pathogens influ-ence yield, morphology, grain quality and texture [3]. Bacterial blight (BB) is a major disease of rice caused byXanthomonas oryzaepv.oryzae. The annual yield loss by this disease is recorded
OPEN ACCESS
Citation:Bimolata W, Kumar A, M SKR, Sundaram RM, Laha GS, Qureshi IA, et al. (2015) Nucleotide Diversity Analysis of Three Major Bacterial Blight Resistance Genes in Rice. PLoS ONE 10(3): e0120186. doi:10.1371/journal.pone.0120186
Academic Editor:Jauhar Ali, International Rice Research Institute, PHILIPPINES
Received:August 21, 2014
Accepted:January 23, 2015
Published:March 25, 2015
Copyright:© 2015 Bimolata et al. This is an open access article distributed under the terms of the
Creative Commons Attribution License, which permits unrestricted use, distribution, and reproduction in any medium, provided the original author and source are credited.
Data Availability Statement:All relevant data are within the paper and its Supporting Information files.
Funding:This research work is supported by grants from Department of Science & Technology, New Delhi, India (grant no. SR/SO/PS-21/09). WB is also grateful to CSIR for the fellowship (award no. 09/414/ (0832)/2008- EMR-I). The funders had no role in study design, data collection and analysis, decision to publish, or preparation of the manuscript.
up to 20–50% [4–6]. At the phenotypic level, symptomatic variations in natural rice popula-tions are generally observed after pathogen infection. This variation may be correlated to the genetic diversity in host plants. Bacterial blight is prevalent and widespread in most of the rice cultivating countries of South and South East Asia including India. For combating the disease, the most effective and economical measure is exploitation of host plant resistance. To date, more than 38Rgenes for BB resistance have been reported [7,8]. Diversity analysis of these genes in natural population will facilitate identification of allelic variations which can be ex-ploited in resistance breeding programs [9]. Natural diversity is an important asset for func-tional genomics studies and crop improvement. Abundant genetic resources available in nature give us an opportunity to explore and discover new forms of resistance genes.
Study of the evolutionary dynamics of disease resistance genes began twenty years ago, using Arabidopsis and tomato as model plants. Recently, various reports on molecular evolu-tion and genetic diversity of blast resistance genes for blast disease caused byMagnaporthe gri-saeare available; however similar studies for bacterial blight resistance genes are limited [10–
13]. Among different factors, pathogens play an important role as a selective agent in the evolu-tion ofRgenes. Host and pathogen co-evolve, resulting in continuance of allelic disparity ofR
genes through balanced selection [14]. Sequence polymorphism in naturally occurring alleles may alter the gene expression profile and functional characteristics of proteins leading to phe-notypic variations of a trait [15,16]. Recent studies conclude that nucleotide changes in the non-coding and regulatory sites ofRgenes also contribute to resistance or susceptibility pheno-types of a disease in addition to nucleotide variations in the coding region [17,18].
In this study, we present the analysis of natural polymorphism with respect to three major bacterial blight resistance genes:Xa21,Xa26andxa5, at the sequence level in a set of rice germ-plasm.Xa21is a broad spectrum bacterial blight resistance gene, originally derived from a wild riceO.longistaminataand introgressed into cultivated rice [19]. Song et al. [20] reported the cloning of this gene which encodes a LRR threonine rich receptor like kinase domain contain-ing protein.Xa26is a dominantRgene, which provides resistance against Chinese, Japanese
and KoreanXoostrains. BothXa21andXa26genes had been mapped on the long arm of
Chromosome 11 of rice. The presence ofXa26in rice was first reported in ChineseO.sativa
cultivar Minghui 63. Plants with this gene exhibited broad resistance both at seedling and adult stages.Xa26also encodes a LRR receptor kinase-type protein [21]. BothXa26andXa3have been shown to be the same gene [22] and is an important gene in the breeding of japonica culti-vars with BB resistance in China [23].xa5is a recessive gene, which confers race specific blight resistance against PhilippinesXoorace 1 (PXO86). Thexa5gene is a mutant form of rice tran-scription factor OsTFIIAγ5 (Xa5) where there is a substitution variant of a single amino acid: V39E [24].xa5codes for 106 amino acids and both the dominant and recessive genes are con-stitutively expressed in different tissues of the plant [25]. The predicted 3-D structure of xa5 protein after its superimposition withXa5and TFIIA shows that due to the substitution of V39E, a minor variation occurs in the third helix domain of xa5 protein [25].
Previously, we reported the nucleotide diversity analysis ofXa27[13]. The present study was designed to analyze the molecular evolution and nucleotide sequence diversity existing among naturally occurring alleles of rice bacterial blight resistance genesXa21,Xa26andxa5. The objectives of this study were to (i) determine the DNA polymorphism level ofXa21,Xa26
Materials and Methods
Plant material, screening and DNA isolation
In our previous study, we reported screening of wild and cultivated rice accessions for resis-tance against set of five IndianXooisolates DX011, DX133, DX020, DX015 and DX127 [13]. Based on this, we isolated alleles ofXa26,Xa21andxa5genes from rice accessions mentioned inTable 1. Plants were inoculated following Kauffman et al. [26]. Rice plants at booting stage were inoculated with suspension ofXooculture at the concentration of 0.1–0.2 OD (1x10⁸–1x 10⁹CFU/ml) by leaf clipping method. Three plants (five leaves per plant) were used to inocu-late for each isoinocu-late. Sterile water was used in place of bacterial suspension for the control plants. Disease spectrum was evaluated after 15 days of inoculation by measuring the lesion lengths and calculating the relative lesion length (RLL), that is the ratios of lesion length to leaf length (RLL). Disease scoring was performed by following Standard Evaluation System for Rice (SES scale) [27]. Genomic DNA was isolated from fresh tender leaves of rice plants following
CTAB method [28]. The required chemicals were procured from Sigma Aldrich (USA).
Isolation and sequencing of alleles
Gene specific primers were designed forXa21(U37133.1) [20],Xa26(DQ426646.1, cultivar Zhachanglong) [22], andxa5(Os05g0107700). The entire coding and non-coding region of
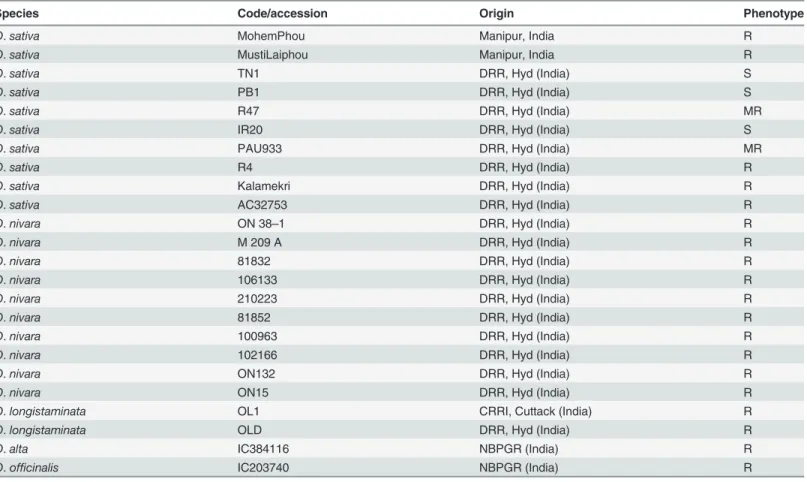
Table 1. List of rice accessions used for isolation and nucleotide diversity analysis of alleles.
Species Code/accession Origin Phenotype
O.sativa MohemPhou Manipur, India R
O.sativa MustiLaiphou Manipur, India R
O.sativa TN1 DRR, Hyd (India) S
O.sativa PB1 DRR, Hyd (India) S
O.sativa R47 DRR, Hyd (India) MR
O.sativa IR20 DRR, Hyd (India) S
O.sativa PAU933 DRR, Hyd (India) MR
O.sativa R4 DRR, Hyd (India) R
O.sativa Kalamekri DRR, Hyd (India) R
O.sativa AC32753 DRR, Hyd (India) R
O.nivara ON 38–1 DRR, Hyd (India) R
O.nivara M 209 A DRR, Hyd (India) R
O.nivara 81832 DRR, Hyd (India) R
O.nivara 106133 DRR, Hyd (India) R
O.nivara 210223 DRR, Hyd (India) R
O.nivara 81852 DRR, Hyd (India) R
O.nivara 100963 DRR, Hyd (India) R
O.nivara 102166 DRR, Hyd (India) R
O.nivara ON132 DRR, Hyd (India) R
O.nivara ON15 DRR, Hyd (India) R
O.longistaminata OL1 CRRI, Cuttack (India) R
O.longistaminata OLD DRR, Hyd (India) R
O.alta IC384116 NBPGR (India) R
O.officinalis IC203740 NBPGR (India) R
R resistance, S susceptible, MR moderately resistance
each gene was covered using overlapping primers (S1 Table). ForXa21, 18 alleles were isolated fromO.nivara(M209A, 81832, 81852, 100963, 102166, 106133, ON132, ON15 and ON34),O.
sativa(IR20, TN1, PB1, PAU933, MohemPhou, MustiLaiphou and R4),O.longistaminata
(OL1 and OLD); 14 alleles ofXa26, were amplified fromO.nivara(ON 38–1, M 209 A, 81832,
81852, 106133, 210223 and ON132),O.sativa(TN1, PB1, MohemPhou, MustiLaiphou and
R47),O.alta(IC384116),O.officinalis(IC203740); and 15 alleles ofxa5were amplified from
(M209A, 81832, 81852, 100963, 106133, ON132 and ON15),O.sativa(TN1, PB1,
Mohem-Phou, MustiLaiphou, Kalamekri and AC32753),O.longistaminata(OL1 and OLD). PCR
reac-tions were carried out using a standard protocol under the following condireac-tions: The total reaction volume was 30μL and the reaction mixture consisted of 50 ng genomic DNA, 0.9μM of each primer, 0.2 mM of each dNTP, 5 x PCR buffer (10 mM Tris-HCl, pH 8.0, 1.5 mM MgCl2), and 0.6 unit (2U/μL) of High Fidelity Phusion polymerase (Finnzymes, Thermo
Sci-entific USA). Hi-Fi polymerase was used as it has proof reading ability. The PCR program was set for the initial denaturation at 98°C for 3 min, 35 cycles of amplification with DNA denatur-ation at 98°C for 15 s, and annealing was set at different temperatures for different primers for 30 s. Elongation was kept at 72°C with a different time period specific for the product size. There was a slight variation in the PCR amplification pattern from one primer to another based on the annealing temperature. The amplified product was then separated and resolved on 1% agarose gel and purified using a gel extraction kit (Sigma Aldrich, USA). The purified PCR products were then cloned into pTZ57R/T vector (Thermo Scientific, USA) and quenced commercially by SciGenome Labs (Cochin, India). Two clones of each allele were se-quenced to confirm the accuracy of the sequence. The sequences obtained in this study were submitted to the NCBI GenBank database. The GenBank accession numbers of the alleles are KF689653- KF689667 and KJ890413-KJ890443.
Allelic diversity and sequence data analysis
based on the parameter of R2between all SNPs using DnaSP v5.10. The significance of LD was measured statistically using Fisher’s exact test and Chi-square test. Decay in LD was deter-mined by plotting graph of R2versus pairwise distance (bp).
Constructing phylogenetic trees
The phylogenetic trees depicting the genetic relatedness among alleles were constructed for each gene using MEGA 4 [37] (www.megasoftware.net/mega4/mega.html). The multiple aligned sequences were used as an input file for constructing each tree. An unrooted linear Neighbor joining (NJ) tree was plotted with an option of 10,000 bootstrap values. Missing gaps were excluded from the analysis. Gene tree using Maximum Parsimony, Minimum Evolution and UPGMA method were also drawn to verify consistency.
Allelic expression analysis
Based on the sequence and genotypic screening analysis through marker study conducted with pTA248 marker [38] forXa21andxa5functional marker [39], four alleles each of the genes
Xa21andxa5were selected for expression analysis. Selected alleles included IRBB21 (Xa21) and IRBB5 (xa5) as resistant controls and IR24 as a susceptible control for both genes. The
Xa21test alleles were from two accessions ofO.longistaminataand thexa5test alleles were from Kalamekri and AC32753 (O.sativa). Expression analysis ofXa26alleles were not per-formed asXa26gene being reported as constitutively expressed gene [40]. The rice plants were grown in glass house with adequate water and nutrients. The day and night temperature of the glass house was maintained at 28°C. Plants at booting stage were then inoculated withXoo
strain DX011 (which was incompatible with rice genotypes possessingXa21andxa5) in tripli-cates by leaf clipping method [26]. The control plants were treated in a similar manner with sterile water instead ofXooinoculums. Leaf samples for RNA isolation were collected at differ-ent time intervals between 0 and 24 h. Total RNA was extracted with 100 mg leaf samples using an RNA isolation kit (Genetix, India) according to the manufacturer’s instructions, from triplicate samples. Extracted RNA was treated with DNase to remove genomic DNA impuri-ties. Equal amounts of RNA (1–2μg) were taken from each sample and cDNA was synthesized using Superscript III cDNA synthesis kit (Invitrogen, USA) following manufacturer’s instruc-tions. For theXa21alleles, semi quantitative RT-PCR was performed. A 30μL reaction mixture
consist of 100 ng cDNA, 10X PCR buffer (10 mM Tris-HCl, pH 8.0, 1.5 mM MgCl2), 4 pmole
of each primer, 0.2mM of each dNTPs and 0.6 unit (2U/μL) ofTaqpolymerase (Invitrogen, USA). Initial denaturation was set for 4 min at 95°C with 26 cycles of amplification with 45 s DNA denaturation at 94°C, 30 s annealing at 60°C and extension at 72°C for 1 min. Primers forxa5andXa21were designed from the exonic junction (S1 Table). Actin primer (Forward 5'
GAGTATGATGAGTCGGGTCCAG 3’and Reverse 5’ACACCAACAATCCCAAACAGAG
3’) was used as reference gene for both semi-quantitative and quantitative RT-PCR (qRT-PCR) [41]. For qRT-PCR, a master mix containing 2X Sybr Select Master Mix (Invitrogen, USA), 150–400 nM forward and reverse primers, and 100 ng of cDNA was used as a template. The PCR program was set for UDG activation at 50°C for 2 min, AmpliTaq DNA Polymerase UP activation at 95°C for 2 min, and denaturation at 95°C for 15 s. Primer annealing was per-formed at the melting temperature of the primer for 15 s and extension at 72°C for 1 min. The cycle was repeated for 40 times from denaturation step. The real time data were analyzed by relative quantification methods and was calculated using the following formula:
ddC
T ¼ ðdCT;Target dCT;ReferenceÞTime x ðdCT;Target dCT;ReferenceÞTime0
dC
Fold changes in expression was expressed as2 ddC
T[42].Statistical significance of the data
was analyzed using two way ANOVA and Bonferroni post test.
Results
Nucleotide Polymorphism analysis of
Xa21
,
Xa26
and
xa5
loci
Sequence analysis ofXa21alleles. The total ORF ofXa21comprising of 3,921 nucleotides
including one intron of 843 base pairs was sequenced from 18 accessions. Allelic sequences ranged between 3,828 to 3,921 nucleotides and the length of the total aligned sequences was 3,997 base pairs. The percentage identity of the nucleotide sequences of the alleles ranged be-tween 95–99% in comparison to IRBB21. There were a total of 196 mutations, 191 segregating sites, 113 parsimony informative sites, 64 InDel events and 78 singleton variable sites (rare kind of polymorphism, which is present once in the sample) within the entire sequenced re-gion. The overall average number of nucleotide difference (K) was found to be 41.977
(Table 2). There were a total of 136 SNPs in exonic regions and 40 SNPs in the intron. The fre-quency of SNP was one SNP per 22.7 bp for the entire sequence, one SNP per 23 bp for the ex-onic region and one SNP per 21.5 bp for the intron. The SNP frequency was higher inO.sativa
with one SNP per 51.9 bp and one SNP per 55.25 bp inO.nivara. The average frequency of InDel polymorphism was one InDel site for every 62.4 bp. Maximum InDel was observed in the first exon and least in the last exon. The frequency of InDel was highest in the intron fol-lowed by exon 1 and least in exon 2. Nucleotide substitution was observed throughoutXa21
but the highest nucleotide diversity was seen within the first 500 bp of the coding region. The nucleotide diversityπof the total sequence was 0.01112 and the intronic region had higher nu-cleotide diversity (π= 0.01328;Өw= 0.01500) than the coding region (π= 0.01055;Өw=
0.01433). Within the coding region, exon 1 (π= 0.01083) had substantially higher diversity than exon 2 (π= 0.00874).O.nivaraexhibited slightly higher sequence variation (π= 0.00782;
Ө
w= 0.00846) compared toO.sativa(π= 0.00688;Өw= 0.00782). Nucleotide diversity was higher than InDel diversity (0.00238). All alleles, except OLD and OL1, showed an equal level of polymorphism (S1 Fig.). Frequency of‘A’to‘G’transition was the most frequent polymor-phism and overall transition bias of the alleles was 1.221.
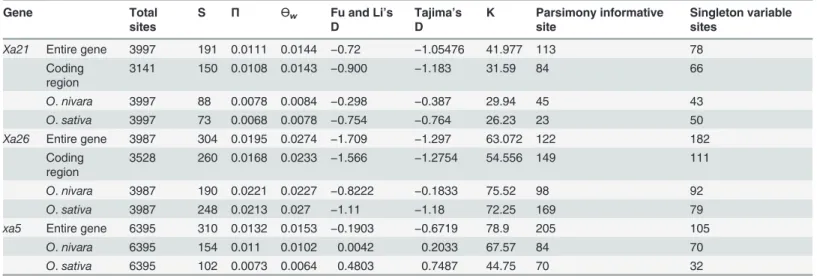
Table 2. Summary statistics of nucleotide diversity analysis ofXa21,Xa26andxa5genes.
Gene Total
sites
S Π Өw Fu and Li’s
D
Tajima’s D
K Parsimony informative site
Singleton variable sites
Xa21 Entire gene 3997 191 0.0111 0.0144 −0.72 −1.05476 41.977 113 78
Coding region
3141 150 0.0108 0.0143 −0.900 −1.183 31.59 84 66
O.nivara 3997 88 0.0078 0.0084 −0.298 −0.387 29.94 45 43
O.sativa 3997 73 0.0068 0.0078 −0.754 −0.764 26.23 23 50
Xa26 Entire gene 3987 304 0.0195 0.0274 −1.709 −1.297 63.072 122 182
Coding region
3528 260 0.0168 0.0233 −1.566 −1.2754 54.556 149 111
O.nivara 3987 190 0.0221 0.0227 −0.8222 −0.1833 75.52 98 92
O.sativa 3987 248 0.0213 0.027 −1.11 −1.18 72.25 169 79
xa5 Entire gene 6395 310 0.0132 0.0153 −0.1903 −0.6719 78.9 205 105
O.nivara 6395 154 0.011 0.0102 0.0042 0.2033 67.57 84 70
O.sativa 6395 102 0.0073 0.0064 0.4803 0.7487 44.75 70 32
S = No. of polymorphic sites, K = Average nucleotide difference,π= Nucleotide diversity,Өw= No. of segregating sites
Divergence at the synonymous site (πsyn= 0.01439) was higher than the non-synonymous site (πnon= 0.00876). Most of the polymorphic sites in the coding region resulted in silent sub-stitution, both conservative and non-conservative amino acid changes along with internal stop codons in all 18 alleles. We observed that the value of Kswas greater than Kaleading to the
ratio of Ka/Ks<1, indicating the alleles were under the process of purifying selection with
re-spect to IRBB21 (Table 3). Tajima’s test showed no significant difference betweenπandӨ,
thus, showing consistency with the neutral theory [43]. The Tajima’s D value was estimated to be -1.05476 (P>0.10,). Similarly, separate Tajima’s D test for coding, non-coding and intra-species also showed negative and non-significant departure from neutrality. Linkage Disequi-librium was significant for bothO.nivara(R2>0.02) andO.sativa(R2>0.03) (0.001<
P<0.01). LD plots of R2values as a function of pairwise distance between polymorphic sites
revealed slight decay of the analyzed loci within 3,500 bp inO.sativaand 4,000 bp inO.nivara
(S2 Fig.). Fisher’s exact test and Chi-square test provided the number of significant pairwise comparisons. While determining the recombination sites of this locus, a minimum of seven Rm events were detected considering only the coding region.
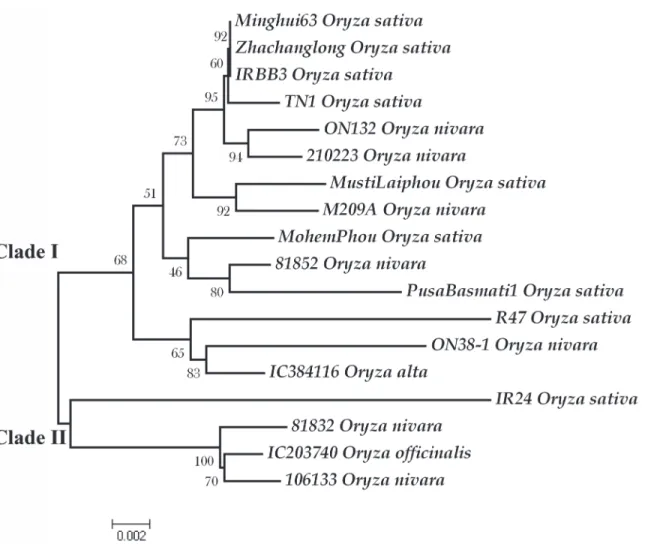
Xa21gene tree and molecular evolution. Nucleotide sequences were used to deduce
neighbor joining and parsimony trees. Two major clades, I and II, were present which were supported by high bootstrap values (Fig. 1). Clade I comprised two minor clades. IRBB21 and two alleles fromO.longistaminatawere clustered separately in clade II, showing that these al-leles were highly distinct from the remaining alal-leles of different species (Fig. 1). These three al-leles emerged together in NJ, ME, MP and also UPGMA. Between clade I and II, there were 33 fixed differences across the entire sequence. Clade II showed slightly higher within clade diver-sity (π= 0.00946) than those of clade I (π= 0.00772). There were 55 singletons and 0 parsimo-ny sites in clade II and 61 singletons and 60 parsimoparsimo-ny informative sites among alleles in clade I. Highest divergence among the alleles was observed between IRBB21 related and remaining alleles. The intra specific divergence was quite low compared to inter specific divergence; how-ever the divergence between alleles ofO.sativaandO.nivaraindividuals were minimal (S3 Fig.).
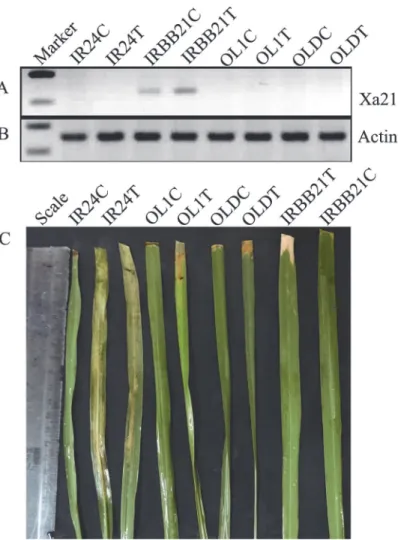
Allelic expression analysis ofXa21. In order to confirm the functional significance of
al-leles identical to resistantXa21(IRBB21), we checked the expression ofXa21alleles in two
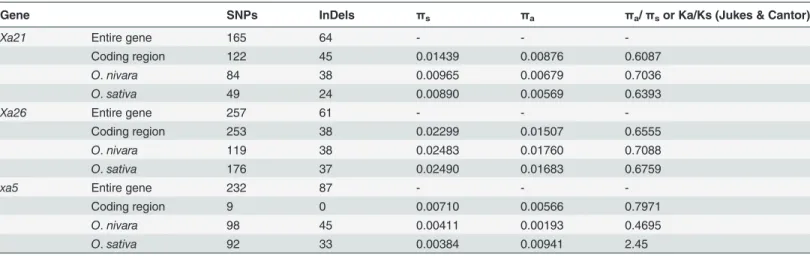
Table 3. Summary statistics of different types of mutations present inXa21,Xa26andxa5alleles.
Gene SNPs InDels πs πa πa/πsor Ka/Ks (Jukes & Cantor)
Xa21 Entire gene 165 64 - -
-Coding region 122 45 0.01439 0.00876 0.6087
O.nivara 84 38 0.00965 0.00679 0.7036
O.sativa 49 24 0.00890 0.00569 0.6393
Xa26 Entire gene 257 61 - -
-Coding region 253 38 0.02299 0.01507 0.6555
O.nivara 119 38 0.02483 0.01760 0.7088
O.sativa 176 37 0.02490 0.01683 0.6759
xa5 Entire gene 232 87 - -
-Coding region 9 0 0.00710 0.00566 0.7971
O.nivara 98 45 0.00411 0.00193 0.4695
O.sativa 92 33 0.00384 0.00941 2.45
SNPs = Single nucleotide polymorphism, InDels = Insertion Deletion,πs= average number of nucleotide diversity at synonymous sites,πa= average number of nucleotide diversity at non synonymous sites.
accessions ofO.longistaminata(OL1 and OLD). However, these two tested alleles were not ex-pressed or detected before or after infection. We could see the up regulation of this gene only in IRBB21 after infection as shown by Semi-QRT-PCR (Fig. 2).
Sequence analysis of
Xa26
alleles
Alleles ofXa26were isolated from 14 rice accessions ofO.sativaandO.nivara. Complete se-quence analysis was performed with the alleles from IR24, IRBB3, Minghui 63 and Zhachang-long (O.sativa). Sequence polymorphism was detected across 3879 bp of sequence covering 3315 bp in exonic regions, 106 bp in intronic regions and 458 bp in the 3’UTR. The total align-ment length was 3987 bp. The percentage sequence similarity among alleles ranged between 95–99%. IRBB3 showed least sequence similarity with IC203740 and IR24 of 97% and 96%, respectively.
Nucleotide sequence polymorphisms were analyzed across 18 accessions of different species on theXa26locus. There were a total of 304 polymorphic (segregating sites) and 312 mutations
Fig 1. A Neighbor-Joining plot showing the evolutionary relationship betweenXa21alleles.The tree was constructed using 10,000 bootstrap values. The scale of the tree with branch lengths is indicated at the bottom. There are two major clades, clade I and II. The IRBB21 related alleles were clustered together in clade II. Each allele is indicated with the accession name followed by species name. Phylogenetic analyses were conducted in MEGA4 (Tamura et al. 2007).
with an estimated average nucleotide divergence (K) of 63.072. Among them, 182 sites be-longed to singleton variable and 122 parsimony informative sites. There were 16 haplotypes among 18 alleles and the haplotype diversity, Hd = 0.98 ± 0.028. The overall nucleotide diversi-ty wasπ= 0.01958 and the Watterson estimator‘Ө
w’= 0.02744 (Table 2). The highest nucleo-tide diversity was observed in the 3’UTR followed by coding region (π= 0.01684). As many as 61 InDel events and 315 nucleotide substitutions were present. Frequency of SNPs was more than the InDels being one SNP per 24.91 bp and one InDel per 65.36 bp. The average InDel length was longer in the coding region (8.2271) as compared to the entire gene (2.15) and its InDel diversity (πi= 0.0012) was least different from that of coding region (πi= 0.00091). The longest InDel was found in twoO.nivaraaccessions (ON132 and 210223). Among alleles, the highest number of polymorphisms was found between IR24 and IRBB3. Many of the SNPs and InDels occurred in the exons, which resulted in stop codons and premature termination of cod-ing frame. Pattern of nucleotide substitution was estimated by the maximum composite likeli-hood method where the overall transition bias‘R’= 1.421, the highest among the four genes.
Fig 2. Semi-quantitative PCR analysis ofXa21alleles in control and treated samples of IR24, IRBB21, OL1 and OLD.(a) Expression ofXa21gene in IRBB21 control and infected withXoo.Xa21expression is absent in remaining samples. (b) Expression pattern of reference gene rice actin in the samples. (c) Phenotypic response of the genotypes afterXooinfection. Leaves with lesion length more than 5 cm are susceptible. IR24 and IRBB21 was used as susceptible and resistance controls, respectively. Control (C), Treated/Infected (T).
The‘G’to‘A’transition was the most favored transition and the transition and transversion rate was almost the same in all alleles when compared individually with IRBB3.
Similarly, as observed forXa21alleles, the divergence at silent site (πsyn= 0.02299) was higher than the non-synonymous site (πa= 0.01507). When individual alleles were compared with IRBB3/Minghui 63, the total number of synonymous substitutions were more than the non-synonymous changes resulting in Ka/Ks<0, which illustrates that the alleles are undergo-ing purifyundergo-ing selection with reference toXa26of IRBB3 (Table 3). For the neutrality test, theӨ
value was greater thanπgiving negative Tajima’s D (-1.297, p>0.10) (Table 2). The difference was statistically not significant, which illustrates an absence of significant selection of this gene in our study population. Out of the 14 alleles isolated, only two alleles (M209A and 106133) showed an intact ORF giving a full length protein, whereas internal stop codons were found in the sequences of the remaining alleles. Amino acid substitutions were found both in LRR and kinase domain.
As in the case ofXa21alleles, interspecific nucleotide diversity was slightly higher inO.
nivara(π= 0.02216) thanO.sativa(π= 0.02139). However intra specifically,O.sativa(254) had more mutations thanO.nivara(191). Both species showed negative Tajima’s D with non-significant departure from neutrality. The linkage disequilibrium was found to be non-significant for bothO.sativa(R20.54) andO.nivara(R2= 0.7). Decay in LD was also observed in both the species when R2was plotted against pairwise distance between polymorphic sites (S4 Fig.).
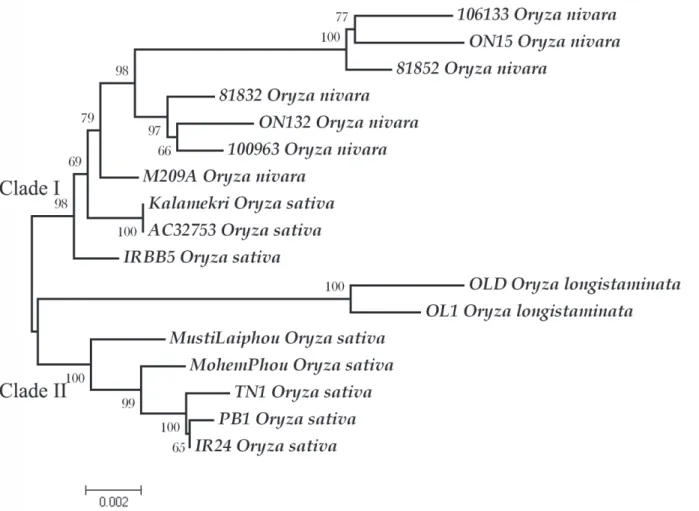
Molecular evolution tree ofXa26. A dendrogram depicting the relationship and
diver-gence of 18Xa26alleles was plotted using Maximum Parsimony and NJ. The plot formed two
major clades supported by strong bootstrap values. Clade I had resistant alleles from IRBB3, Minghui 63 and Zhachanglong while two susceptible alleles fromO.sativa(PB1 and IR24) were clustered in clade II. The cluster representing the remaining alleles fromO.nivara,O.
sativa, andO.officinaliswere not distinguished at the species level (Fig. 3). Intermixing of ge-netic components was observed, which may be due to outcrossing.
Sequence analysis of
xa5
alleles
xa5alleles were isolated from 15 accessions, out of which alleles from twoO.sativaaccessions were similar to recessivexa5and remaining alleles were similar to dominantXa5. Comparative analysis of the alleles with respect to IRBB5 showed an average sequence identity in the range of 97–99%. The total alignment length was 6395 sites and size of the alleles ranged between 6140 and 6264 bp. The comparative sequence analysis showed 310 polymorphic sites (out of 316 total mutations), 105 singleton variable sites and 205 parsimony informative sites. There were a total of 16 haplotypes (Hd = 0.993 ± 0.023) and 87 InDel events. The frequency of SNPs and InDels were higher in the intronic and the non-coding region compared to the exonic re-gion. The mean frequency of InDel was present at every 73.5 bp and that of SNP was one SNP per 27.56 bp. As observed in previous studies [13], transition/transversion bias was present with R = 1.066, where‘G’to‘A’and‘C’to‘T’transitions were most prevalent. In the exonic re-gion, we observed significant SNPs consisting of both synonymous and non-synonymous sub-stitutions. Apart from the type of substitution reported by Iyer et al. [24] we found 9 additional SNPs in the coding region. Among these SNPs, 7 resulted in amino acid substitution (S5 Fig.) and included an‘S’to‘A’substitution in AC32753 (O.sativa) and a‘Q’to‘L’in PB1 (O.sativa) which were non conservative amino acid substitutions. The frequency of SNP was higher inO.
nivaraaccessions (one SNP per 63.31 bp) thanO.sativa(one SNP per 70.27 bp). We also ob-served 39 fixed differences betweenO.longistaminataand remaining accessions.
The overall diversity analysis showed a mean nucleotide diversity ofπ= 0.01324,Өw=
in the second intron. Intraspecific polymorphisms were found to be higher inO.nivara(π= 0.01106,Өw= 0.01029) thanO.sativa(π= 0.00733,Өw= 0.00644) (Table 2). Ka/Ks values for
each allele were determined in comparison toxa5(IRBB5) sequence. Ka/Ks were greater than one for PB1, TN1 (O.sativa), 81832 and 81852 (O.nivara). The selection was neutral for AC32753 and Kalamekri while, remaining alleles were undergoing purifying selection with re-spect to IRBB5. We observed a similar trend in all the genes where Tajima’s test showed no sig-nificant difference betweenπandӨ, which is consistent with the neutral theory [35]. Though,
some individual alleles showed Ka/Ks>1, the average Tajima’s D was estimated to be
-0.67191 (P>0.10). Similarly, separate Tajima’s D test for intraspecies variation was negative and did not depart from neutrality.
Linkage Disequilibrium was significant for bothO.nivara(R2>0.75, Panel A inS6 Fig.)
andO.sativa(R2>0.55, Panel B inS6 Fig.) (0.001<P<0.01). The LD plot of R2values as a
function of pairwise distance between polymorphic sites revealed slight decay of the analyzed loci within 4000 bp inO.nivara. The pairwise comparison was significant as determined by
Fig 3. Neighbor joining gene tree depicting the relationship of all studied individuals atXa26locus.The tree was inferred from 10,000 replicates bootstrap values to represent the evolutionary history of the alleles. The highest bootstrap value of each branch is indicated correspondingly. The scale of branch length is indicated at the bottom. Each allele is indicated with the accession name followed by species name. Phylogenetic analyses were conducted in MEGA4 (Tamura et al. 2007).
Fisher’s exact test and Chi-square test. While determining the recombination sites at this locus, zero Rm events were detected considering only the coding region.
xa5gene tree and molecular evolution. An unrooted phylogenetic tree (NJ plot)
depict-ing genetic relatedness among the alleles was plotted usdepict-ing Mega 4. The entire sequence com-prising 5’UTR, coding, non-coding and 3’UTR were considered in plotting the tree. Two major clades, supported with high bootstrap values, were present in the plot. Resistant alleles were found to be closer to alleles fromO.nivaraaccessions than the susceptible alleles fromO.sativa
accessions. IRBB5 was found clustered in clade I along with otherO.nivaraaccessions (Fig. 4). A similar pattern of clade formation was also observed with ME, MP and UPGMA tree. Within clades, diversity was found to be higher in clade II (π= 0.01288) than clade I (π= 0.01040). There were 66 singleton variable sites, 109 parsimony informative sites in clade I and 76 SVS and 114 PIS in clade II. In disparity index analysis, the highest composite distance was found between 81852 (O.nivara) and OLD (O.longistaminata) (S7 Fig.).
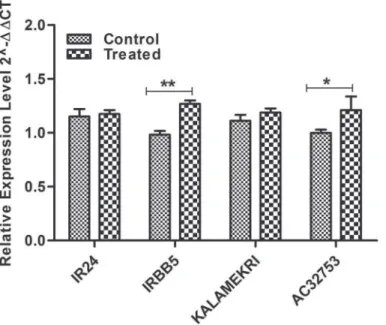
Allelic expression analysis ofxa5. Expression analysis ofxa5alleles identified from
acces-sions AC32753 and Kalamekri were tested using IRBB5 and IR24 as resistant and susceptible, respectively. We were interested to see if any of the SNPs in the alleles other than the previous report had any influence in its expression or not. Only basal level of expression of these alleles
Fig 4. A neighbor joining gene tree of all studied individuals atxa5locus.The tree was constructed with 10,000 bootstrap values. The highest bootstrap value is indicated on each branch. The scale of branch length is indicated at the bottom. Each allele is indicated with the accession name followed by species name. The alleles are clustered separately at the species level, while thexa5alleles (resistant and recessive form) IRBB5, AC32753 and Kalamekri show more relatedness toO.nivara.
were observed in all the tested samples (Fig. 5) which suggests the level of expression of this gene is not related to its resistance towards the pathogen.
Discussion
Functional variations of genes which lead to different phenotypes are being influenced by poly-morphisms such asSNPs and InDels of single nucleotide or large DNA fragments. As a natural phenomenon, different allelic forms ofRgenes are maintained in a population so as to protect plants against evolving pathogens [2,14]. The high-end, low-cost next generation sequencing technologies in combination with vast genetic resources available in rice, gives us an opportu-nity to discover potential resistance gene and trace their evolutionary pattern. In this study, we have analyzed the sequence polymorphisms of three major bacterial blight resistance genes
xa5,Xa21andXa26in order to identify novel alleles. This may help to uncover genetic variants of these genes in wild and cultivated species.
Among the resistance genes of bacterial blight disease,Xa21is one of the most commercially exploited and studied gene. It has been reported to confer broad spectrum resistance to diverse
Xoostrains across the world, yet there are reports on the susceptibility ofXa21to pathotypes of Indian and South Asian origin [44–48], which may be due to mutation and evolution of these isolates. Discovery of candidate disease resistance alleles and analysis of novel variant alleles of
Xa21will help in combating new and more virulent strains of pathogens.Xa26is another re-ceptor kinase gene, which is structurally similar toXa21. Phenotypically, even though IRBB3 (which hasXa3/Xa26) was susceptible to the five virulent isolates used in our study, we were interested in understanding its molecular diversity statistics, hence this gene was considered for analysis.xa5, on the other hand is a recessive resistance gene. Finding any sequence varia-tion which influences the activity of this gene other than the previously reported forms of mu-tations would be interesting.
Nucleotide diversities ofXa21,Xa26andxa5genes were found to be comparatively less as compared to reportedRgenes of Arabidopsis and other crop plants [49–51]. At the species
Fig 5. This graph depicts the expression pattern ofxa5alleles in control and treated samples of IR24, IRBB5, AC32753 and Kalamekri.**P value significant with P<0.01;*P value<0.05 significant
confirmed through two way ANOVA Bonferroni post test.
level, we found a slightly higher diversity inO.nivarathan the cultivatedO.sativa. We also ob-served a decrease in diversity amongO.sativa, which may be due to the domestication bottle-neck [52–54]. Under natural conditions, introns evolve more rapidly than exons [55], likewise sequence polymorphisms were higher in the intron and non-coding region than coding region, which is often seen in most of the genes studied. Haldane [51] stated that high polymorphism is expected at the locus involved in pathogen recognition; likewise, elevated levels of nucleotide
and amino acid polymorphisms were observed atXa21andXa26loci, which also have an LRR
domain. LRR are known to be involved in pathogen recognition. Numerous substitutions and InDels resulted in amino acid polymorphisms resulting in non-functional genes, including two alleles ofXa21fromO.longistaminatathat were due to a premature termination codon, which were confirmed by expression analysis.
Universally, transition bias is prevalent across different kingdom, genera and species and has been observed to be a common phenomenon during the course of evolution. The alleles studied herein showed more transitions from‘G’to‘A’and‘C’to‘T’than vice versa. A similar feature has been observed in prokaryotes [56], nematodes [57], Drosophila, mammals [58] and plants [59]. High rates of‘C’to‘T’transitions may occur due to methylation of cytosine, which increases the probability of this form of substitution [60]. It was difficult to determine the an-cestral root of the alleles from the phylogenetic tree as the trees were unrooted. AmongXa21
alleles, OL1 and OLD showed maximum homology with IRBB21. This finding defined their ge-netic relatedness and similar origin, asXa21in IRBB21 was also derived fromO. longistami-nata. The presence of two divergent groups and distinctness of IRBB21 related alleles from remaining alleles were evident from the divergence table and two separate major clades sup-ported with high bootstrap values in the phylogram (Fig. 1). Forxa5andXa26genes, a clear differentiation among alleles at the species or phenotypic level was difficult to determine from the gene tree. For a comprehensive study to elucidate evolutionary relationship of the alleles, it is vital to increase the number of natural populations ofO.sativaandO.nivara.
Tajima’s D statistics signify the nature of selection at a locus. Natural selection was indicated in the case of rice blast resistance genes in theO.rufipogonpopulation andRgenes in other plants with significant Tajima’s D value. However, the resistance genes analyzed in this study failed to show a significant Tajima’s D, which suggest the absence of natural selection at all the three loci. However, the possibility of selection at these loci cannot be precluded as the samples under study were small in size and randomly selected from a natural population [13]. A large number of polymorphisms among the alleles leading to amino acid substitution and premature termination of protein translation were also observed. In addition, the negative Tajima’s D value, though not significant, shows an excess of rare variants and indicates the likelihood of selection as reported in the case ofRPP13[51] andPto[2]. Alternatively, relaxed selection pres-sure or the genes under consideration might be evolving neutrally resulting in the gene being depleted from the population through deletion, frame-shift or nonsense mutation [51].
LD was measured by plotting R2as a function of pairwise distance between the SNPs. The LD value was found to be the same as that of other plants reported. A locus specific selection leads to an increase in the LD. Higher R2was observed inO.sativathanO.nivaraand the ex-tent of LD was higher inO.nivarain the case ofXa21alleles. In contrast, a much higher value of R2and rapid decay in LD was observed inO.nivarathanO.sativaforXa26andxa5alleles. This decay in LD may be because of high recombination rate, which mainly happens in the cross pollinated plants. Recombination and cross pollination influences decay of LD.
not expressed, even after infection with a pathogen while IRBB21 was observed to be expressed (Fig. 2). Since, OL1 and OLD were found to be resistant to BB, resistance in these two acces-sions might be contributed by loci other thanXa21. Further studies with segregating popula-tion will confirm this. Looking forXa21alleles in moreO.longistaminataaccessions and other wild species may help in finding the desired form of the allele. As in the case ofxa5alleles, IRBB5, susceptible IR24, and the remaining tested alleles AC32753 and Kalamekri showed al-most equal level of expression both under infected and non-infected state. This indicates the level of expression of the alleles might not influence its function, however, their ability or non-ability to bind DNA polymerase and to manipulate the induction of susceptibility genes may determine their role in resistance [61]. The functional significance of amino acid substitutions in AC32753, 81832 (O.nivara) and 81852 (O.nivara) may be elucidated however, structural amino acid substitutions in these accessions occurred in the loop region. Hence, functional changes in these alleles with respect to resistance/susceptibility due to these mutations are least expected. Phenotypically, AC32753 and Kalamekri were resistant to the disease and these two alleles may be employed for gene pyramiding into elite cultivars, after genetically establishing that resistance in these two accessions is controlled by novel alleles ofxa5through analysis of segregating populations.
In summary, we have analyzed the genetic diversities of three major BB resistance genes in rice. This analysis is the first of its kind for BB related genes afterXa27and may also help in molecular evolutionary studies and mining useful alleles for crop improvement. The major contribution of these variations among alleles on BB management has yet to be analyzed and their potential impact ascertained. Including more individuals from natural populations in the analysis after phenotypic screening with pathogens possessing specificAvrgenes will help in determining the co-evolutionary relationship between host resistance and pathogen. A com-parative study on susceptible and resistance accessions which define their distinct reaction to-wards pathogens may help in developing effective strategies for managing the infectious plant disease. Some of the accessions identified in this study which showed high resistance to BB will be used as donor lines for BB resistance genes to BB susceptible elite cultivars. The alleles iden-tified in this study will also be transferred to elite susceptible varieties and further confirmed their functional significance.
Supporting Information
S1 Table. List of primers used for isolation of alleles and expression analysis.
(DOCX)
S1 Fig. Graph depicting different types of polymorphisms found atXa21locus among dif-ferent accessions.Blue, red and green colors indicate InDels, SNPs and total number of poly-morphic sites, respectively. Different accessions are shown in X-axis and number of
polymorphisms on Y- axis. (TIF)
S2 Fig. Pattern of Linkage disequilibrium amongXa21alleles (A)O.nivara(B)O.sativa.
Decay of LD‘R2’as a function of distance between pairs of polymorphic sites inXa21alleles. The Black line depicts the expected decline of LD against distance based on the equation given by HILL and WEIR (1988).
(TIF)
S3 Fig. Estimates of base composition bias difference between sequences ofXa21alleles.
numbered rows. (TIFF)
S4 Fig. Pattern of Linkage disequilibrium amongXa26alleles (A)O.nivara(B)O.sativa.
Decay of LD‘R2’as a function of distance between pairs of polymorphic sites inXa26alleles. The Black line depicts the expected decline of LD against distance based on the equation given by HILL and WEIR (1988).
(TIF)
S5 Fig. (A) Multiple alignment of coding region of xa5 alleles.Substitutions in the CDS are represented with different colors. (B) Output of multiple alignment for the predicted amino acid sequences ofxa5alleles. The rice genotypes are indicated in left column. The numbers on the top of the sequences indicate the position of amino acids. Different colors in amino acid shows non synonymous changes. Alignment was performed using Multalin program. (TIF)
S6 Fig. Pattern of Linkage disequilibrium amongxa5alleles (A)O.nivara(B)O.sativa.
Decay of LD‘R2’on X-axis as a function of distance between pairs of polymorphic sites inxa5
alleles and nucleotide distance on Y-axis. The Black line depicts the expected decline of LD against distance based on the equation given by HILL and WEIR (1988).
(TIF)
S7 Fig. Estimates of base composition bias difference between sequences ofxa5alleles.The
difference in base composition bias per site is shown in each column. Left column indicate the alleles and the numbering columns indicate the divergence rate corresponding to the
numbered rows. (TIF)
Acknowledgments
We would like to thank DRR, Hyderabad (TS), Rajendra Agricultural College, Pusa (Bihar), CRRI, Cuttack (Odisha), NBPGR, New Delhi for providing rice germplasms. We also thank DRR, Hyderabad (TS) for providing differentXooisolates. We also acknowledge Prof. A. R. Podile for his critical suggestions and support. We also thank the facilities given by DBT-CREBB, DST-FIST level II support, UGC-SAP-CAS to Department of Plant Sciences, School of Life Sciences, University of Hyderabad, Hyderabad, India. Author WB also thank CSIR for the JRF and SRF fellowship.
Author Contributions
Conceived and designed the experiments: WB RMS IAQ IAG. Performed the experiments: WB AK SKRM. Analyzed the data: WB IAQ IAG. Contributed reagents/materials/analysis tools: GSL IAQ IAG. Wrote the paper: WB IAG.
References
1. Kover PX, Schaal BA. Genetic variation for disease resistance and tolerance among A. thaliana acces-sions. Proc Natl Acad Sci USA. 2002; 99: 11270–11274. PMID:12172004
2. Rose LE, Michelmore RW, Langley CH. Natural variation in the Pto disease resistance gene within spe-cies of wild tomato (Lycopersicon). II. Population genetics of Pto. Genet. 2007; 175: 1307–1319. PMID:
17179076
4. Adhikari TB, Mew TW, Teng PS. Progress of bacterial blight on rice cultivars carrying differentXa -genes for resistance in the field. Plant Dis. 1994; 78: 73–77.
5. Reddy APK. Bacterial blight: crop loss assessment and disease management. In Proceeding of the In-ternational Workshop on Bacterial Blight of Rice. InIn-ternational Rice Research Institute, Manila, the Phil-ippines. 1989. pp. 79–88.
6. Mew TW Current status and future prospects of research on bacterial blight of rice. Annu Rev Phyto-pathol. 1987; 25: 359–382.
7. Chen S, Huang ZH, Zeng LX, Yang JY, Liu QG, Zhu X. High resolution mapping and gene prediction of Xanthomonas oryzae pv.oryzaeresistance gene Xa7. Mol Breed. 2008; 22: 433–441.
8. Kumar PN, Sujatha K, Laha GS, Rao KS, Mishra B, Viraktamath BC et al. Identification and fine-map-ping of Xa33, a novel gene for resistance to Xanthomonas oryzae pv. oryzae. Phytopathol. 2012; 102: 222–228.
9. Iyer-Pascuzzi AS, Sweeney MT, Sarla N, McCouch SR.Use of naturally occurring alleles for crop im-provement. In: Upadhyaya NM, editors. Rice functional genomics- Challenges, progress and pros-pects: Springer; 2007. pp. 113–143.
10. Huang CL, Hwang SY, Chiang YC, Lin TP. Molecular Evolution of thePi-taGene Resistant to Rice Blast in Wild Rice (Oryza rufipogon). Genet. 2008; 179: 1527–1538. doi:10.1534/genetics.108.089805
PMID:18622033
11. Lee S, Jia Y, Jia M, Gealy DR, Olsen KM, Caicedo AL. Molecular Evolution of the Rice Blast Resistance GenePi-tain Invasive Weedy Rice in the USA. PLoS ONE. 2011; 6(10): e26260. doi:10.1371/journal. pone.0026260PMID:22043312
12. Yoshida K, Miyashita NT. DNA polymorphism in the blast resistance genePitaof wild riceOryza rufipo-gonand its related species. Genes Genet Syst. 2009; 84: 121–126. PMID:19556706
13. Bimolata W, Kumar A, Sundaram RM, Laha GS, Qureshi IA, Reddy GA, et al.)Analysis of nucleotide di-versity among alleles of the major bacterial blight resistance gene Xa27 in cultivars of rice (Oryza sativa) and its wild relatives. Planta. 2013; 238: 293–305. doi:10.1007/s00425-013-1891-3PMID:
23652799
14. May RM, Anderson RM. Parasite-host coevolution. Futuyma DJ, Slatkin M, editors. Coevolution: Sinauer, Sunderland, Mass, USA; 1983. pp. 186–206.
15. Buckler ES, Thornsberry JM. Plant molecular diversity and applications to genomics. Curr Opin Plant Biol. 2002; 5: 107–111. PMID:11856604
16. Doebley J, Lukens L. Transcriptional regulators and the evolution of plant form. Plant Cell. 1998; 10: 1075–1082. PMID:9668128
17. Gu K, Yang B, Tian D, Wu L, Wang D, Sreekala C, et al. R-gene expression induced by a type-III effec-tor triggers disease resistance in rice. Nature. 2005; 435: 1122–1125. PMID:15973413
18. Romer P, Recht S, Lahaye T. A single plant resistance gene promoter engineered to recognize multiple TAL effectors from disparate pathogens. Proc Natl Acad Sci USA. 2009; 106: 20526–20531. doi:10. 1073/pnas.0908812106PMID:19910532
19. Khush GS, Bacalangco E, Ogawa T. A new gene for resistance to bacterial blight fromO. longistami-nata. Rice Genet Newsl. 1990; 7: 121–122.
20. Song W, Wang G, Chen L, Kim HS, Pi LY, Holsten T, et al. () A receptor kinase-like protein encoded by the rice disease resistance gene,Xa21. Science. 1995; 270: 1804–1806. PMID:8525370
21. Sun X, Cao Y, Yang Z, Xu C, Li X, Wang S et al.Xa26, a gene conferring resistance toXanthomonas oryzaepv.oryzaein rice, encodes an LRR receptor kinase-like protein. Plant Jr. 2004; 37: 517–527.
22. Xiang Y, Cao Y, Xu C, Li X, Wang S.Xa3, conferring resistance for rice bacterial blight and encoding a receptor kinase-like protein, is the same asXa26. Theor Appl Genet. 2006; 113: 1347–1355. PMID:
16932879
23. Xu S, Cao Y, Li X, Wang S. Expressional and biochemical characterization of rice disease resistance gene Xa3/Xa26 family. Journal of Integr Plant Biol. 2007; 49: 852–862.
24. Iyer AS, McCouch SR. The rice bacterial blight resistance genexa5encodes a novel form of disease re-sistance. Mol Plant Microbe Interact. 2004; 17: 1348–1354. PMID:15597740
25. Jiang GH, Xia ZH, Zhou YL, Wan J, Li DY, Chen RS et al. Testifying the rice bacterial blight resistance genexa5by genetic complementation and further analyzingxa5(Xa5) in comparison with its homolog TFIIAgamma1. Mol Genet Genomics. 2006; 275: 354–366. PMID:16614777
26. Kauffman HE, Reddy APK, Hsieh SPY, Merca SD An improved technique for evaluating resistance of rice varieties toXanthomonas oryzae. Plant Dis Rep. 1973; 57: 537–541.
27. IRRI. Standard evaluation system for rice (SES). International Rice Research Institute, Manila. 2002.
29. Altschul SF, Gish W, Miller W, Myers EW, Lipman DJ. Basic local alignment search tool. Jr Mol Biol. 1990; 215: 403–410. PMID:2231712
30. Nei M, Li WH. Mathematical model for studying genetic variation in terms of restriction endonucleases. Proc Natl Acad Sci USA. 1979; 76: 5296–5273.
31. Watterson GA. On the number of segregating sites in genetical models without recombination. Theor Pop Biol. 1975; 7: 256–276.
32. Librado P, Rozas J. DnaSP v5: a software for comprehensive analysis of DNA polymorphism data. Bioinform. 2009; 25: 1451–1452.
33. Sievers F, Wilm A, Dineen D, Gibson TJ, Karplus K, Li W et al. Fast, scalable generation of high-quality protein multiple sequence alignments using Clustal Omega. Mol Syst Biol. 2011 Oct 11; 7: 539. doi:10. 1038/msb.2011.75PMID:21988835
34. Nei M, Gojobori T. Simple methods for estimating the numbers of synonymous and nonsynonymous nucleotide substitutions. Mol Biol Evol. 1986; 3: 418–426. PMID:3444411
35. Tajima F. Statistical method for testing the neutral mutation hypothesis by DNA polymorphism. Genet. 1989; 123: 585–595.
36. Fu YX, Li WH. Statistical tests of neutrality of mutations. Genet. 1993; 133: 693–709.
37. Tamura K, Dudley J, Nei M, Kumar S. MEGA4: Molecular Evolutionary Genetics Analysis (MEGA) soft-ware version 4.0. Mol Biol Evol. 2007; 24: 1596–1599. PMID:17488738
38. Ronald PC, Albano B, Tabien R, Abenes L, Wu K, McCouch S, Tanksley SD. Genetic and physical analysis of the rice bacterial blight disease resistance locus,Xa21. Mol Gen Genet. 1992; 236: 113– 120. PMID:1362973
39. Iyer-Pascuzzi AS, McCouch SR. Functional markers forxa5-mediated resistance in rice. Mol Breed. 2007; 19: 291–296.
40. Sun X, Cao Y, Yang Z, Xu C, Li X, Wang Set al.Xa26, a gene conferring resistance toXanthomonas oryzaepv.oryzaein rice, encodes an LRR receptor kinase-like protein. The Plant Jr. 2004; 37: 517– 527.
41. Mitsuhara I, Iwai T, Seo S, Yuki Y, Hiroyuki K, Sakino H et al. Characteristic expression of twelve rice
PR1family genes in response to pathogen infection, wounding, and defense-related signal com-pounds. Mol Genet Genomics. 2008; 279: 415–427. doi:10.1007/s00438-008-0322-9PMID:
18247056
42. Livak KJ, Schmittgen TD. Analysis of relative gene expression data using real-time quantitative PCR and the 2 [-Delta Delta C(T)] Method. Methods. 2001; 25: 402–408. PMID:11846609
43. Haseneyer G, Ravel C, Dardevet M, Balfourier F, Sourdille P, Charmet G et al. High level of conserva-tion between genes coding for the GAMYB transcripconserva-tion factor in barley (Hordeum vulgareL.) and bread wheat (Triticum aestivumL.) collections. Theor Appl Genet. 2008; 117: 321–331. doi:10.1007/ s00122-008-0777-4PMID:18488187
44. DRR.Directorate of Rice Research Progress Report, 2001, Vol. 2. Entomology and Pathology, All India Coordinated Rice Improvement Programme (ICAR), Directorate of Rice Research, Rajendranagar, Hy-derabad-500 030, A.P., India. 2002.
45. Lavanya B, Priyadarisini VB, Leenakmari S, Gnanamanickam SS, Levy M. Lineage-exclusion resis-tance breeding: pyramiding of blast and bacterial blight resisresis-tance genes for rice disease management in India. In: Page 21 Proc. 7thNatl. Rice Biotechnology Network Meeting, Oct 25–29, 1998, UAS-NCBS, Bangalore, India.
46. Goel RK, Kaur L, Saini RG. Effectiveness of different Xa genes against Xanthomonas oryzae pv. ory-zae population causing bacterial blight of rice in Punjab (India). Rice Genet Newslet. 1998; 15: 131– 133.
47. Bustamam M, Yunus M, Hifni HR, Baroidan M, Ardales EY, Nelson RJ. Population structure of the rice bacterial pathogen,Xanthomonas oryzaepv.oryzaein Java and Bali, Indonesia. In: Pages 107, Proc. Of the 3rdAsia-Pacific Conf. on Agricultural Biotechnology: Issues and Choices. 1996 Nov 10
–15, Pra-chuapkhirikhan, Thailand.
48. Ochiai H, Horino O, Miyajima K, Kaku H. Genetic diversity ofXanthomonas oryzaepv.oryzaestrains from Sri Lanka. Phytopathol. 2000; 90: 415–421.
49. Mauricio R, Stahl EA, Korves T, Tian D, Kreitman M, Bergelson J. Natural selection for polymorphism in the disease resistance geneRps2ofArabidopsis thaliana. Genet. 2003; 163: 735–746.
51. Rose LE, Bittner Eddy PD, Langley CH, Holub EB, Michelmore RW, Beynon JL. The maintenance of extreme amino acid diversity at the disease resistance gene,RPP13, inArabidopsis thaliana. Genet. 2004; 166: 1517–1527. PMID:15082565
52. Zhu Q, Zheng X, Luo J, Gaut BS, Ge S. Multilocus analysis of nucleotide variation ofOryza sativaand its wild relatives: Severe bottleneck during domestication of rice. Mol Biol Evol. 2007; 24: 875–882. PMID:17218640
53. Eyre Walker A, Gaut RL, Hilton H, Feldman DL, Gaut BS. Investigation of the bottleneck leading to the domestication of maize. Proc Natl Acad Sci USA. 1998; 95: 4441–4446. PMID:9539756
54. Buckler ES, Thornsberry JM, Kresovich S. Molecular Diversity, Structure and Domestication of Grasses. Genet Res. 2001; 77: 213–218. PMID:11486504
55. Small RL, Wendel JF. Copy number lability and evolutionary dynamics of theAdhgene family in diploid and tetraploid cotton (Gossypium). Genet 2000; 155: 1913–1926. PMID:10924485
56. Haldane JBS. Disease and evolution. Ricerca Science Supplement. 1949; 19: 3–10.
57. Kowalczuk M, Mackiewicz P, Mackiewicz D, Nowicka A, Dudkiewicz M, Dudek MR et al. DNA asymme-try and the replicational mutational pressure. J Appl Genet. 2001; 42: 553–577. PMID:14564030 58. Blouin MS, Yowell CA, Courtney CH, Dame JB. Substitution bias, rapid saturation, and the use of
mtDNA for nematode systematic. Mol Biol Evol. 1998; 15: 1719–1727. PMID:9866206
59. Petrov DA, Hartl DL. Patterns of nucleotide substitution in Drosophila and mammalian genomes. Proc Natl Acad Sci USA. 1999; 96: 1475–1479. PMID:9990048
60. Olmstead RG, Reeves PA, Yen AC. Patterns of sequence evolution and implications for parsimony analysis of chloroplast DNA. In: Soltis DE, Soltis PS, Doyle JJ, editors. Molecular systematics of plants II: Kluwer Academic, London; 1998. pp. 164–187.
61. Gu K, Tian D, Qiu C, Yin Z. Transcription activator-like type III effector AvrXa27 depends onOsTFIIAg5
for the activation ofXa27transcription in rice that triggers disease resistance toXanthomonas oryzae
pv.oryzae. Mol Plant Pathol. 2009; 10: 829–835. doi:10.1111/j.1364-3703.2009.00567.xPMID: