151103-PD-2016 (9 páginas)
PROVA GRÁFICA
BENEMANN, D.P.1*
NOHATO, A.M.1
VARGAS, L.2
AVILA, L.A.1
AGOSTINETTO, D.1 Article
PLANTA DANINHA
* Corresponding author: <[email protected]>
Received: March 18, 2016 Approved: May 19, 2016
Planta Daninha 2017; v35:e017161319
SOCIEDADE BRASILEIRA DA CIÊNCIA DAS PLANTAS DANINHAS
1 Universidade Federal de Pelotas, Pelotas-RS, Brazil; 2 Embrapa Wheat, Passo Fundo-RS, Brazil.
Doi: 10.1590/S0100-83582017350100015
ISSN 0100-8358 (print)
1806-9681 (online)
<http://www.sbcpd.org>
I
DENTIFICATION ANDV
ALIDATION OFR
EFERENCEG
ENESFOR THE
N
ORMALIZATION INR
EAL-T
IMERT-
QPCR
ONR
ICE ANDR
EDR
ICE INC
OMPETITION,
UNDERD
IFFERENTN
ITROGEND
OSESIdentificação e Validação de Genes de Referência para a Normalização no
Real-Time RT-qPCR em Arroz e Arroz Vermelho em Competição, sob Diferentes
Doses de Nitrogênio
ABSTRACT - Real time reverse transcription polymerase chain reaction (RT-qPCR) is an important technique to analyze differences in gene expression due to its sensitivity, accuracy, and specificity. However, before analyzing the expression of the target gene, it is necessary to identify and evaluate the stability of candidate reference genes for the proper normalization. This study aimed at evaluating the stability of candidate reference genes in order to identify the most appropriate genes for the normalization of the transcription in rice and red rice in competition under different nitrogen levels, as well as to demonstrate the effectiveness of the reference gene selected for the expression of the cytosolic ascorbate peroxidase (OsAPX2). Eleven candidate reference genes were assessed using the RefFinder which integrates the four leading software: geNorm, NormFinder, Bestkeeper, and the comparative delta-Ct method in addition to the analysis of variance to identify genes with lower standard deviation and coefficient of variation values. Eight out of the eleven genes have shown the desired effectiveness and, among them, the gene UBC-E2 has the highest stability according to RefFinder and the analysis of variance. The expression of the gene OsAPX2 has proven to be effective in validating the candidate reference gene. This study is the first survey on the stability of candidate reference genes in rice and red rice in competition, providing information to obtain more accurate results in RT-qPCR.
Keywords: Oryza sativa, gene expression, normalization.
com menores valores de desvio-padrão e coeficiente de variação. Dos 11 genes, oito apresentaram eficiência dentro do padrão desejado, e, destes, o gene UBC-E2 foi o mais estável. A expressão do gene OsAPX2 mostrou-se eficiente para validação do gene candidato a referência. Este estudo é o primeiro levantamento sobre a estabilidade de genes de referência em arroz e arroz-vermelho em competição, fornecendo informações para obtenção de resultados mais precisos em RT-qPCR.
Palavras-chave: Oryza sativa, expressão gênica, normalização.
INTRODUCTION
The analysis of gene expression is essential to understand several aspects of plant biology (Martin et al., 2008). The real time reverse polymerase chain reaction is currently one of the most powerful and sensitive techniques for the analysis of gene expression and it contributes to substantially improve the understanding of the signaling, development of metabolic pathways and cell processes (Paolacci et al., 2009). The reliable quantification through the analysis of real-time RT-qPCR of gene expression levels requires the normalization and control of many parameters, such as: initial sample size, RNA integrity, enzymatic efficiency of cDNA synthesis and PCR amplification and the transcriptional activity of tissue and cells analyzed (Bustin, 2002; Ginzinger, 2002). For the normalization, the use of internal control genes (reference genes) is the most reliable and convenient method to estimate the amount of initial RNA (Thellin et al., 1999), as well as to reduce possible errors made in quantifying the expression of the gene, which is obtained by comparing the expression levels in samples of the gene of interest and the genes constituting stable control (Paolacci et al., 2009).
It is likely that one or more genes are expressed constitutively in a specific organ an environment (Andersen et al., 2004). Thus, the systematic selection and validation of reference genes should be performed prior to all real-time RT-qPCR analyses (Gutierrez et al., 2008). Some genes are usually designated as reference genes due to their roles in basic cell processes, primary metabolism, and maintenance of cell structure (Czechowski et al., 2005; Wong and Medrano, 2005).
So, reference genes traditionally used in real-time RT-qPCR studies on plants include actine (Maroufi et al., 2010), tubulin (Wan et al., 2010), ubiquitin (Chen et al., 2011), 18S ribosomal RNA (Jain et al., 2006), and 40S ribosomal RNA (Cruz-Rus et al., 2011). Therefore, the reliability of the results of gene expression depends on the use of reference genes suitable for culturing and study conditions. To date, studies on reference genes in weeds are scarce and only a few reference genes have been validated under herbicide stress in a study regarding Alopecurus myosuroides and herbicides inhibitors of acetyl-CoA (Petit et al., 2012) and acetolactate-synthase in Lolium sp. (Duhoux and Délye, 2013).
Among the factors that have direct interference in a cropping process, the presence of weeds stands out due to the competition for resources. The competition may be either intra or interspecific, when one or more resources required to the development and growth are limited to meet the needs of all individuals present in the environment (Radosevich et al., 2007).
In the present study, we assessed the stability of candidate reference genes in order to identify the most appropriate genes for the normalization of the transcription in rice and red rice competing under different nitrogen levels and demonstrate the effectiveness of the reference gene selected by the expression of the cytosolic ascorbate peroxidase (OsAPX2) which is a key enzyme in the antioxidant metabolism.
MATERIAL AND METHODS
Plant material and experimental conditions
We used the rice cultivar IRGA 424 and a red rice biotype, varying the ratio of plants per pot (with no (100:0) and with (50:50) competition). The soil was added with different nitrogen dosages (0, 120, and 240 kg N ha-1). Sixty days after germination, we collected the shoots of plants, stored
Total RNA extraction and cDNA synthesis
The total RNA was extracted from the leaves of rice and red rice using the reagent PureLink™ (Plant RNA Reagent – Invitrogen™), as recommended by the manufacturer. The cDNAs were obtained by using the commercial kit SuperScript First-Strand System for real-time RT-qPCR (Invitrogen™), following the manufacturer’s recommendations. The quantity and quality of RNA were evaluated by agarose gel electrophoresis 1% (p/v). The quantity and purity of RNA were determined by using a spectrophotometer NanoDrop™ 2000 (Thermo Scientific) with 260/280 nm ratio in the 1.9 to 2.2 interval and 260/230 nm around 2.0 considered as acceptable for use in real-time RT-qPCR.
Determination of reference and target genes and Real-Time PCR conditions
For reference genes, we selected 11 primer pairs, mentioned in literature in studies on rice and used as internal control in real-time RT-qPCR analyses and that supposedly showed no significant variation among the treatments analyzed (Table 1). In order to validate the reference gene, we used the ascorbate peroxidase gene (OsAPX2- EC1.11.1.11), Foward (5’AGAGTCAGTACGATCAAGAC3’) and Reverse (5’TCTTGACAGCAAATAGCTTGG3’) (Zhang and Hu, 2009).
For the amplification reaction, we used a total volume of 12 µL, containing 6.25 µL LightCycler®
480 SYBR Green I Master (Roche Applied Science), 0.5 µM primer (10 mM), 1 µL cDNA (0.2 µg) and water in an amount to complete the final volume. The amplification conditions were as follows: one cycle of 95 oC (5 min), followed by 45 cycles of denaturation at 95 oC (20 s), 60 oC (15 s), and
72 oC (20 s), interrupted by the dissociation curve with denaturation at 95 oC (5 s), cooling at
70 oC (1 min) and gradually heating at 0.11 oC steps up to 95 oC and cooling at 40 oC (30 s), using
the system LightCycler 480 (Roche Applied Science). All reactions were carried out in triplicate for each cDNA sample. The amplicon purity was determined when a single melting peak was reached.
Effectiveness and analysis of stability expression of reference genes
The PCR effectiveness was obtained from four serial dilutions of cDNA (1:1, 1:5, 1:25, and 1:125) to generate the standard slope for each pair of primer tested. The value of E was estimated by the equation E = 10(-1/slope) (Rasmussen, 2001), and values of effectiveness between 1.8 and 2.2
were considered as acceptable for reference genes.
To classify and determine the performance of each reference gene were used the average Ct values for each test sample obtained by each reaction cycle in real-time RT-qPCR. Data were subjected to analysis of variance, using the Statistical Analysis System - Winstat - Version 2.0
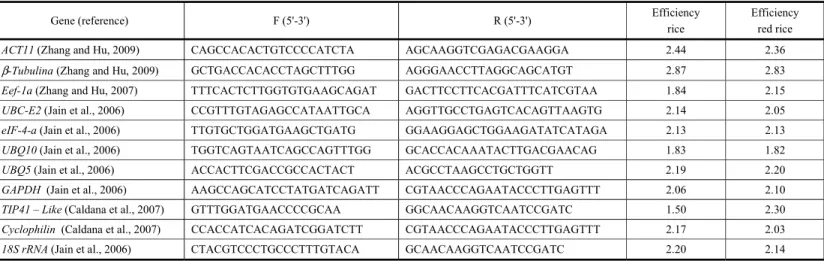
Table 1 - Relation of reference primers used for real-time RT-qPCR in rice and red rice in response to the stress caused by competition and nitrogen levels
Gene (reference) F (5'-3') R (5'-3') Efficiency
rice
Efficiency red rice
ACT11 (Zhang and Hu, 2009) CAGCCACACTGTCCCCATCTA AGCAAGGTCGAGACGAAGGA 2.44 2.36
β-Tubulina (Zhang and Hu, 2009) GCTGACCACACCTAGCTTTGG AGGGAACCTTAGGCAGCATGT 2.87 2.83
Eef-1a (Zhang and Hu, 2007) TTTCACTCTTGGTGTGAAGCAGAT GACTTCCTTCACGATTTCATCGTAA 1.84 2.15
UBC-E2 (Jain et al., 2006) CCGTTTGTAGAGCCATAATTGCA AGGTTGCCTGAGTCACAGTTAAGTG 2.14 2.05
eIF-4-a (Jain et al., 2006) TTGTGCTGGATGAAGCTGATG GGAAGGAGCTGGAAGATATCATAGA 2.13 2.13
UBQ10 (Jain et al., 2006) TGGTCAGTAATCAGCCAGTTTGG GCACCACAAATACTTGACGAACAG 1.83 1.82
UBQ5 (Jain et al., 2006) ACCACTTCGACCGCCACTACT ACGCCTAAGCCTGCTGGTT 2.19 2.20
GAPDH (Jain et al., 2006) AAGCCAGCATCCTATGATCAGATT CGTAACCCAGAATACCCTTGAGTTT 2.06 2.10
TIP41 – Like (Caldana et al., 2007) GTTTGGATGAACCCCGCAA GGCAACAAGGTCAATCCGATC 1.50 2.30
Cyclophilin (Caldana et al., 2007) CCACCATCACAGATCGGATCTT CGTAACCCAGAATACCCTTGAGTTT 2.17 2.03
(Machado and Conceição, 2003). Were considered stable those genes with lower standard deviation and coefficient of variation. At the same time, we observed changes in the expression levels both in the crop and in the weed, using the web-based tool RefFinder (www.leonxie.com/ referencegene.php) which integrates all four software algorithms, GeNorm, NormFinder, BestKeeper, and comparative delta-Ct method. The detailed calculations for each one of the methods are described in Chen et al. (2011). The mean Ct value of each sample for each primer was used as input data on the website, and the Ct value belonging to the crop and the weed were analyzed altogether.
Validation of reference genes
In order to ensure the reliability of the potential reference gene, the expression profile of
OsAPX2 was measured and normalized with the most stable reference gene as determined by RedFinder and the analysis of variance. The amplification conditions by real-time RT-qPCR were the same as abovementioned. The relative expression of data were calculated using the formula QR=2-(∆CT), modified from that proposed by Pfaffl et al. (2002), which was subjected to the
analysis of variance (p ≤ 0.05) to test possible variations for the factors nitrogen, competition, and plant (rice and red rice), in isolation, as well as the interaction between both factors according to Tukey’s test (p ≤ 0.05).
RESULTS AND DISCUSSION
Effectiveness and stability of reference genes
The amplification effectiveness of reference genes was individually calculated from the logarithm (Log) of cDNA dilutions for the crop and the weed (Table 1). The most appropriate dilution for the sample amplification was 1:25 subsequently used to validate the target gene. The efficiency ranged from 1.5 to 2.87 for rice and from 1.82 to 3.45 to red rice. For both competitors, the endogenous genes 18S ribosomal RNA (18S), cyclophilin, eukaryote elongation factor 1-a
(Eef-1a), eukaryote initiation factor 4-a (eLF-4a), glyceraldehyde-3-phosphate dehydrogenase (GAPDH), ubiquitin-enzyme conjugate E2 (UBC-E2), ubiquitin 5 (UBQ5), and ubiquitin 10 (UBQ10) had their effectiveness as expected (between 1.8 and 2.2), and they were used to test the stability and, afterwards, the most stable one was used along with the target gene. On the other hand, the actin (ACT), beta tubulin (β-Tubulin), and aquaporin (TIP41) genes had effectiveness other than expected.
For the study of the stability, we analyzed the coefficient of variation (CV%), standard deviation (SD), and means (X) of reference genes of rice and red rice which had effectiveness between 1.80 and 2.20. For the crop, it was noticed that UBC-E2, UBQ10, and eLF-4a had the lowest CV (3.39, 4.14, and 3.45, respectively) and SD (0.94, 1.03, and 1.08, respectively) values, whereas for the weed the genes UBC-E2, UBQ5, and eLF-4a had lower CV (1.34, 1.57 and 2.18, respectively) and SD (0.38, 0.42 and 0.60, respectively) values, indicating higher stability expression (Table 2). In order to evaluate the stability expression of reference genes, in addition to the analysis of variance,
18S Cyclophilin Eef-1a EIf-4a GAPDH UBC-E2 UBQ5 UBQ10
X
Rice 18.08 29.92 32.01 31.30 27.41 28.79 27.00 32.92
Red rice 18.61 30.00 29.94 30.33 26.24 28.63 26.90 24.52
VC%
Rice 10.40 4.49 11.69 3.45 8.99 3.29 5.44 4.14
Red rice 9.41 2.63 2.51 2.18 2.96 1.34 1.57 3.11
SD
Rice 1.88 1.34 3.74 1.08 2.46 0.94 1.35 1.03
Red rice 1.75 0.78 0.75 0.60 0.77 0.38 0.42 0.76
we have also calculated and compared the mean stability expression (M) using the software geNorm, NormFinder, Bestkeeper, and comparative delta-Ct method through the web-based tool which provides stability rankings. The lower the geometric mean, the higher the stability expression of the reference gene, and M values exceeding the cut-off value of 1.5 are not considered to be stable among treatments (Chen et al., 2011).
The determination of the normalizing gene appropriate for the study of gene expression is the first step that allows the analysis of the relative expression pattern of interest and target genes in a given experiment, providing more reliability to the results obtained. The software GeNorm is based on the principle that the ratio between the expressions of two reference genes is supposed to be frequent across different experimental conditions and/or organs/tissue. The value of M is determined as the average variation of the gene compared to the other ones tested. Based on M values calculated for the eight candidate normalization genes for rice competing with red rice, it was observed that Cyclophilin (M=1.27) and UBC-E2 (M=1.27) were the most stable genes and 18S (M=1.67) and GAPDH (M=1.85) as the most variable ones (Figure 1A). For red rice, the genes eLF-4a (M=0.70) and UBC-E2 (M=0.70) were the most stable whereas UBQ10 (M=1.01) and 18S (M=1.37) were the least stable ones (Figure 2A).
According to the algorithm of NormFinder software which analyzes both intra and intergroup variations, the candidate genes in rice presenting the lowest M value are cyclophilin
(0.70) and UBC-E2 (M=0.81). The highest M values were for 18S (M=1.85) followed by GAPDH (M=2.11) (Figure 1B). The same was observed in red rice and the genes UBC-E2 (M=0.41) and cyclophilin
(M=0.49) were the most stable ones, whereas UBQ10 (M=1.23) and 18S (M=2.34), the least stable ones (Figure 2B).
The BestKeeper software algorithm calculates the standard deviation (SD) and establishes the value 1 as the cut-off (SD = 1), being considered as stable genes those with SD value lower than 1 (SD<1) and unstable those with values higher than 1 (SD>1). The analysis indicated only
UBQ5 as the most stable reference gene in rice presenting SD = 0.66, whereas the other genes were considered unstable (Figure 1C). For red rice, the most stable genes were UBQ5 (M=0.65),
UBC-E2 (M=0.77), cyclophilin (M=0.83), eLF-4a, and GAPDH (M=0.95), and the others did not present stability (Figure 2C).
According to the comparative delta Ct method, in rice, the genes cyclophilin (M=1.56) and
UBC-E2 (M=1.60) were the most stable and presented a stability expression order close to the GeNorm algorithm for the three first candidate normalization genes, even though it has shown different M values for each gene (Figure 1D). In red rice, the same genes, cyclophilin (M=1.09) and UBC-E2 (M=1.15), were the most stable ones, whereas UBQ10 and 18S (M=1.54 and 2.45, respectively) were the least stable ones (Figure 2D).
According to the general acceptance criteria, the ideal reference gene is stably expressed (or, at least, only slightly varying in the expression) among the sets of samples investigated and has an expression level compared to the target gene (Andersen et al., 2004). Appropriate reference genes have already been identified for many crops especially for model plants (Czechowski et al., 2005), however, a few reference genes have been validated for weeds because most of them are species with no genomic information available. Also, the extrapolation from other species even in taxa closely related is not indicated since the expression of putative reference genes varies between different sets of organs and different experimental conditions (Hruz et al., 2011), i.e., there is no universal reference gene.
Based on the results of effectiveness, analysis of variance and mean stability according to the combination of the algorithms GeNorm, NormFinder, Bestkeeper, and Comparative Ct method, the normalizing gene UBC-E2 was selected for rice and red rice. One of the three main components of the ubiquitination system is the ubiquitin-conjugating enzyme (UBC-E2) which bounds the ubiquitin (Ub) to the substrate (Unver et al., 2012). The ubiquitination is involved in many important processes such as plant growth and development, hormonal regulation, flowering, and responses to biotic and abiotic stresses (Dreher and Callis, 2007).
0 1 2 cycl ophi lin/U BC-E 2 UBQ 5 UBQ 10 eLf-4 a Eef-1 α 18S GAP DH A v er ag e st ab ilit y o f ex p ressio n
<--- Most stable genes Least stabe genes --->
Genorm 0 1 2 3 cycl ophi lin UBC -E2 UBQ 5 UBQ 10 eLf-4 a Eef-1 α 18S GAP DH A v er ag e st ab il it y o f ex p re ssio n
<--- Most stable genes Least stabe genes --->
Normfinder 0 1 2 UBQ 5 UBQ 10 UBC -E2 18S
Eef-1 α Cic loph ilin eLf-4 a GAP DH A v er ag e stab il ity o f e x p ressio n
<--- Most stable genes Least stabe genes --->
BestKeeper 0 1 2 3 cycl ophi lin UBC -E2 UBQ
5 UBQ
10 eLf-4
a Eef
-1α 18S GAP DH A v e ra g e s ta b il ity o f e xpr es si on
<--- Most stable genes Least stabe genes --->
Comparative Delta Ct
A B
C D
(A) (B)
(C) (D)
Figure 2 - Average stability expression. (M) according to the algorithm GeNorm (A), NormFinder (B), BestKeeper (C), and
comparative delta-Ct method of eight candidate normalization genes in red rice competing with rice in different ratios and nitrogen levels. 0 1 2 cycl ophi lin/U BC-E 2 UBQ 5 UBQ 10 eLf-4 a Eef-1 α 18S GAP DH A v er ag e s tab il it y o f ex p ressio n
<--- Most stable genes Least stabe genes --->
Genorm 0 1 2 3 cycl ophi lin UBC -E2 UBQ 5 UBQ 10 eLf-4 a Eef-1 α 18S GAP DH A v er ag e s tab il it y o f ex p ressio n
<--- Most stable genes Least stabe genes --->
Normfinder 0 1 2 UBQ 5 UBQ 10 UBC -E2 18S
Eef-1 α Cicl ophi lin eLf-4 a GAP DH A v er ag e stab ili ty o f e x p ressio n
<--- Most stable genes Least stabe genes --->
BestKeeper 0 1 2 3 cycl ophi lin UBC
-E2 UBQ
5 UBQ
10 eLf-4
a Eef
-1α 18S GAPD
H A v er ag e s tab il it y o f ex p ressio n
<--- Most stable genes Least stabe genes --->
Comparative Delta Ct
A B
C D
Figure 1 - Average stability expression (M) according to the algorithm GeNorm (A), NormFinder (B), BestKeeper (C), and
comparative delta-Ct method (D) of eight candidate normalization genes in rice competing with red rice in different ratios and nitrogen levels.
(A) (B)
(C) (D)
Average stability of expression
Average stability of expression Average stability of expression
Average stability of expression Average stability of expression
Average stability of expression Average stability of expression
UBQ10 exhibited the least stable expression in different tissues or cell types at different developmental stages (Jain et al., 2006). This result differs from that observed in this study, since the gene UBC-E2 was the most stable one, presenting low CV, SD, and M values, indicating higher stability expression both for rice and red rice. Nevertheless, Li et al. (2012) by submitting rubber tree (Hevea brasiliensis) to different conditions found the gene UBC as the most stable of several tested. The reference genes are regulated differently in different plant species and may exhibit distinct expression patterns. Therefore, a reference gene presenting stable expression in an organism may or may not be appropriate for the normalization of gene expression in another organism in a set of conditions and needs to be validated before its use (Jain et al., 2006). Several studies have shown that the expression of a same reference gene may vary in certain situations (Thellin et al., 1999). This may be partly explained by the fact that reference genes are not only implicated in the metabolism of basal cells, but also taking part in other cell functions (Singh and Green, 1993; Ishitani et al., 1996).
Validation of the reference gene – Expression of OsAPX2
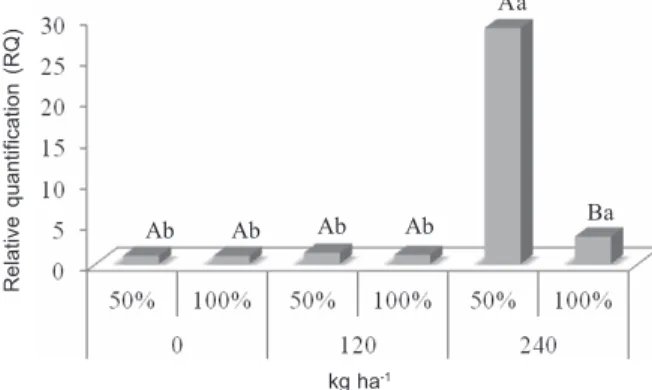
For the gene OsAPX2 in rice competing with red rice, there was no interaction between the factors tested, only an effect of nitrogen dose with an increased expression in the dosage 240 kg ha-1
nitrogen (QR=3.43), differing from 0 kg ha-1 (QR=1.00) and 120 kg ha-1 (QR=0.90) (Figure 3).
In red rice, there was an interaction between the factors tested for the expression of the gene OsAPX2 showing higher expression of the gene in the dosage 240 kg ha-1 and 50%
ratio in comparison to the monoculture (QR=3.34), and no differences between the ratios in the dosages 0 kg ha-1 and 240 kg ha-1
(Figure 4).
The APXs are the main peroxidases removing H2O2 inside cells and act along with other enzymes which play a role in the ascorbate-glutathione cycle (Foyer and Noctor, 2000). The APX may have an increased activity in response to environmental stresses such as salinity, low temperatures, metal poisoning, drought, high temperatures, ozone, high luminous intensity, pathogens, among others, as reported for different plant species (Yoshimura et al., 2000; Mittova et al., 2004; Sharma and Dubey, 2004). When rice and red rice were in an interspecific competition, subjected to the dosage of 240 kg ha-1 nitrogen,
the expression of the gene OsAPX2 increased, indicating a possible greater oxidative stress. According to Kandlbinder et al. (2003), the excess of nitrogen could promote an increase of APX in rice.
Based on results of effectiveness, analysis of variance and Reference Finder, the normalizing gene UBC-E2 was selected for rice and red rice in competition. The expression of the gene OsAPX2 has proven to be effective in validating the candidate reference gene. The study is of great importance in other gene expression analyses aiming at understanding the mechanisms of competitive stress tolerance in rice and red rice plants.
Upper-case letters are comparisons of nitrogen doses.
Figure 3 - Relative quantification of OsAPX2 gene expression
in rice competing with red rice under different nitrogen doses.
Relative quantification (RQ)
kg ha-1
Upper-case letters are comparisons of plant ratios within nitrogen doses and lower-case letters are comparisons of nitrogen doses within plant ratios.
Figure 4 - Relative quantification of OsAPX2 gene expression
in red rice competing with rice in different ratios and nitrogen doses.
Relative quantification (RQ)
A
B B
Ab Ba
kg ha-1
Ab Ab Ab
ACKNOWLEDGEMENTS
The authors are thankful for the financial support provided by DECIT/SCTIE-MS through CNPq and FAPERGS.
REFERENCES
Andersen C.L, Jensen J.L, Orntoft T.F. Normalization of real-time quantitative reverse transcription-PCR data: A model-based variance estimation approach to identify genes suited for normalization, applied to bladder and colon cancer data sets. Cancer Res. 2004;64:5245-50.
Bustin S.A. Quantification of mRNA using real-time reverse transcription PCR RT-PCR: trends and problems. J Molec
Endocrinol. 2002;29:23-9.
Caldana C. et al. A quantitative RT-PCR platform for higt-throughput expression profiling of 2500 rice transcription factors. Plant Meth. 2007;3:1-9.
Chen D.L. et al. Evaluation and identification of reliable reference genes for pharmacogenomics, toxicogenomics, and small RNA expression analysis. J Cell Physiol. 2011;226:2469-77.
Cruz-Rus E. et al. Regulation of L-ascorbic acid content in strawberry fruits. J Exp Bot. 2011;62:4191-201.
Czechowski T. et al. Genome-Wide Identification and Testing of Superior Reference Genes for Transcript Normalization in Arabidopsis. Plant Physiol. 2005;139:5-17.
Dreher K, Callis J. Ubiquitin, hormones and biotic stress in plants. Ann Bot. 99;2007:787-822.
Duhoux A, Délye C. Reference genes to study herbicide stress response in Lolium sp.: Up-regulation of P450 genes in plants resistant to acetolactate-synthase inhibitors. PLoS one. 2013;8: e63576.
Foyer C.H., Noctor G. Oxygen processing in photosynthesis: Regulation and signaling. New Phytol. 2000;146:359-88.
Ginzinger D.G. Gene quantification using real-time quantitative PCR: an emerging technology hits the mainstream. Exp Hematol.
2002;30:503-12.
Gutierrez L. et al. Towards a systematic validation of references in real-time RT-PCR. Plant Cell. 2008;20:1734-5.
Hruz T. et al. RefGenes: identification of reliable and condition specific reference genes for RT-qPCR data normalization. BMC
Genomics. 2011;12:156.
Ishitani R. et al. Evidence that glyceraldehydes-3-phosphate dehydrogenase is involved in age-induced apoptosis in mature cerebellar neurons in culture. J Neurochem. 1996;66;928-35.
Jain M. et al. Validation of housekeeping genes as internal control for studying gene expression in rice by quantitative real-time PCR. Biochem Biophys Res Comm. 2006;345:646-51.
Kandlbinder A. et al. The antioxidant status of photosynthesizing leaves under nutrient deficiency: redox regulation, gene expression and antioxidant activity in Arabidopsis thaliana. Physiol Plant. 2004;120:63-73.
Li S.M., Bao-Zhen L.I, Wei-Ming S. Expression patterns of nine ammonium transporters in rice in response to n status.
Pedosphere. 2012;22:860-9.
Machado A.A., Conceição A.R. Sistema de análise estatística para Windows. WinStat. Versão 2.0. Pelotas: Universidade Federal de Pelotas, 2003.
Maroufi A., van Bockstaele E., De-Loose M. Validation of reference genes for gene expression analysis in chicory (Cichorium intybus) using quantitative real-time PCR. BMC Molec Biol. 2010;11:15.
Mittova V. et al. Comparison of mitochondrial ascorbate peroxidase in the cultivated tomate, Lycopersicon esculentum, and its wild, salt – tolerant relative, L. penellii – a role for matrix isoforms in protection against oxidative damage. Plant Cell Environ.
2004;27:237-50.
Paolacci A.R. et al. Identification and validation of reference genes for quantitative RT-PCR normalization in wheat. BMC Molec Biol. 2009;10:11.
Petit C. et al. Validation of a set of reference genes to study response to herbicide stress in grasses. BMC Res. Notes. 2012;5:18.
Pfaffl M.W., Horgan G.W., Dempfle L. Relative expression algoritimo tool (REST) for group-wise comparison and statistical analysis of relative expression results in real-time PCR. Nucleic Acids Res. 2002;30:1-10.
Radosevich S.R., Holt J.S., Ghersa C.M. Ecology of weeds and invasive plants: relationship to agriculture and natural
resource management. 3rd. ed. Hoboken: Wiley, 2007. 454p.
Rasmussen R.P. Quantification on the Light Cycler. In: Meuer S., Wittwer C.T., Nakagawara K. (eds) Rapid Cycle Real-time
PCR, Methods and Applications. 1st edition. Springer Press, Heidelberg, 2001, 21-34p
Sharma P., Dubey R.S. Ascorbato peroxidase from rice seedlings: properties of enzyme isoforms, effects of stresses and protective roles of osmolytes. Plant Sci. 2004;167:541-50.
Singh R., Green M.R. Sequence-specific binding of transfer RNA by glyceraldehyde-3-phosphate dehydrogenase. Science. 1993;259:365-8.
Thellin O. et al. Housekeeping genes as internal standards: use and limits. J Biotechnol. 1999;75:291-5.
Unver T. et al. In planta evidence for the involvement of a ubiquitin conjugating enzyme (UBC E2 clade) in negative regulation of disease resistance. Plant Mol Biol Rep. 2012;31: 323-334.
Wan H. et al. Selection of appropriate reference genes for gene expression studies by quantitative real-time polymerase chain reaction in cucumber. Anal Biochem. 2010;399:257-61.
Wong M.L., Medrano J.F. Real-time PCR for mRNA quantitation. BioTechn. 2005;39:75-85.
Yoshimura K. et al. Expression of spinach ascorbate peroxidase isoenzymes in response to oxidative stresses. Plant Physiol.
2000;123:223-33.