© 2012 Museu de Ciències Naturals de Barcelona ISSN: 1578–665X
Herrando, S., Weiserbs, A., Quesada, J., Ferrer X. & Paquet J.–Y., 2012. Development of urban bird indica-tors using data from monitoring schemes in two large European cities. Animal Biodiversiy and Conservation, 35.1: 141–150.
Abstract
Development of urban bird indicators using data from monitoring schemes in two large European cities.— Bird monitoring projects have provided valuable data for developing biological indicators to evaluate the state of natural and agricultural habitats. However, fewer advances have been made in urban environments. In this study we used bird monitoring data from 2002 to 2012 in two cities with different climates (Brussels and Bar-celona), to generate two multi–species urban indicators to evaluate temporal trends on abundance of urban avifauna. To do this we used two different conceptual approaches, one based on a list of widespread species in European cities (WSEC) and another based exclusively on species widespread at city level (WCS) regard-less of the birds occurring in other cities. The two indicators gave a similar general pattern, although we found a 3% difference in the mean annual change in both cities, thus suggesting that the values provided by urban indicators may differ depending on the conceptual approach and, hence, by the species list used to generate them. However, both indicators may have their own value and could be treated as complementary indices. Key words: Urban indicator, Biodiversity, Bird monitoring, Species selection, Barcelona, Brussels.
Resumen
Desarrollo de indicadores de aves urbanas a partir de datos de sistemas de monitoreo en dos grandes ciu-dades europeas.— Los proyectos de monitoreo de aves han proporcionado datos valiosos para el desarrollo de indicadores biológicos que evalúan el estado de los hábitats naturales y agrícolas; sin embargo, los avances han sido menores en los ambientes urbanos. En este estudio se utilizaron los datos del monitoreo de aves de dos ciudades climáticamente diferentes (Bruselas y Barcelona; período 2002–2010) para generar dos indicadores urbanos multiespecíicos que valorasen las tendencias temporales en la abundancia del conjunto de las aves urbanas. Para hacer esto, utilizamos dos enfoques conceptuales distintos, uno basado en una lista de especies de amplia distribución en las ciudades europeas (WSEC) y otro basado exclusivamente en especies de amplia distribución a nivel de ciudad (WSC), independientemente de las aves de otras ciudades. Los dos indicadores dieron un patrón general similar, aunque un 3% de diferencia entre ellos en cuanto a los valores de cambio promedio anual se encontró en ambas ciudades. Esto sugiere que los valores producidos por los indicadores urbanos pueden diferir dependiendo de la aproximación conceptual y, por tanto, por la lista de especies utilizada para generarlos. Ambos indicadores pueden tener su propio interés y pueden ser tratados como complementarios.
Palabras clave: Indicador urbano, Biodiversidad, Monitoreo de aves, Selección de especies, Barcelona, Bruselas. (Received: 20 I 12; Conditional acceptance: 9 V 12; Final acceptance: 20 VI 12)
Sergi Herrando, Catalan Ornithological Inst., Natural History Museum of Barcelona, Psg. Picasso s/n., E–08003 Barcelona (Spain).– Anne Weiserbs & Jean–Yves Paquet,Aves–Natagora, Rue Nanon 98, 5000 Namur (Bel-gium).– Javier Quesada, Natural History Museum of Barcelona. Psg. Picasso s/n., E–08003 Barcelona (Spain).– Xavier Ferrer, Dept. of Animal Biology, Univ. of Barcelona, Av. Diagonal 645, E–08028 Barcelona (Spain). Corresponding author: S. Herrando. E–mail: ornitologia@ornitologia.org
Development of urban bird indicators
using data from monitoring schemes
in two large European cities
Thanks to the many large–scale monitoring schemes, birds currently constitute one of the backbones of biodiversity monitoring in Europe (Schmeller, 2008). Many institutions run volunteer–based bird monito-ring projects at national or regional level. Trends of European common birds are updated annually within the framework of the Pan–European Common Bird Monitoring Scheme, which combines the results of these projects to provide trends at a continental scale for 145 common bird species (Voříšek et al., 2008; PECBMS, 2011). Data on trends in bird populations have been increasingly used in recent times to develop indicators of environmental health (Gregory et al., 2005), since experience shows that habitats in which bird numbers are declining tend also to be losing species belonging to other faunal groups (e.g. Robinson & Sutherland, 2002). This has led to the launch of a policy to devise relevant synthetic indicators, and the Farmland Bird Index has even been included in EUROSTAT as one of the continent’s sustainability indicators (http://epp. eurostat.ec.europa.eu).
To date, indicators of environmental health for particular habitats have been developed basically for farmland and woodland ecosystems (PECBMS, 2011). Nevertheless, as most human population in Europe live in urban centres, the development of indicators of the biodiversity in cities and towns would also seem to be relevant. These indicators may be an important tool to measure the process of adaptation of biodiversity in this new environment, and also to determine the readiness of design and planning in urban areas to harbour biological diversity (Adams et al., 2006). This is particularly important if we consider that urban habitats grow year after year. Furthermore, given the extent of city environments in Europe and their inluence on the quality of life and education of urban dwellers, the development of such indicators may also facilitate the preservation of biodiversity in more natural ecosystems (Savard et al., 2000; Fuller et al., 2009).
Generation of an urban indicator based on bird monitoring data has traditionally been hindered by the deinition of the urban ecology of species. European cities and towns provide suitable habitats for many bird species (Kelcey & Rheinwald, 2005; Caula et al., 2010). Most of these species are generalists that can be found in other environments (Clergeau et al., 2006; Devictor et al., 2007) and have only relatively recently colonized and adapted to urban areas (Blair, 1996; Evans et al., 2009; Møller, 2009; Sattler et al., 2010). Thus, they could be described as ‘urban adapters’. Also, in a few cases, this process of colo-nization has led to a shift in a species’ populations in urban areas to a degree that their numbers have become higher than in nearby natural areas (Blair, 1996); these species could be referred to as ‘urban exploiters’. Using this latter quantitative concept, several attempts have been made to classify species as elements of a multi–species urban indicator (e.g. DEFRA, 2002; Zbinden et al., 2005; SEO/BirdLife,
means that the list of urban species is very short and mostly contains those species that use buildings for nesting (e.g. House Martin Delichon urbicum, House Sparrow Passer domesticus, Common Swift Apus apus and Feral Pigeon Columba livia). Yet, the largest proportion of urban bird richness comes from greener urban habitats such as parks, avenues with trees, and gardens (Kelcey & Rheinwald, 2005). Indicators of urban biodiversity should therefore probably include not only the ‘exploiters’ but also, in some way, the ‘adapters’. The inclusion or otherwise of the ‘urban adapters’ in the indicator list is a crucial question, since many of the species inhabiting both urban and other habitats have different behavioural traits that could imply different population dynamics (Adams et al., 2006). Consequently, the development of bird indicators for urban areas is complicated by the choice of an appropriate species set whose numbers show what is happening speciically in urban areas and at the same time, also represent urban bird biodiversity as a whole.
An urban bird indicator may have more than one objective and serve to highlight the health of urban bird populations, changes in populations of special conservation interest, the degree of ‘urbanization’ of the local avifauna, or the impact of certain environ-mental pressures. As shown by Gregory et al. (2005) for farmland indicators, common birds could be good candidates for developing bird indicators aimed at evaluating the general state of urban bird populations. In addition, bird species may provide information as a proxy for the state of other taxa in urban gradients (e.g. Blair, 1999; but see Gagné & Fahrig, 2011). This framework could be particularly useful for the study of European urban areas and, in particular, the large cities where breeding bird monitoring projects are currently carried out.
birds (in a set of cities), while the latter is more about the state of urban birds in a speciic city and refers to environmental conditions in speciic cities.
In this study we developed two multi–species indicators as a means of advancing towards the generation of an urban indicator aimed at revea-ling the response of urban birds to the overall environmental changes occurring in urban habitats. Speciically, we calculated and compared these two indicators (widespread species in European cities and widespread species in each particular city) using bird monitoring data from Brussels (Belgium) and Barcelona (Catalonia, Spain). We also discuss their outcomes in the light of the methodological limitations and applications.
Material and methods
Study areas
Taking into account that the driving forces affecting species dynamics can be very distinct inside and outside cities (Adams et al., 2006), we generated urban bird indicators using data collected exclusively inside cities and rejected data from agricultural and natural areas from outside cities (peri–urban areas). We believe that the cities of Brussels and Barcelona represent an interesting study framework given their distinct biogeographical locations within Europe, the former in the Eurosiberian region and the latter in the Mediterranean.
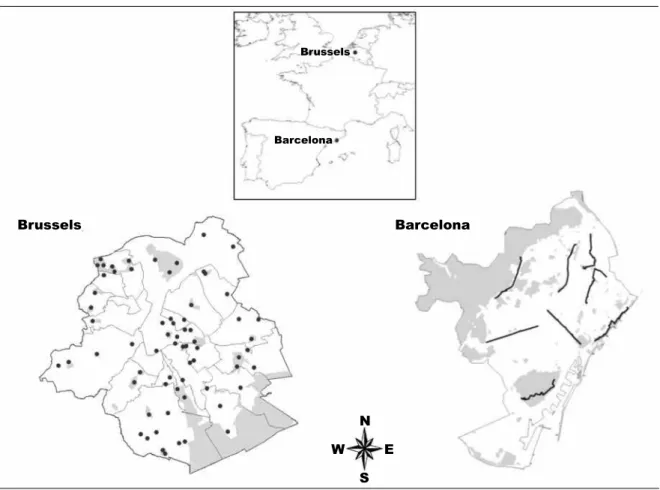
Fig. 1. Location of the sampling plots: point-counts in Brussels, and line-transects in Barcelona. Grey areas correspond to green spaces; in the case of Brussels, the grey area to the south is the Forest de Soignes, while in Barcelona, Collserola Natural Park lies to the north–west. Sampling plots located in these two natural areas were excluded from the analyses and only plots situated in the built-up areas and urban parks are shown.
Fig. 1. Localización de las áreas de muestreo: estaciones de escucha en Bruselas y transectos lineales en Barcelona. Las áreas grises corresponden a espacios verdes, en el caso de Bruselas, el área gris situada al sur corresponde al bosque de Soignes, mientras que en Barcelona, Parque Natural de Coll-serola se encuentra al noroeste. Las áreas de muestreo situadas en estas dos áreas naturales fueron excluidas de los análisis y sólo se muestran aquellas que se encuentran en las áreas urbanizadas y los parques urbanos.
Brussels Barcelona
Brussels
Barcelona
Brussels is located close to the Atlantic coast of Europe (in the centre of Belgium; ig. 1). The city covers 162 km2 and contains a mosaic of districts
whose green spaces cover 53% of the territory (numerous parks, gardens, small woodlands and a large beech forest ‘the Forest of Soignes’, which represents a tenth of the Brussels’ surface area). Parks and gardens are often highly managed, with large lawns, even though the management of an ever–increasing part of public green spaces is beginning to take biodiversity into account. Most of the urban parks and woodland were planted with beech Fagus sylvatica, ash Fraxinus excelsior or a variety of exotic species at the end of the ninete-enth century and so most trees are today very old; active regeneration is under way. The neighbouring areas mainly consist of residential areas, farmland and small towns.
Changes in common bird populations in the Brus-sels region have been monitored using point–counts (Bibby et al., 2000) since 1992. In practice, 98 point– counts located mostly in green areas throughout the city are sampled twice a year during the breeding season (Weiserbs & Jacob, 2007). Given our aim of focusing on species living in urban habitats, the present analysis did not take into account the 31 points located in the Forest of Soignes. Thus, a total of 67 point–counts was used in this study, each of which was used as a sample unit in subsequent analyses (ig. 1).
Barcelona
Barcelona is located in the western Mediterranean Basin (north–east Spain; ig. 1). It covers 101 km2
and is dominated by built–up areas, although the Collserola Natural Park in the west of the city is a large natural area. Apart from this site, the network of green areas includes urban parks (mainly small, < 3 ha) scattered among buildings, and private gar-dens. In total (including Collserola), green spaces cover 36% of the city and its municipal area. Urban parks have a mixture of autochthonous and exotic plants, and many of the city’s streets are tree–lined. Trees in public parks and gardens were mainly planted from 1980 onwards. The city of Barcelona itself is at the centre of a highly urbanized metropolitan area covering 636 km2.
The monitoring of common birds in Barcelona star-ted in 2002. As in Brussels, censuses are conducstar-ted twice during the breeding season. The system adopted is the line–transect method (Bibby et al., 2000) and 11 3–km transects are currently conducted, all as part of the Catalan Common Bird Survey (SOCC) that covers the whole of Catalonia (NE Spain). In this study, we did not take into account the two transects located in Collserola Natural Park, nor a transect located in the large urban park of Montjuic for which some degree of spatial overlap occurs. Thus, a total of eight 3–km transects were taken into consideration, each one taken as a sample unit (ig. 1).
We calculated the trends of common species sepa-rately for each of the cities using the time–effects model of the TRIM program (Pannekoek & van Strien, 2005). In these analyses at species level, the period taken into account was 2002–2010, the years for which data was available for both monitoring projects. Every species for which the sample size was suficient was analysed by TRIM (with a minimum presence of 10 point counts in Brussels and four line–transects in Barcelona). However, introduced species (e.g. Red–necked Parakeet Psittacula krameri and Monk Parakeet Myiopsitta monachus) and feral pigeons (Columba livia), whose population dynamics are strongly inluenced either by exponential growth at the initial stages of invasion (Crooks, 2005) or by speciic management (Sol & Senar, 1995), were not included in the analyses. We also excluded swifts (Apus apus, A. pallidus and A. melba) because sampling bias probably existed (serious mobility and aggregation effects) in the censuses. Given their abundance, swifts could probably be a highly relevant species in an urban context, but a species–speciic monitoring scheme would have to be set up if data from these species were to be included in the analyses.
habitats of the city (widespread species in each city, hereafter WSC). This quantitative criterion selected the commoner species; scarcer species, while being po-tentially interesting urban indicators, are more dificult to monitor properly. For each of these two candidates (WSEC and WSC), we assessed two multi–species urban indicators for Brussels and Barcelona using the procedure developed by Gregory et al. (2005). In this approach, for a particular set of species a
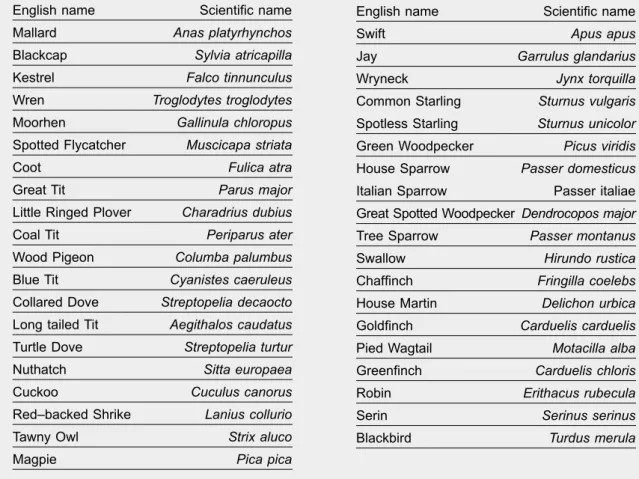
multi–species index for a given year can be obtained as the geometrical mean of the species population index obtained by TRIM, while standard errors can be obtained by a Taylor linearization of the nonlinear geometric mean (Gregory et al., 2005). The statistical signiicance of the changes shown by the indicators was evaluated using 95% conidence intervals (95% CI); if the 95% CI of a given annual value did not include the reference initial value of the temporal Table 1. Species considered in the widespread species in European cities (WSEC) urban index. This list of bird species was elaborated using the information compiled by Kelcey & Rheinwald (2005) for 16 European cities (St. Petersburg, Moscow, Warsaw, Lublin, Soia, Bratislava, Vienna, Prague, Berlin, Bonn, Hamburg, Brussels, Florence, Rome, Valencia and Lisbon). Speciically, the list includes 37 species breeding in at least 14 of the 16 cities (see Material and methods). In the cases of House Sparrow Passer domesticus and Italian Sparrow P. italiae, and Common Starling Sturnus vulgaris and Spotless Starling S. unicolor, these pairs of species were treated as one because of their very similar ecology and almost non–overlapping distributions.
Tabla 1. Especies consideradas en el indicador urbano de especies de amplia distribución en las ciudades europeas (WSEC). Esta lista de especies de aves fue elaborado utilizando la información recopilada por Kelcey & Rheinwald (2005) para 16 ciudades europeas (San Petersburgo, Moscú, Varsovia, Lublin, Sofía, Bratislava, Viena, Praga, Berlín, Bonn, Hamburgo, Bruselas, Florencia, Roma, Valencia y Lisboa). En concreto, la lista incluye 37 especies que se reproducen en al menos 14 de las 16 ciudades (ver Material y métodos). En el caso de gorrión común Passer domesticus y el gorrión italiano P. Italiae y de los estorninos pintos Sturnus vulgaris y negro S. unicolor, estos pares de especies fueron tratados como una sola a causa de su ecología muy similar y de que casi no se superponen las distribuciones.
English name Scientiic name
Mallard Anas platyrhynchos
Blackcap Sylvia atricapilla
Kestrel Falco tinnunculus
Wren Troglodytes troglodytes
Moorhen Gallinula chloropus
Spotted Flycatcher Muscicapa striata
Coot Fulica atra
Great Tit Parus major
Little Ringed Plover Charadrius dubius
Coal Tit Periparus ater
Wood Pigeon Columba palumbus
Blue Tit Cyanistes caeruleus
Collared Dove Streptopelia decaocto Long tailed Tit Aegithalos caudatus Turtle Dove Streptopelia turtur
Nuthatch Sitta europaea
Cuckoo Cuculus canorus
Red–backed Shrike Lanius collurio
Tawny Owl Strix aluco
Magpie Pica pica
English name Scientiic name
Swift Apus apus
Jay Garrulus glandarius
Wryneck Jynx torquilla
Common Starling Sturnus vulgaris Spotless Starling Sturnus unicolor Green Woodpecker Picus viridis House Sparrow Passer domesticus Italian Sparrow Passer italiae Great Spotted Woodpecker Dendrocopos major
Tree Sparrow Passer montanus
Swallow Hirundo rustica
Chafinch Fringilla coelebs
House Martin Delichon urbica
Goldinch Carduelis carduelis
Pied Wagtail Motacilla alba
Greeninch Carduelis chloris
Robin Erithacus rubecula
Serin Serinus serinus
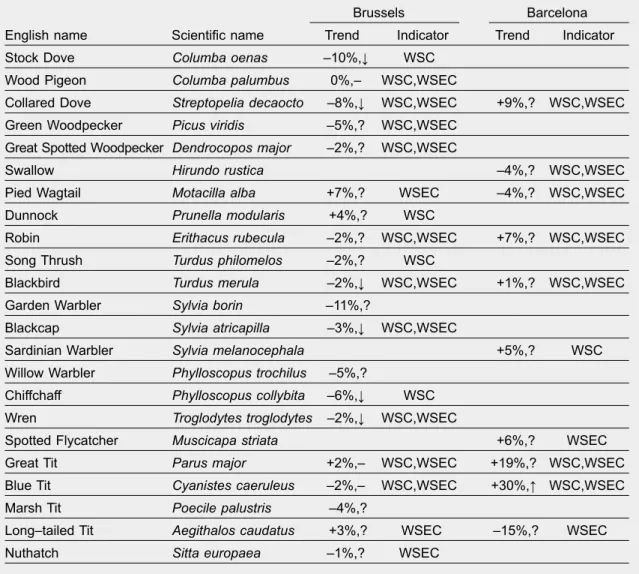
Table 2. Species with large enough sample size to be considered in the analyses of population trends in each city. The species that itted the criteria to be considered as widespread in European cities (WSEC) or widespread in each city (WSC) and that have been use to build these indicators are marked (see Materials and methods). According to the TRIM results (see Materials and methods), mean annual change (%) and signiicant decreases and increases over the period 2002–2010 are also marked: moderate decline (↓), moderate increase (↑), stable (–) and uncertain (?). These four trend categories follow the classiication reported in Pannekoek & Van Strien (2005), in which 'moderate decrease' and 'moderate increase' correspond to signiicant trends and 'stable' and 'uncertain' correspond to non–signiicant trends; species considered 'stable' were those for which their mean annual changes are clearly less than 5% per year, whereas 'uncertain' includes species whose mean annual changes are clearly not less than 5%.
Tabla 2. Especies con tamaño de muestra suicientemente grande como para ser consideradas en el análisis de las tendencias demográicas en cada ciudad. Las especies que se ajustaron a los criterios para ser consideradas como especies de amplia distribución en las ciudades europeas (WSEC) o de amplia distribución en cada ciudad (WSC) están marcadas (ver Material y métodos). De acuerdo con los resultados TRIM (ver Material y métodos), la variación promedio anual (%) y las disminuciones y los incrementos signiicativos durante el período 2002–2010 también están marcados: disminución moderada (↓), incremento moderado (↑), estable (–) e incierto (?). Estas cuatro categorías de tendencia siguen la clasiicación mostrada en Pannekoek & Van Strien (2005), en las cuales 'disminución moderada' e 'Incremento moderado' corresponden a tendencias signiicativas y 'estable' e 'Incierto' corresponden a no signiicativas, siendo consideradas 'estable' aquellas especies para las cuales su tasa promedio de cambio es con certeza menos del 5% anual, mientras que las que tienen la categoría de 'incierto' hacen referencia a aquellas en las que su tasa promedio de cambio anual no es seguro que sea menor del 5%.
Brussels Barcelona English name Scientiic name Trend Indicator Trend Indicator
Stock Dove Columba oenas –10%,↓ WSC
Wood Pigeon Columba palumbus 0%,– WSC,WSEC
Collared Dove Streptopelia decaocto –8%,↓ WSC,WSEC +9%,? WSC,WSEC
Green Woodpecker Picus viridis –5%,? WSC,WSEC
Great Spotted Woodpecker Dendrocopos major –2%,? WSC,WSEC
Swallow Hirundo rustica –4%,? WSC,WSEC
Pied Wagtail Motacilla alba +7%,? WSEC –4%,? WSC,WSEC
Dunnock Prunella modularis +4%,? WSC
Robin Erithacus rubecula –2%,? WSC,WSEC +7%,? WSC,WSEC
Song Thrush Turdus philomelos –2%,? WSC
Blackbird Turdus merula –2%,↓ WSC,WSEC +1%,? WSC,WSEC
Garden Warbler Sylvia borin –11%,?
Blackcap Sylvia atricapilla –3%,↓ WSC,WSEC
Sardinian Warbler Sylvia melanocephala +5%,? WSC
Willow Warbler Phylloscopus trochilus –5%,?
Chiffchaff Phylloscopus collybita –6%,↓ WSC
Wren Troglodytes troglodytes –2%,↓ WSC,WSEC
Spotted Flycatcher Muscicapa striata +6%,? WSEC
Great Tit Parus major +2%,– WSC,WSEC +19%,? WSC,WSEC
Blue Tit Cyanistes caeruleus –2%,– WSC,WSEC +30%,↑ WSC,WSEC
Marsh Tit Poecile palustris –4%,?
Long–tailed Tit Aegithalos caudatus +3%,? WSEC –15%,? WSEC
Nuthatch Sitta europaea –1%,? WSEC
series, then these two values were considered to be signiicantly different (see Pannekoek & Van Strien, 2005 for the same approach at species level). Finally, we assessed a magnitude of yearly average change in the indicators (WSC and WSEC) by calculating the parameter (slope) in the simple regression model between the yearly value of the indicator (dependent variable) and time (predictor).
Results
During the study–period a total of 84 native breeding species were recorded in Brussels and 76 in Barce-lona. Only for some of these species (30 in Brussels and 17 in Barcelona), was sample size considered suficient (see Material and methods) to run TRIM over the period 2002–2010 (table 2). Species trends in Brussels showed that in the period 2002–2010, seven species (28%) decreased signiicantly, two (8%) were stable, and ive (20%) increased signiicantly, whereas in Barcelona, where most species’ trends were non–signiicant, only one species (6%) decrea-sed and two (12%) increadecrea-sed signiicantly (table 2).
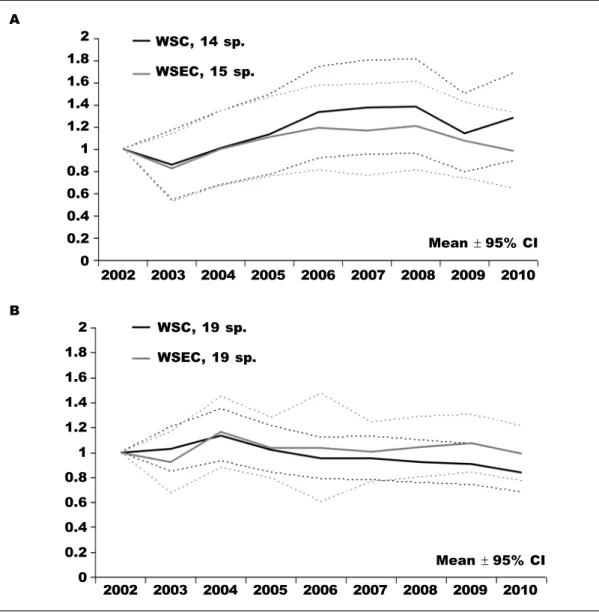
We compared the two approaches to develop urban indicators (WCS and WSEC), which varied according to the species included in each case (table 2). The two indicators gave similar temporal patterns for each of the cities (ig. 2). Overall, the change was non–signiicant over the study period in both cities, although there was a slight increase in Barcelona (5% annual increase for WSC and 2% for WSEC), while the indicators for Brussels showed a slight decrease or remained stable (3% annual decrease for WSC and 0% for WSEC) over the study period (ig. 2).
Discussion
The development of a reliable, urban multi–spe-cies indicator based on bird monitoring data is not a simple task. Starting with data gathering, urban habitats are often under–represented in large–scale monitoring schemes since they are less interesting for ornithologists than more natural areas (e.g. Saris et al., 2004; McCaffrey, 2005; but see also Ferrer et al., 2006). This is partially compensated for by the efforts of some local councils, as in Barcelona and Brussels. Nevertheless, monitoring schemes specii-cally designed for cities have to cope with relatively low sample sizes compared to whole regions or countries, and this often limits the number of species in the data set to just a few dozen (see table 2 for the studied cities). This small set of species could grow if the survey efforts (either in common bird censuses or in species speciic schemes) and/or the number of spe-cies adapted to such artiicial environment increases over time. Hence, in a few years’ time the number of available species to generate an urban indicator may also increase, and so it would be useful to establish procedures that describe when and how such spe-cies should be included in the indicators, and what the consequences will be in relation to the results of former indices.
Within this context, the selection of a group of bird species to provide better information on changes in urban biodiversity is also hampered by the deini-tion of the urban ecology of the species, above all if we consider that an important component of urban variability depends on the avifauna in surrounding habitats (Sattler et al., 2010). Even within Europe, the number of urban adapters varies from one city Short–toed Treecreeper Certhia brachydactyla –5%,↓ WSC
Magpie Pica pica –3%,↓ WSC,WSEC +10%,? WSC,WSEC
Jay Garrulus glandarius +2%,? WSC,WSEC
Jackdaw Corvus monedula +11%,↑ +2%,?
Carrion Crow Corvus corone +4%,↑ WSC
Starling Sturnus vulgaris –8%,↓ WSC,WSEC +8%,↑ WSC,WSEC
House Sparrow Passer domesticus +8%,↑ WSEC –5%,↓ WSC,WSEC
Chafinch Fringilla coelebs +8%,↑ WSEC
Goldcrest Regulus regulus –8%,?
Goldinch Carduelis carduelis –7%,? WSC,WSEC
Greeninch Carduelis chloris +15%,↑ WSEC –3%,? WSC,WSEC
Serin Serinus serinus +5%,? WSC,WSEC
Mean ! 95% CI
Mean ! 95% CI WSC, 14 sp.
WSEC, 15 sp.
WSC, 19 sp. WSEC, 19 sp. 2
1.8 1.6 1.4 1.2 1 0.8 0.6 0.4 0.2 0
2 1.8 1.6 1.4 1.2 1 0.8 0.6 0.4 0.2 0
2002 2003 2004 2005 2006 2007 2008 2009 2010 A
B
to another (Kelcey & Rheinwald, 2005) and gradually increases as additional species invade and adapt to urban areas (Rutz, 2008; Evans et al., 2009). There-fore, in this study we focused fundamentally on the urban character of the study sites rather than that of the bird species, thereby rejecting non–urban sites and focusing on urban sites, mainly consisting of built–up areas and city parks. This approach is different from that of other Pan–European indicators such as the Farmland Bird Index (Voříšek et al., 2008) that uses species lists whatever the habitat that the monitoring data is collected in.
In this study we used data from monitoring projects carried out in Barcelona and Brussels to derive two urban multi–species indicators that could potentially
be applied in other European cities. We took into account the fact that inter–city comparisons could be maximized either at species level (using lists of bird species that are as similar as possible to minimize taxonomic variation) or at ecological level (regard-less of the number of species shared among cities and trying to maximize the information provided by birds on the state of their habitats in each city). In the irst approach, we used a set of species that are widespread in the 16 European cities cited in Kelcey & Rheinwald (2005). However, it could be argued that these cities are not totally representative of the overall European urban avifauna since 50% of them are located in central Europe, and there are, for ex-ample, few western, southern and northern European
2002 2003 2004 2005 2006 2007 2008 2009 2010
cities. Thus, although we considered that this was probably among the best sources of information, this potential weakness should be taken into account in future studies. The second approach did not present such limitations because it was city–speciic, but both approaches had a subjective threshold for a given species to be included in the indicator (present in at least 75% of monitoring plots in a particular city, or species breeding in at least 14 of the 16 cities), and hence these criteria would also deserve further investigation.
Although several important issues on conserva-tion rely on the trends of a particular species (e.g. threatened species), multi–species indicators bet-ter capture ecosystem complexity than indicators based on one or a few species (Buckland et al., 2005; Gregory et al., 2005; Butler et al., 2012). In our case, the analysis by species gave relatively little information and statistically signiicant trends were only obtained for a small number of species, especially in Barcelona. This could be caused, in part, by the short time framework, as illustrated by the fact that in Brussels an analysis including the 10 previous years of sampling provided more sig-niicant results at species level (Weiserbs, 2010). Nevertheless, trends in the multi–species indicators generated in this study seem to be more robust than the individual species trends. Overall, the values shown by the indicators did not change signiicantly over the period 2002–2010 in either of the two cities, although there was a slight non–signiicant increase in Barcelona and the indicators for Brussels showed a slight non–signiicant decrease or remained stable (ig. 2). Regardless of the city, the pattern revealed by the two indicators (WSC and WSEC) was relatively similar. Nevertheless, the detected 3% difference in the overall trend could be considered relevant and reveals the importance of the species–selec-tion procedure and the criteria used. The WSEC indicator shows performance of European species that are widespread in urban environments at a continental scale, whereas the WSC focuses on the species of a particular city. Thus, the two types of indicators presented in this study give different messages. We consider that both indicators have their value and should be treated as complementary indicators rather than competing indicators. Never-theless, these indicators do not shed light on their respective accuracies with respect to what they are expected to indicate, and more studies are needed to analyse the relation between these patterns and other independent sources of information about the state of the environment (i.e. revealing relationships between indicators and environmental predictors relevant for population dynamics).
Further studies are also obviously needed if we are to deine a set of the most suitable species for creating a multi–species urban indicator, and colla-boration between European cities will be crucial if this is to be to achieved. Indeed, this may eventually result in the generation of biodiversity indicators not only for speciic cities, but also for all urban areas in a country or, even, in a whole continent.
Acknowledgements
The data analysed in this study was obtained by volunteer ornithologists, without whom bird moni-toring in Barcelona and Brussels would not exist. The Common Bird Monitoring Scheme carried out in Brussels is coordinated by Aves–Natagora within the Monitoring Programme of the State of the Envi-ronment run by Bruxelles Environnement–IBGE. The Common Bird Monitoring in Barcelona is coordinated by the Catalan Ornithological Institute and run by Barcelona City Council and the University of Barce-lona; this programme is integrated into the Catalan Common Bird Survey (SOCC), which is run by the Catalan Government. We would like to thank all these institutions for their continued support. We would like to thank Petr Voříšek and three anonymous reviewers for their interesting comments on earlier drafts of this manuscript. JQ and SH received par-tial funding from the BIOCAT–BB CGL2009–08798 and BIONOVEL CGL2011–29539 projects from the Spanish Science and Innovation Secretariat. XF received partial funding from Barcelona Zoo and advice from Daniel Sol.
References
Adams, C. E., Linsdsey, K. J. & Ash, S. J., 2006. Urban wildlife management. Taylor & Francis, Boca Raton.
Bibby, C. J., Burgess, N. D., Hill, D. A. & Mustoe, S. H., 2000. Bird Census Techniques. Elsevier, London. Blair, R. B., 1996. Land use and avian species diversity along an urban gradient. Ecol. Appl., 6: 506–519. – 1999. Birds and butterlies along an urban gradient:
surrogate taxa for assessing biodiversity? Ecol. Appl., 9: 164–170.
Buckland, S. T., Magurran, A. E., Green, R. E. & Fewster, R. M., 2005. Monitoring change in biodi-versity through composite indices. Phil. Trans. R. Soc. B., 360: 243–254.
Butler, S. J., Freckleton, R. P., Renwick, A. R. & Norris, K., 2012. An objective, niche–based approach to indicator species selection. Methods in Ecology and Evolution, 3(2): 317–326.
Caula, S. A., Sirami, C., Marty, P. & Martin, J.–L., 2010. Value of an urban habitat for the native Mediter-ranean avifauna. Urban Ecosystems, 13: 73–89. Clergeau, P., Croci, S., Jokimäki, J., Kaisanlahti–
Jokimäki, M.–L. & Dinetti, M., 2006. Avifauna homogenisation by urbanisation: Analysis at dif-ferent European latitudes. Biological Conservation, 127: 336–344.
Crooks, J. A., 2005. Lag times and exotic species: the ecology and management of biological invasions in slow–motion. Ecoscience, 12: 316–329. DEFRA, 2002. Working with the Grain of Nature.
DEFRA Publications, London.
M., Sharp, S. P., McGowan, A., Dawson, D. A., Walasz, K., Partecke, J., Burke, T. & Hatchwell, B. J., 2009. Independent colonization of multiple urban centres by a formerly forest specialist bird species Proc. R. Soc. B, 276: 2403–2410. Ferrer, X., Carrascal, L., Gordo, O. & Pino, J.,
2006. Bias in avian sampling effort due to human preferences: an analysis with Catalonian birds (1900–2002). Ardeola, 53(2): 213–227.
Fuller, R. A., Tratalos, J. & Gaston, K. J., 2009, How many birds are there in a city of half a million people? Diversity and Distributions, 15: 328–337. Gagné, S. A., & Fahrig, L., 2011. Do birds and bee-tles show similar responses to urbanization? Ecol. Appl., 21, 2297–2312.
Gregory, R. D., van Strien, A., Voříšek, P., Gmelig Meyling, A., Noble, D., Foppen, R. & Gibbons, D., 2005. Developing indicators for European birds. Phil. Trans. R. Soc. B, 360: 269–288.
Kelcey, J. & Rheinwald, G., 2005. Birds in European Cities. Ginster Verlag, St. Katharinen.
McCaffrey, R. E., 2005. Using Citizen Science in Urban Bird Studies. Urban Habitats, 3(1): 70–86. Møller, A. P., 2009. Successful city dwellers: a com-parative study of the ecological characteristics of urban birds in the Western Palearctic. Oecologia, 159: 849–858.
Pannekoek, J. & Van Strien, A., 2005. TRIM 3 Manual (Trends & Indices for Monitoring data). Statistics Netherlands, Voorburg.
PECBMS, 2011. Population Trends of Common Eu-ropean Breeding Birds 2011. CSO, Prague. Robinson, R. A. & Sutherland, W. J., 2002. Post–war
changes in arable farming and biodiversity in Great Britain. Journal of Applied Ecology, 39: 157–176. Rutz, C., 2008. The establishment of an urban bird
population. J. Anim. Ecol., 77: 1008–1019.
Sierdsema, H. & Verstrael, T., 2004. The Dutch breeding bird monitoring scheme: Evaluation, new objectives and its merits for conservation. Bird Census News, 13: 113–121.
Sattler, T., Borcard, D., Arlettaz, R., Bontadina, F., Legendre, P., Obrist, M. K. & Moretti, M., 2010. Spider, bee, and bird communities in cities are shaped by environmental control and high sto-chasticity. Ecology, 91(11): 3343–3353.
Savard, J.–P. L., Clergeau, P. & Mennechez, G., 2000. Biodiversity concepts and urban ecosystems. Landscape and Urban Planning, 48: 131–142. Schmeller, D. S., 2008. European species and habitat
monitoring: where are we now? Biodiversity and Conservation, 17: 3321–3326.
SEO/BirdLife, 2010. Estado de conservación de las aves en España en 2010. SEO/BirdLife, Madrid (in Spanish).
Sol, D. & Senar, J. C., 1995. Urban pigeon popu-lations: stability, home range, and the effect of removing individuals. Can. J. Zool., 73: 1154–1160. Voříšek, P., Klvanová, A., Wotton, S. & Gregory, R.
D. (Eds.), 2008. A best practice guide for wild bird monitoring schemes. CSO/RSPB, Trebon. Weiserbs, A. & Jacob, J. P., 2007. Analyse des
ré-sultats 1992–2005 de la surveillance des oiseaux nicheurs «communs» dans la Région de Bruxelles– Capitale. Aves, 44: 65–78 (in French).
Weiserbs, A., 2010. Oiseaux communs de Bruxelles – Cartographie des tendances. Oiseaux de Bruxelles n°2. Aves, Liège (in French).