water in the public reservoir of Cruzeta, RN, Brazil
Chellappa, NT.
a*, Borba, JM.
aand Rocha, O.
baPós-graduação em Bioecologia aquática, Departamento de Oceanografia e Limnologia, Universidade Federal do Rio Grande do Norte – UFRN,
Av. Via Costeira, CEP 59014-100, Natal, RN, Brazil
bDepartamento de Ecologia e Biologia Evolutiva, Universidade Federal de São Carlos – UFSCar, Rodovia Washington Luis, Km 235, CEP 13564-905, São Carlos, SP, Brazil
*e-mail: chellappa@dol.ufrn.br
Received September 21, 2006 – Accepted March 9, 2007 – Distributed August 31, 2008 (With 8 figures)
Abstract
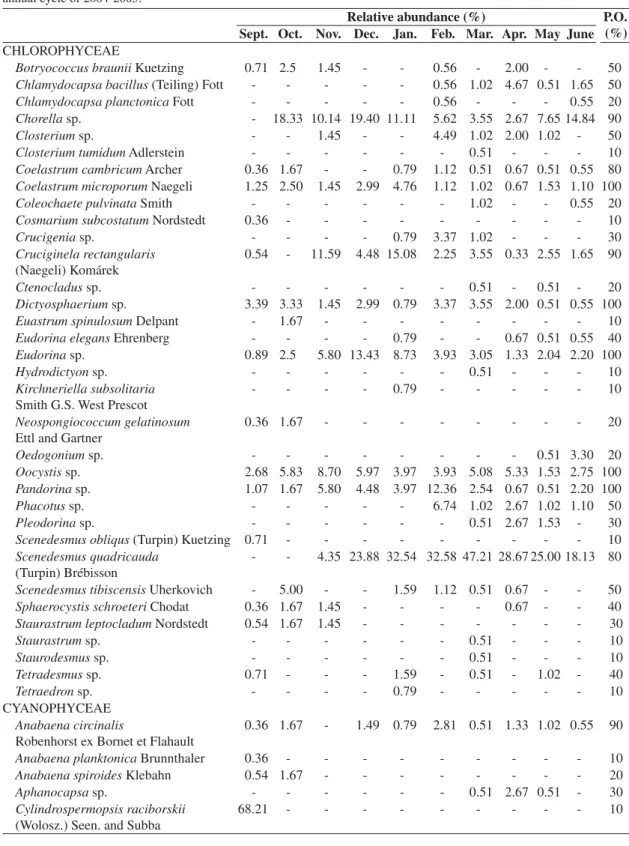
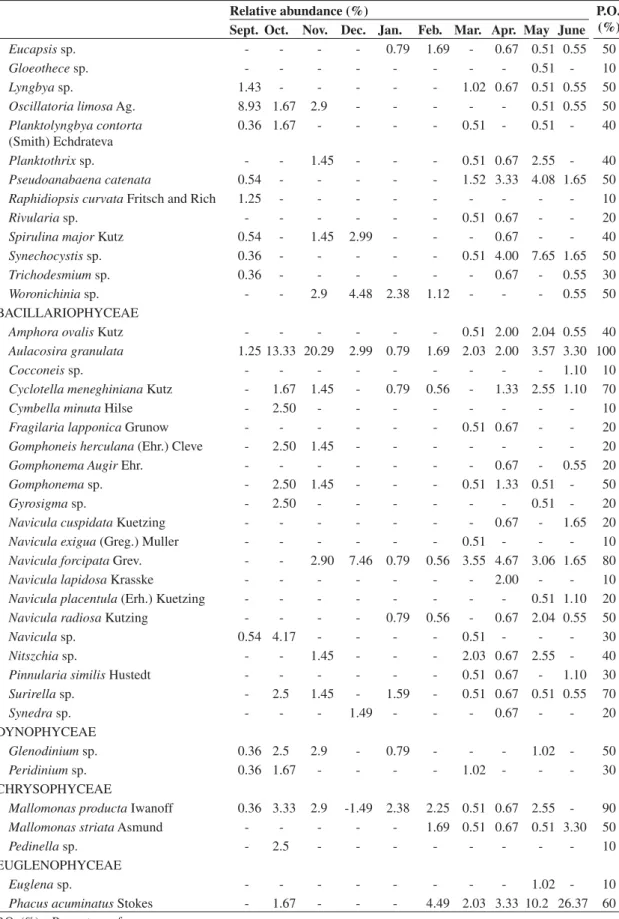
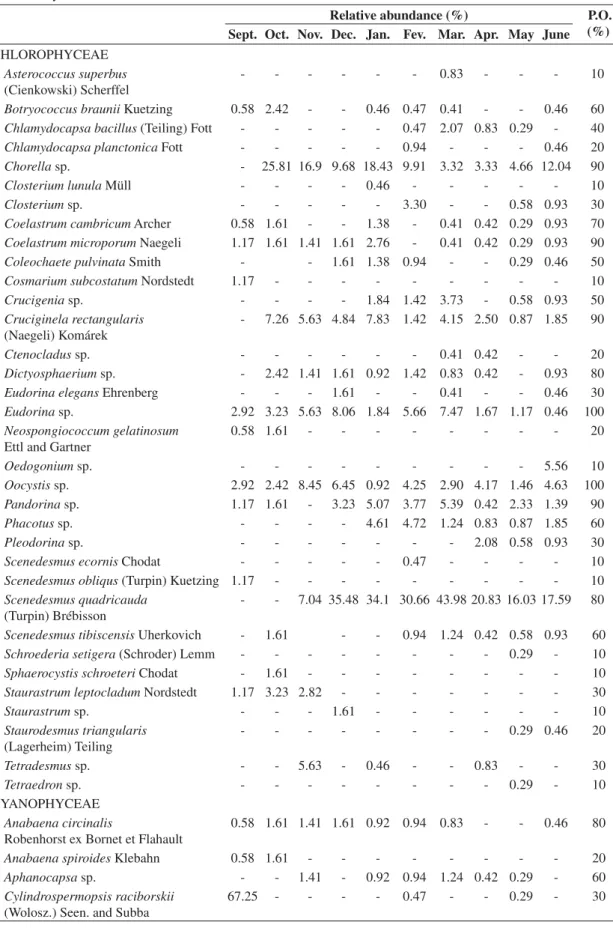
The Phytoplankton community and the abiotic factors of the Cruzeta reservoir were studied at three depths, sur-face, middle (2 m) and bottom, from September, 2004 to June, 2005, in order to characterize the environment and assess the possible factors that influence the compositional change of phytoplankton. Ninety species belonging to 6 classes (Chlorophyceae, Bacillariophyceae, Cyanophyceae, Dinophyceae, Chrysophyceae and Euglenophyceae) were identified with 66 and 80 taxonomic units in the dry and rainy season. The most representative class in terms
of species richness was Chlorophyceae and dominated by Scendesmus quadricauda, Oocystis sp. and Chlorella sp.
The group cyanobacteria were represented by 18 species of diverse morphological characteristics and the dominance
ofCylindrospermopsis raciborskii in September 2004. The other major group, Bacillariophyceae is represented by
21 species with the predominance of Aulacoseira granulata in mid-column and bottom waters. The other dominant
species was Phacus acuminatus of Euglenophyceae. The species diversity and evenness indices were high, moderate
and low in relation to the three hydroperiod registered during the 2004-2005 annual cycle. The reservoir exhibits high
electrical conductivity (290-550 MS.cm–1), alkaline pH (7.3-9.4), mean temperature of 28 °C, varying concentrations
of dissolved oxygen (3.29-7.6 mg.L–l) and the greatest concentration of nutrients at the bottom (orthophosphate,
0.22-0.62 mg.L–1) with the general tendency of oligo-mesotrophic status during sampling periods. The chlorophyll
a fluctuated to a minimum of 1.34 Mg.L–l at the bottom in April, 2005 and a maximum of 14.3 Mg.L–lin mid-column
water in September, 2004. The reservoir is characteristically an oligo-mesotrophic environment.
Keywords: Cruzeta RN reservoir, hydroperiod, phytoplankton, chlorophyll a, nutrients.
Comunidade fitoplanctônica e características físico-químicas
do açude público de Cruzeta, Rio Grande do Norte, BR
Resumo
A comunidade fitoplanctônica e os fatores abióticos do açude Cruzeta foram estudados em três profundidades, superfí-cie, meio (2 m) e fundo, de setembro, 2004 a junho, 2005, com o intuito de caracterizar e avaliar os possíveis fatores que influenciam as mudanças composicionais do fitoplâncton. Noventa espécies pertencentes a 06 classes (Chlorophyceae, Bacillariophyceae, Cyanophyceae, Dinophyceae, Chrysophyceae e Euglenophyceae) foram identificadas com 66 e 80 unidades taxonômicas nas estações de seca e de chuvas. A riqueza de espécies foi classe Chlorophyceae, com
dominância de Scenedesmus quadriculata,Oocystis sp. e Chlorella sp. O grupo das Cyanophyceae foi representado
por 18 espécies de características diversas com dominância de Cylindrospermopsis raciborskii em Setembro 2004.
Em seguida, foi encontrado o grupo das Bacillariophyceae, representado por 21 espécies com a predominância de
Aulacoseira granulata no fundo d’água. Outra espécie dominante foi Phacus acuminatus das Euglenophyceae. Os
ín-dices de diversidade e similaridade foram classificados como alto, moderado e baixo em relação aos três hidroperíodos
registrados, durante o ciclo anual de 2004-2005. O reservatório exibiu alta condutividade elétrica (290-550MS.cm–1),
pH alcalino (7.3-9.4), temperatura média de 28 °C, concentrações de oxigênio dissolvido variando entre 3.29 mg.L–1a
7.6 mg.L–1 e maior concentração de nutrientes no fundo do reservatório (ortofosfato, 0.22-0.62 mg.L–1), com
ten-dência geral ao estado oligo-mesotrófico durante o período de amostragens. A clorofila a flutuou de um mínimo de
1.34Mg.L–1 no fundo em Abril, 2005 e um máximo de 14.3 Mg.L–1 no meio da coluna d’água em Setembro, 2004. O
reservatório é um ambiente oligo-mesotrófico característico.
1. Introduction
The Phytoplankton biomass in reservoirs depends on various interrelated physical, chemical and biologi-cal factors (Kimmel et al., 1999) and is subject to the action of the pulses produced in the system that may be of natural origin, such as precipitation, wind and the in-flux of the river, or anthropogenic (Tundisi et al., 1999). Therefore, the phytoplanktonic communities display a potential for change that may lead to the substitution, re-moval or addition of species. Alterations in species rich-ness are mainly due to the variability of abiotic factors, such as climactic tendencies or short-term climatic vari-ations (Cody, 1996). Freshwater phytoplankton ecology studies in Brazil include reservoirs, natural lakes coastal lagoons, floodplain lakes, rivers and fish ponds. Nearly 75% of the studies come from South and Southeastern region of Brazil based on both descriptive and experi-mental approaches (Barbosa et al., 1995). The most important contributions are based on the general phy-toplankton structure, diversity to cyanobacterial domi-nance and their toxin producing capacity associated with eutrophic conditions (Azevedo et al., 1994; Bicudo et al., 1999; Huszar et al., 2000). By comparison, relatively few studies have been conducted in the Northeast (Henry, 1999). Although limited in number of publications, the investigations on the ecology of phytoplankton that have been carried out over a period of 15 years indicate the threat posed by the recurrence of two
cyanobacte-ria, Microcystis aeruginosa and Cylindrospermopsis
raciborskii (Bouvy et al., 2000 and 2003; Chellappa,
1990; Chellappa and Costa, 2003; Chellappa et al., 1996). The synoptic studies researched in Pernambuco state, indicate that the high temperature, alkaline pH, long water retention time and eutrophic to hypereu-trophic status and luxury uptake of nitrogen and phos-phorus by dominant cyanobacterial species determined phytoplankton composition in 39 Brazilian northeast reservoirs. The research also revealed the fast spreading
nature of invasive cyanobacterium, Cylindrospermopsis
raciborskii (Bouvy et al., 2000; Bouvy et al., 2003).
In Rio Grande do Norte, studies performed with limnetic phytoplankton were intensified in the 1990s. Chellappa et al. (1996) assessed semi-arid ecosystems in Rio Grande do Norte, comparing the phytoplankton composition of oligotrophic and eutrophic lakes and ob-serving the diversity of species related to the trophic sta-tus of Lakes Urubu and Extremoz. Chellapa et al. (2000) studied the phytoplankton community of São Paulo do Potengi reservoir, a salinized fresh water, where the spa-tial-temporal effect of eutrophication was verified,
high-lighting the alternating dominance between Aulocoseira
granulata (Bacillariophyceae) and Spirulina platensis
(Cyanobacteria). Studies performed at Armando Ribeiro Gonçalves reservoir in Açu, RN and at Marechal Dutra (Gargalheiras) reservoir in Acari, RN (Chellappa et al., 2000, Chellappa and Costa, 2003) also demonstrated a high degree of water eutrophication, which stimulated
the dominance of toxic cyanobacteria. Medeiros (2005) studied the phytoplankton composition of the public res-ervoir of Cruzeta, RN, in which it was detected the
pres-ence of potentially toxic cyanobacteria, such as Anabaena
circinalis and Cylindrospermopsis raciborskii.
There are two ecological hypotheses successfully tried by experimental basis to determine phytoplankton growth and biomass production: trophic cascade theory, which indicates how a strong reduction of the fish stock leads to marked increase in the zooplankton commu-nity. Many phytoplanktivorous zooplankton graze down phytoplankton biomass to a low level (Meijer et al., 1994; Nogueira et al., 2005). The second hypothesis is based on bottom-up theory where the nutrients from sediment suspension result in positive feedback to stimulate bloom formation and high phytoplankton bio-mass (Carpenter et al., 1985; Pinto-Coelho et al., 2005). Shallow water reservoirs of northeast Brazil are mostly governed by drought polygon where the low annual rainfall and high evaporation rate coupled with reser-voir draw down (flushing) determine the phytoplank-ton structure (Bouvy et al., 2003; Chellappa and Costa, 2003). The purpose of the present study was to character-ize the phytoplankton community of the public reservoir of Cruzeta in a vertical profile during a drought-rainfall cycle in 2004-2005 and to find out which factor or fac-tors determine community structure, diversity and chlo-rophyll biomass.
2. Material and Methods
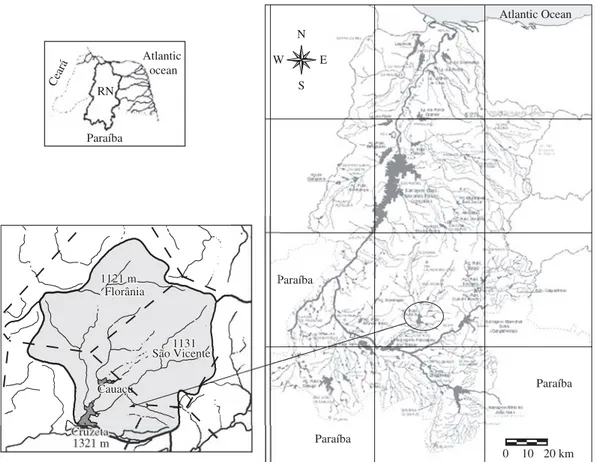
The Public Reservoir of Cruzeta is located in the mu-nicipality of Cruzeta in the Western Seridó region of the state of Rio Grande do Norte (geographic coordinates 06° 24’ 42’’ S and 36° 47’ 23’’ W) (Figure 1).
It is a shallow reservoir of great importance for the municipality, since it provides water for irrigation and represents its only water source. The morphometric characteristics of the reservoir are: water holding
capac-ity 35,000,000 m3, discharge rate 0.174 m3/s, volume of
water during the study period 26,010,000 m3 with a
theo-retical renewal time of around 180 days, maximum depth 11 m and mean depth of 4.5 m.
Samples were collected monthly from September, 2004 to June, 2005 at a fixed collection station with a Van Dorn bottle (5 L) and at three depths: surface (0 m), 2 m and bottom (6 m). The following parameters were measured: pH, temperature, electrical conductivity and dissolved oxygen (WTW Multiparameter Multi 340i). Nutrient analyses such as, nitrate (Golterman et al., 1978), orthophosphate (APHA, 1985), ammonium
(Golterman et al., 1978) and chlorophyll-a
of species (Wehr and Sheath, 2003). The quantitative measurements of phytoplankton individuals were done using the sedimentation technique and counting with the help of a Sedgwick Rafter chamber. The Pearson correla-tion test was used to assess relacorrela-tions among groups and species of phytoplankton with environmental variables using the Statistics 6.0 program.
3. Results
The recorded total annual rainfall (mean of 2004-2005 was 328 mm) is typical of the semiarid northeast region reaching a peak in March 2005 and minimum in the dry period (September to December) (Figure 2). Table 1 presents the data related to optical characteristics (euphotic zone and turbidity levels). Mean transparency during the dry and rainy periods was 0.43 and 0.57 m, respectively, but more light penetrated the water column during the dry period compared to the wet period in re-sponse to the clear and turbid nature of the shallow water in the Cruzeta reservoir (Table 1).
The mean annual water temperature was 27 °C, with a maximum surface value (30.05 °C) in February and a minimum bottom value (25.2 °C) in June, 2005. This month showed the lowest temperatures across the water column. The reduced depth of the Cruzeta reser-voir determined the isothermal pattern and total
mix-ing regime durmix-ing the study period. The concentration of dissolved oxygen in the Cruzeta reservoir oscillated between 3.17 mg.L–1 at the 2 m depth in December and
7.60 mg.L–1 on the surface in June (Figure 3).
Electrical conductivity was elevated, a fact often ob-served in reservoirs in the semi-arid regions of northeast-ern Brazil, indicating a good buffered system. The low-est electrical conductivity values were observed at the onset of the drought in September (291MS.cm–1), and the
highest conductivity value was registered in the middle of the water column in April (548MS.cm–1). The mean
was 330MS.cm–1 for the dry period and 435MS.cm–1 for
the rainy season. The pH had a mean value of 9.06 in the dry season and 8.70 in the rainy period, always alkaline, which is evidence of a good buffering system. The low-est value (7.39) was observed in the middle of the water
Paraíba
Paraíba
Paraíba Atlantic Ocean
0 10 20 km
W E
N
S
Ceará
Paraíba
Cauaçu Cauaçu
1131 1131 1121 m
1121 m
São Vicente São Vicente Florânia
Florânia RN
Atlantic ocean
Figure 1.Hydrographic basin of Piranhas-Açu river and the location of Cruzeta reservoir, RN.
Precipitation
0 50 100 150 200
Sept. Oct. Nov. Dec. Jan. Feb. Mar. Apr. May
(mm)
June
Figure 2.Monthly rainfall data of Cruzeta, RN reservoir
25 28 31
(°C)
Sept./04 Oct./04 No
v./04
Dec./04 Jan./05 Feb
./05 Mar ./05 Apr ./05 May/05 June/05 Temperature
Sept./04 Oct./04 No
v./04
Dec./04 Jan./05 Feb
./05 Mar ./05 Apr ./05 May/05 June/05 2 4 6 8 (mg.L –1) Dissolved oxygen
Sept./04 Oct./04 No
v./04
Dec./04 Jan./05 Feb
./05 Mar ./05 Apr ./05 May/05 June/05 200 400 600 ( M S.cm –1) Conductivity
Sept./04 Oct./04 No
v./04
Dec./04 Jan./05 Feb
./05 Mar ./05 Apr ./05 May/05 June/05 6 8 10 pH
Surface Mid-column Bottom
Figure 3. Seasonal variations of Temperature, Dissolved Oxygen, Conductivity and pH of water samples of Cruzeta, RN reservoir.
Table 1. Secchi disc measurement, Euphotic zone and depth profile of Cruzeta, RN reservoir during the study period (September/04 to June/05).
Date ZDS
(m) Zmax (m)
Zeuf (m)
Zmax / Zeuf K (m–1)
Sept./04 0.48 3.5 1.44 2.17 18.75
Oct./04 0.44 3.2 1.32 2.10 20.45
Nov./04 0.42 3.0 1.26 2.97 21.43
Dec./04 0.40 3.5 1.20 2.75 22.50
Jan./05 0.52 4.2 1.56 1.56 17.31
Feb./05 0.68 4.0 2.04 1.96 13.24
Mar./05 0.60 6.5 1.20 1.50 15.00
Apr./05 0.52 5.0 1.25 1.56 17.31
May/05 0.53 4.5 1.39 2.20 16.98
Jun./05 0.54 4.0 1.42 1.85 16.67
Orthophosfate 0.0 0.2 0.4 0.6 0.8
Sept./04 Oct./04 No
v./04
Dec./04 Jan./05 Feb
./05 Mar ./05 Apr ./05 May/05 June/05 Oct./04 No v./04
Dec./04 Jan./05 Feb
./05 Mar ./05 Apr ./05 May/05 June/05 Sept./04 Sept./04
Oct./04 Nov./04 Dec./04 Jan./05 Feb
./05 Mar ./05 Apr ./05 May/05 June/05 (mg.L –1) (mg.L –1) (mg.L –1) Nitrate 0.00 0.04 0.08 0.12 0.16
Surface Mid-column Bottom 0.15 Ammonium 0.05 0.10 0.20 0.25
Figure 4. Seasonal variation in inorganic nutrients concen-tration of water samples of Cruzeta, RN reservoir.
Chlorophyll a`
0 4 8 12 16
Sept.-04 Oct.-04 No
v.-04
Dec.-04 Jan.-05 Feb
.-05 Mar .-05 Apr .-05 May-05 June-05 ( M g.L –1)
Surface Mid-column Bottom
Figure 5. Seasonal variation of chlorophyll a concentrations in different depth profiles of Cruzeta, RN reservoir. column in January and the highest pH value (9.53) was
recorded on the surface in December (Figure 3). The variations in orthophosphate, nitrate and am-monium are presented in Figure 4. An absolute nutrient value of nitrate and phosphate when transformed into a N/P ratio demonstrated low nitrogen to phosphorus sta-tus and the one based on the Redfield ratio gave a very insignificant value frequently around 0 or below 10. Cyanobacterial abundance was incompatible to low N/P ratio in all three profiles.
Chlorophyll-a concentrations varied from 1.34Mg.L–1
at the bottom in April to 14.26 Mg.L–1 at middle depth
(2 m) in September, due to the presence and dominance
ofCylindrospermopsis raciborskii in the reservoir. The
greatest concentrations of chlorophyll-a were generally
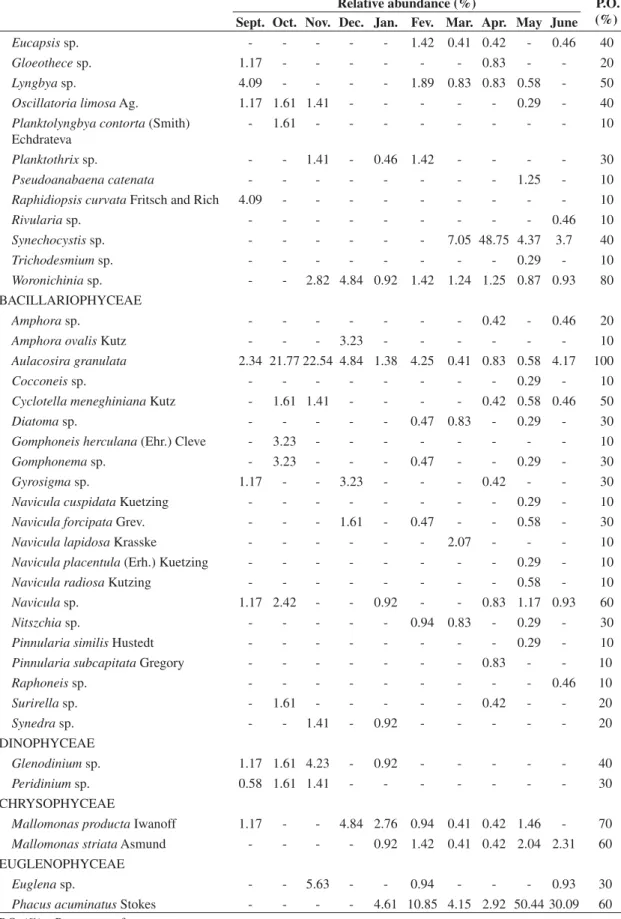
Table 2. Phytoplankton species and relative abundance distributed in the surface water of Cruzeta/RN Reservoir during the annual cycle of 2004-2005.
Relative abundance (%) P.O.
(%)
Sept. Oct. Nov. Dec. Jan. Feb. Mar. Apr. May June
CHLOROPHYCEAE
Botryococcus braunii Kuetzing 0.71 2.5 1.45 - - 0.56 - 2.00 - - 50
Chlamydocapsa bacillus (Teiling) Fott - - - 0.56 1.02 4.67 0.51 1.65 50
Chlamydocapsa planctonica Fott - - - 0.56 - - - 0.55 20
Chorella sp. - 18.33 10.14 19.40 11.11 5.62 3.55 2.67 7.65 14.84 90
Closterium sp. - - 1.45 - - 4.49 1.02 2.00 1.02 - 50
Closterium tumidum Adlerstein - - - 0.51 - - - 10
Coelastrum cambricum Archer 0.36 1.67 - - 0.79 1.12 0.51 0.67 0.51 0.55 80
Coelastrum microporum Naegeli 1.25 2.50 1.45 2.99 4.76 1.12 1.02 0.67 1.53 1.10 100
Coleochaete pulvinata Smith - - - 1.02 - - 0.55 20
Cosmarium subcostatum Nordstedt 0.36 - - - 10
Crucigenia sp. - - - - 0.79 3.37 1.02 - - - 30
Cruciginela rectangularis (Naegeli) Komárek
0.54 - 11.59 4.48 15.08 2.25 3.55 0.33 2.55 1.65 90
Ctenocladus sp. - - - 0.51 - 0.51 - 20
Dictyosphaerium sp. 3.39 3.33 1.45 2.99 0.79 3.37 3.55 2.00 0.51 0.55 100
Euastrum spinulosum Delpant - 1.67 - - - 10
Eudorina elegans Ehrenberg - - - - 0.79 - - 0.67 0.51 0.55 40
Eudorina sp. 0.89 2.5 5.80 13.43 8.73 3.93 3.05 1.33 2.04 2.20 100
Hydrodictyon sp. - - - 0.51 - - - 10
Kirchneriella subsolitaria Smith G.S. West Prescot
- - - - 0.79 - - - 10
Neospongiococcum gelatinosum Ettl and Gartner
0.36 1.67 - - - 20
Oedogonium sp. - - - 0.51 3.30 20
Oocystis sp. 2.68 5.83 8.70 5.97 3.97 3.93 5.08 5.33 1.53 2.75 100
Pandorina sp. 1.07 1.67 5.80 4.48 3.97 12.36 2.54 0.67 0.51 2.20 100
Phacotus sp. - - - 6.74 1.02 2.67 1.02 1.10 50
Pleodorinasp. - - - 0.51 2.67 1.53 - 30
Scenedesmus obliqus (Turpin) Kuetzing 0.71 - - - 10
Scenedesmus quadricauda (Turpin) Brébisson
- - 4.35 23.88 32.54 32.58 47.21 28.67 25.00 18.13 80
Scenedesmus tibiscensis Uherkovich - 5.00 - - 1.59 1.12 0.51 0.67 - - 50
Sphaerocystis schroeteri Chodat 0.36 1.67 1.45 - - - - 0.67 - - 40
Staurastrum leptocladum Nordstedt 0.54 1.67 1.45 - - - 30
Staurastrum sp. - - - 0.51 - - - 10
Staurodesmus sp. - - - 0.51 - - - 10
Tetradesmus sp. 0.71 - - - 1.59 - 0.51 - 1.02 - 40
Tetraedron sp. - - - - 0.79 - - - 10
CYANOPHYCEAE Anabaena circinalis
Robenhorst ex Bornet et Flahault
0.36 1.67 - 1.49 0.79 2.81 0.51 1.33 1.02 0.55 90
Anabaena planktonica Brunnthaler 0.36 - - - 10
Anabaena spiroides Klebahn 0.54 1.67 - - - 20
Aphanocapsa sp. - - - 0.51 2.67 0.51 - 30
Cylindrospermopsis raciborskii (Wolosz.) Seen. and Subba
68.21 - - - 10
Dinophyceae, Chrysophyceae and Euglenophyceae), with a total of 66 in the dry period and 80 in the rainy season (Tables 2, 3 and 4). The most representative class in terms of species richness was Chlorophyceae
Relative abundance (%) P.O. (%)
Sept. Oct. Nov. Dec. Jan. Feb. Mar. Apr. May June
Eucapsis sp. - - - - 0.79 1.69 - 0.67 0.51 0.55 50
Gloeothece sp. - - - 0.51 - 10
Lyngbya sp. 1.43 - - - 1.02 0.67 0.51 0.55 50
Oscillatoria limosa Ag. 8.93 1.67 2.9 - - - 0.51 0.55 50
Planktolyngbya contorta (Smith) Echdrateva
0.36 1.67 - - - - 0.51 - 0.51 - 40
Planktothrix sp. - - 1.45 - - - 0.51 0.67 2.55 - 40
Pseudoanabaena catenata 0.54 - - - 1.52 3.33 4.08 1.65 50
Raphidiopsis curvata Fritsch and Rich 1.25 - - - 10
Rivularia sp. - - - 0.51 0.67 - - 20
Spirulina major Kutz 0.54 - 1.45 2.99 - - - 0.67 - - 40
Synechocystis sp. 0.36 - - - 0.51 4.00 7.65 1.65 50
Trichodesmium sp. 0.36 - - - 0.67 - 0.55 30
Woronichinia sp. - - 2.9 4.48 2.38 1.12 - - - 0.55 50
BACILLARIOPHYCEAE
Amphora ovalis Kutz - - - 0.51 2.00 2.04 0.55 40
Aulacosira granulata 1.25 13.33 20.29 2.99 0.79 1.69 2.03 2.00 3.57 3.30 100
Cocconeis sp. - - - 1.10 10
Cyclotella meneghiniana Kutz - 1.67 1.45 - 0.79 0.56 - 1.33 2.55 1.10 70
Cymbella minuta Hilse - 2.50 - - - 10
Fragilaria lapponica Grunow - - - 0.51 0.67 - - 20
Gomphoneis herculana (Ehr.) Cleve - 2.50 1.45 - - - 20
Gomphonema Augir Ehr. - - - 0.67 - 0.55 20
Gomphonema sp. - 2.50 1.45 - - - 0.51 1.33 0.51 - 50
Gyrosigma sp. - 2.50 - - - 0.51 - 20
Navicula cuspidata Kuetzing - - - 0.67 - 1.65 20
Navicula exigua (Greg.) Muller - - - 0.51 - - - 10
Navicula forcipata Grev. - - 2.90 7.46 0.79 0.56 3.55 4.67 3.06 1.65 80
Navicula lapidosa Krasske - - - 2.00 - - 10
Navicula placentula (Erh.) Kuetzing - - - 0.51 1.10 20
Navicula radiosa Kutzing - - - - 0.79 0.56 - 0.67 2.04 0.55 50
Navicula sp. 0.54 4.17 - - - - 0.51 - - - 30
Nitszchia sp. - - 1.45 - - - 2.03 0.67 2.55 - 40
Pinnularia similis Hustedt - - - 0.51 0.67 - 1.10 30
Surirella sp. - 2.5 1.45 - 1.59 - 0.51 0.67 0.51 0.55 70
Synedra sp. - - - 1.49 - - - 0.67 - - 20
DYNOPHYCEAE
Glenodinium sp. 0.36 2.5 2.9 - 0.79 - - - 1.02 - 50
Peridinium sp. 0.36 1.67 - - - - 1.02 - - - 30
CHRYSOPHYCEAE
Mallomonas producta Iwanoff 0.36 3.33 2.9 -1.49 2.38 2.25 0.51 0.67 2.55 - 90
Mallomonas striata Asmund - - - 1.69 0.51 0.67 0.51 3.30 50
Pedinella sp. - 2.5 - - - 10
EUGLENOPHYCEAE
Euglena sp. - - - 1.02 - 10
Phacus acuminatus Stokes - 1.67 - - - 4.49 2.03 3.33 10.2 26.37 60
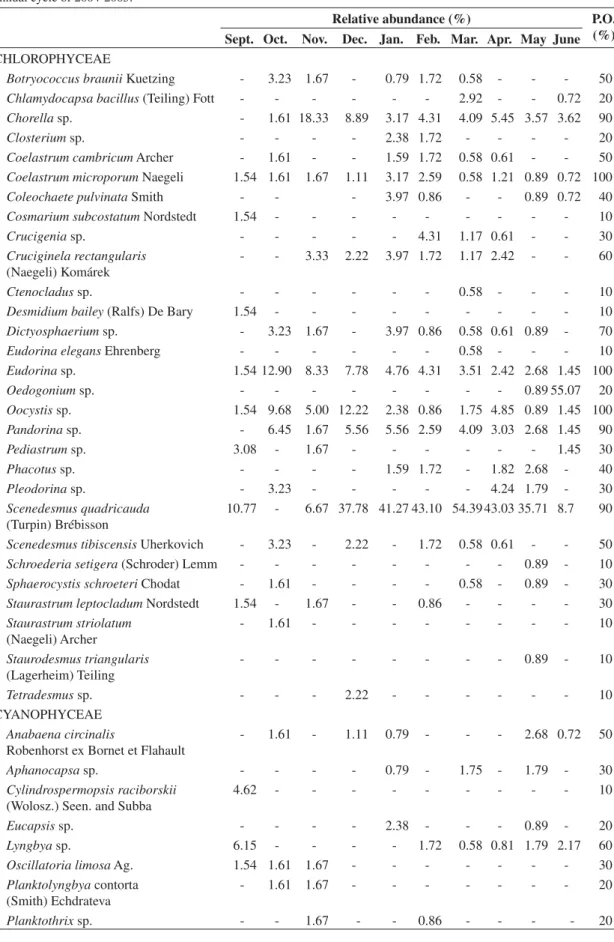
Table 3. Phytoplankton species and relative abundance distributed in the mid-column water of Cruzeta, RN Reservoir during the annual cycle of 2004-2005.
Relative abundance (%) P.O.
(%)
Sept. Oct. Nov. Dec. Jan. Fev. Mar. Apr. May June
CHLOROPHYCEAE Asterococcus superbus (Cienkowski) Scherffel
- - - 0.83 - - - 10
Botryococcus braunii Kuetzing 0.58 2.42 - - 0.46 0.47 0.41 - - 0.46 60
Chlamydocapsa bacillus (Teiling) Fott - - - 0.47 2.07 0.83 0.29 - 40
Chlamydocapsa planctonica Fott - - - 0.94 - - - 0.46 20
Chorella sp. - 25.81 16.9 9.68 18.43 9.91 3.32 3.33 4.66 12.04 90
Closterium lunula Müll - - - - 0.46 - - - 10
Closterium sp. - - - 3.30 - - 0.58 0.93 30
Coelastrum cambricum Archer 0.58 1.61 - - 1.38 - 0.41 0.42 0.29 0.93 70
Coelastrum microporum Naegeli 1.17 1.61 1.41 1.61 2.76 - 0.41 0.42 0.29 0.93 90
Coleochaete pulvinata Smith - - 1.61 1.38 0.94 - - 0.29 0.46 50
Cosmarium subcostatum Nordstedt 1.17 - - - 10
Crucigenia sp. - - - - 1.84 1.42 3.73 - 0.58 0.93 50
Cruciginela rectangularis (Naegeli) Komárek
- 7.26 5.63 4.84 7.83 1.42 4.15 2.50 0.87 1.85 90
Ctenocladus sp. - - - 0.41 0.42 - - 20
Dictyosphaerium sp. - 2.42 1.41 1.61 0.92 1.42 0.83 0.42 - 0.93 80
Eudorina elegans Ehrenberg - - - 1.61 - - 0.41 - - 0.46 30
Eudorina sp. 2.92 3.23 5.63 8.06 1.84 5.66 7.47 1.67 1.17 0.46 100
Neospongiococcum gelatinosum Ettl and Gartner
0.58 1.61 - - - 20
Oedogonium sp. - - - 5.56 10
Oocystis sp. 2.92 2.42 8.45 6.45 0.92 4.25 2.90 4.17 1.46 4.63 100
Pandorina sp. 1.17 1.61 - 3.23 5.07 3.77 5.39 0.42 2.33 1.39 90
Phacotus sp. - - - - 4.61 4.72 1.24 0.83 0.87 1.85 60
Pleodorina sp. - - - 2.08 0.58 0.93 30
Scenedesmus ecornis Chodat - - - 0.47 - - - - 10
Scenedesmus obliqus (Turpin) Kuetzing 1.17 - - - 10
Scenedesmus quadricauda (Turpin) Brébisson
- - 7.04 35.48 34.1 30.66 43.98 20.83 16.03 17.59 80
Scenedesmus tibiscensis Uherkovich - 1.61 - - 0.94 1.24 0.42 0.58 0.93 60
Schroederia setigera (Schroder) Lemm - - - 0.29 - 10
Sphaerocystis schroeteri Chodat - 1.61 - - - 10
Staurastrum leptocladum Nordstedt 1.17 3.23 2.82 - - - 30
Staurastrum sp. - - - 1.61 - - - 10
Staurodesmus triangularis (Lagerheim) Teiling
- - - 0.29 0.46 20
Tetradesmus sp. - - 5.63 - 0.46 - - 0.83 - - 30
Tetraedron sp. - - - 0.29 - 10
CYANOPHYCEAE Anabaena circinalis
Robenhorst ex Bornet et Flahault
0.58 1.61 1.41 1.61 0.92 0.94 0.83 - - 0.46 80
Anabaena spiroides Klebahn 0.58 1.61 - - - 20
Aphanocapsa sp. - - 1.41 - 0.92 0.94 1.24 0.42 0.29 - 60
Cylindrospermopsis raciborskii (Wolosz.) Seen. and Subba
Relative abundance (%) P.O. (%)
Sept. Oct. Nov. Dec. Jan. Fev. Mar. Apr. May June
Eucapsis sp. - - - 1.42 0.41 0.42 - 0.46 40
Gloeothece sp. 1.17 - - - 0.83 - - 20
Lyngbya sp. 4.09 - - - - 1.89 0.83 0.83 0.58 - 50
Oscillatoria limosa Ag. 1.17 1.61 1.41 - - - 0.29 - 40
Planktolyngbya contorta (Smith)
Echdrateva
- 1.61 - - - 10
Planktothrix sp. - - 1.41 - 0.46 1.42 - - - - 30
Pseudoanabaena catenata - - - 1.25 - 10
Raphidiopsis curvata Fritsch and Rich 4.09 - - - 10
Rivularia sp. - - - 0.46 10
Synechocystis sp. - - - 7.05 48.75 4.37 3.7 40
Trichodesmium sp. - - - 0.29 - 10
Woronichinia sp. - - 2.82 4.84 0.92 1.42 1.24 1.25 0.87 0.93 80
BACILLARIOPHYCEAE
Amphora sp. - - - 0.42 - 0.46 20
Amphora ovalis Kutz - - - 3.23 - - - 10
Aulacosira granulata 2.34 21.77 22.54 4.84 1.38 4.25 0.41 0.83 0.58 4.17 100
Cocconeis sp. - - - 0.29 - 10
Cyclotella meneghiniana Kutz - 1.61 1.41 - - - - 0.42 0.58 0.46 50
Diatoma sp. - - - 0.47 0.83 - 0.29 - 30
Gomphoneis herculana (Ehr.) Cleve - 3.23 - - - 10
Gomphonema sp. - 3.23 - - - 0.47 - - 0.29 - 30
Gyrosigma sp. 1.17 - - 3.23 - - - 0.42 - - 30
Navicula cuspidata Kuetzing - - - 0.29 - 10
Navicula forcipata Grev. - - - 1.61 - 0.47 - - 0.58 - 30
Navicula lapidosa Krasske - - - 2.07 - - - 10
Navicula placentula (Erh.) Kuetzing - - - 0.29 - 10
Navicula radiosa Kutzing - - - 0.58 - 10
Navicula sp. 1.17 2.42 - - 0.92 - - 0.83 1.17 0.93 60
Nitszchia sp. - - - 0.94 0.83 - 0.29 - 30
Pinnularia similis Hustedt - - - 0.29 - 10
Pinnularia subcapitata Gregory - - - 0.83 - - 10
Raphoneis sp. - - - 0.46 10
Surirella sp. - 1.61 - - - 0.42 - - 20
Synedra sp. - - 1.41 - 0.92 - - - 20
DINOPHYCEAE
Glenodinium sp. 1.17 1.61 4.23 - 0.92 - - - 40
Peridinium sp. 0.58 1.61 1.41 - - - 30
CHRYSOPHYCEAE
Mallomonas producta Iwanoff 1.17 - - 4.84 2.76 0.94 0.41 0.42 1.46 - 70
Mallomonas striata Asmund - - - - 0.92 1.42 0.41 0.42 2.04 2.31 60
EUGLENOPHYCEAE
Euglena sp. - - 5.63 - - 0.94 - - - 0.93 30
Phacus acuminatus Stokes - - - - 4.61 10.85 4.15 2.92 50.44 30.09 60
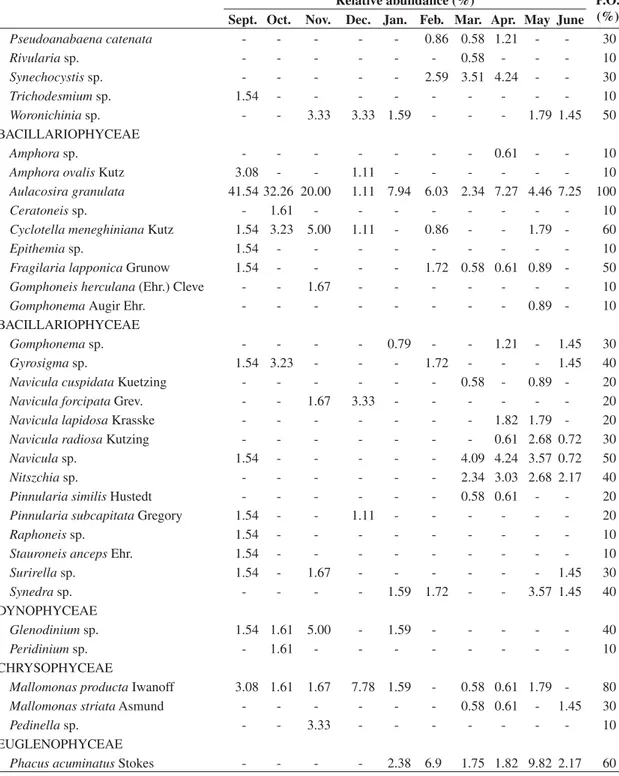
Table 4. Phytoplankton species and relative abundance distributed in the bottom water of Cruzeta, RN Reservoir during the annual cycle of 2004-2005.
Relative abundance (%) P.O.
(%)
Sept. Oct. Nov. Dec. Jan. Feb. Mar. Apr. May June
CHLOROPHYCEAE
Botryococcus braunii Kuetzing - 3.23 1.67 - 0.79 1.72 0.58 - - - 50
Chlamydocapsa bacillus (Teiling) Fott - - - 2.92 - - 0.72 20
Chorella sp. - 1.61 18.33 8.89 3.17 4.31 4.09 5.45 3.57 3.62 90
Closterium sp. - - - - 2.38 1.72 - - - - 20
Coelastrum cambricum Archer - 1.61 - - 1.59 1.72 0.58 0.61 - - 50
Coelastrum microporum Naegeli 1.54 1.61 1.67 1.11 3.17 2.59 0.58 1.21 0.89 0.72 100
Coleochaete pulvinata Smith - - - 3.97 0.86 - - 0.89 0.72 40
Cosmarium subcostatum Nordstedt 1.54 - - - 10
Crucigenia sp. - - - 4.31 1.17 0.61 - - 30
Cruciginela rectangularis (Naegeli) Komárek
- - 3.33 2.22 3.97 1.72 1.17 2.42 - - 60
Ctenocladus sp. - - - 0.58 - - - 10
Desmidium bailey (Ralfs) De Bary 1.54 - - - 10
Dictyosphaerium sp. - 3.23 1.67 - 3.97 0.86 0.58 0.61 0.89 - 70
Eudorina elegans Ehrenberg - - - 0.58 - - - 10
Eudorina sp. 1.54 12.90 8.33 7.78 4.76 4.31 3.51 2.42 2.68 1.45 100
Oedogonium sp. - - - 0.89 55.07 20
Oocystis sp. 1.54 9.68 5.00 12.22 2.38 0.86 1.75 4.85 0.89 1.45 100
Pandorina sp. - 6.45 1.67 5.56 5.56 2.59 4.09 3.03 2.68 1.45 90
Pediastrum sp. 3.08 - 1.67 - - - 1.45 30
Phacotus sp. - - - - 1.59 1.72 - 1.82 2.68 - 40
Pleodorina sp. - 3.23 - - - 4.24 1.79 - 30
Scenedesmus quadricauda (Turpin) Brébisson
10.77 - 6.67 37.78 41.27 43.10 54.39 43.03 35.71 8.7 90
Scenedesmus tibiscensis Uherkovich - 3.23 - 2.22 - 1.72 0.58 0.61 - - 50
Schroederia setigera (Schroder) Lemm - - - 0.89 - 10
Sphaerocystis schroeteri Chodat - 1.61 - - - - 0.58 - 0.89 - 30
Staurastrum leptocladum Nordstedt 1.54 - 1.67 - - 0.86 - - - - 30
Staurastrum striolatum (Naegeli) Archer
- 1.61 - - - 10
Staurodesmus triangularis (Lagerheim) Teiling
- - - 0.89 - 10
Tetradesmus sp. - - - 2.22 - - - 10
CYANOPHYCEAE Anabaena circinalis
Robenhorst ex Bornet et Flahault
- 1.61 - 1.11 0.79 - - - 2.68 0.72 50
Aphanocapsa sp. - - - - 0.79 - 1.75 - 1.79 - 30
Cylindrospermopsis raciborskii (Wolosz.) Seen. and Subba
4.62 - - - 10
Eucapsis sp. - - - - 2.38 - - - 0.89 - 20
Lyngbya sp. 6.15 - - - - 1.72 0.58 0.81 1.79 2.17 60
Oscillatoria limosa Ag. 1.54 1.61 1.67 - - - 30
Planktolyngbya contorta
(Smith) Echdrateva
- 1.61 1.67 - - - 20
Relative abundance (%) P.O. (%)
Sept. Oct. Nov. Dec. Jan. Feb. Mar. Apr. May June
Pseudoanabaena catenata - - - 0.86 0.58 1.21 - - 30
Rivularia sp. - - - 0.58 - - - 10
Synechocystis sp. - - - 2.59 3.51 4.24 - - 30
Trichodesmium sp. 1.54 - - - 10
Woronichinia sp. - - 3.33 3.33 1.59 - - - 1.79 1.45 50
BACILLARIOPHYCEAE
Amphora sp. - - - 0.61 - - 10
Amphora ovalis Kutz 3.08 - - 1.11 - - - 10
Aulacosira granulata 41.54 32.26 20.00 1.11 7.94 6.03 2.34 7.27 4.46 7.25 100
Ceratoneis sp. - 1.61 - - - 10
Cyclotella meneghiniana Kutz 1.54 3.23 5.00 1.11 - 0.86 - - 1.79 - 60
Epithemia sp. 1.54 - - - 10
Fragilaria lapponica Grunow 1.54 - - - - 1.72 0.58 0.61 0.89 - 50
Gomphoneis herculana (Ehr.) Cleve - - 1.67 - - - 10
GomphonemaAugir Ehr. - - - 0.89 - 10
BACILLARIOPHYCEAE
Gomphonema sp. - - - - 0.79 - - 1.21 - 1.45 30
Gyrosigma sp. 1.54 3.23 - - - 1.72 - - - 1.45 40
Navicula cuspidata Kuetzing - - - 0.58 - 0.89 - 20
Navicula forcipata Grev. - - 1.67 3.33 - - - 20
Navicula lapidosa Krasske - - - 1.82 1.79 - 20
Navicula radiosa Kutzing - - - 0.61 2.68 0.72 30
Navicula sp. 1.54 - - - 4.09 4.24 3.57 0.72 50
Nitszchia sp. - - - 2.34 3.03 2.68 2.17 40
Pinnularia similis Hustedt - - - 0.58 0.61 - - 20
Pinnularia subcapitata Gregory 1.54 - - 1.11 - - - 20
Raphoneis sp. 1.54 - - - 10
Stauroneis anceps Ehr. 1.54 - - - 10
Surirella sp. 1.54 - 1.67 - - - 1.45 30
Synedra sp. - - - - 1.59 1.72 - - 3.57 1.45 40
DYNOPHYCEAE
Glenodinium sp. 1.54 1.61 5.00 - 1.59 - - - 40
Peridinium sp. - 1.61 - - - 10
CHRYSOPHYCEAE
Mallomonas producta Iwanoff 3.08 1.61 1.67 7.78 1.59 - 0.58 0.61 1.79 - 80
Mallomonas striata Asmund - - - 0.58 0.61 - 1.45 30
Pedinella sp. - - 3.33 - - - 10
EUGLENOPHYCEAE
Phacus acuminatus Stokes - - - - 2.38 6.9 1.75 1.82 9.82 2.17 60
P.O. (%) – Percentage of occurrence. Table 4. Continued...
80 taxons were identified at the surface, 77 at mid-depth (2 m) and 72 at the bottom. Regarding the algal class, Chlorophyceae exhibited the highest number of species at the surface and at mid-depth (34 species) during the rainy season (29 and 28 species, respectively). There was a greater number of Bacillariophyceae at the bottom of
the reservoir (23) than at the surface and mid-depth (21). These relative abundances were expressed as class wise in three vertical profiles indicating explicitly the succes-sion sequence (Figures 6, 7 and 8).
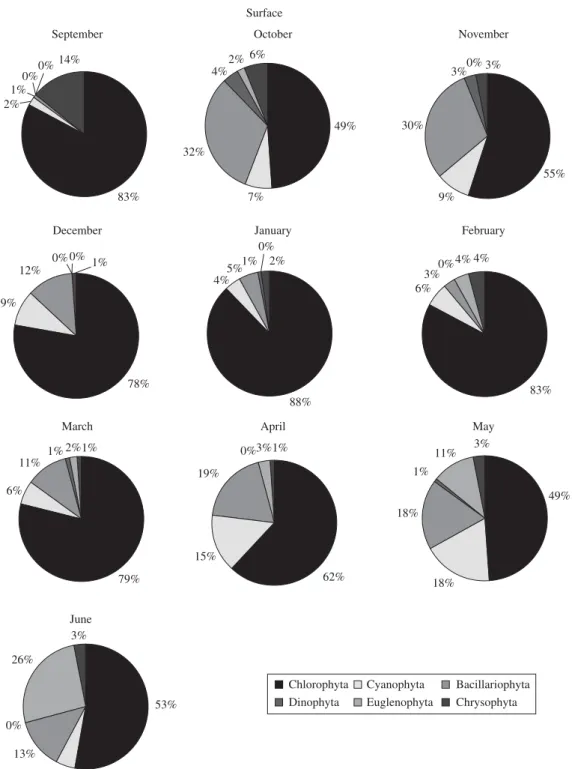
Chlorophyta Cyanophyta Bacillariophyta Dinophyta Euglenophyta Chrysophyta Surface
September November
January
March May
June
April
February December
October 14%
83% 2%
1% 0%0%
49%
7% 32%
4%2% 6%
55% 30%
3%0% 3%
9%
78% 9%
12% 1% 0% 0%
88% 4%5%
1% 2% 0%
83% 4%
4%
6% 3%0%
79% 6%
11%
1% 1% 2%
62% 15%
19%
3% 0% 1%
49% 3%
11% 1%
18%
18%
53% 3%
5% 13% 0%
26%
Figure 6. Phytoplankton distribution in surface waters of Cruzeta, RN reservoir from September 2004 to June 2005.
and the frequency of occurrence of phytoplankton in Cruzeta reservoir in the three vertical profiles during the annual cycle of 2004-2005. The largest amount of taxa was found in the rainy season at the surface (68) and middle (66) of the water column. Chlorophyceae domi-nated the surface during the entire study period except in September, when the Cyanophyceae dominated with
79%, the most frequent species being the potentially
tox-ic cyanobacteria Cylindrospermopsis raciborskii with a
Chlorophyta Cyanophyta Bacillariophyta Dinophyta Euglenophyta Chrysophyta Mid-Column
September
5%2%0%1%
79% 13%
November
January
March May
October
December February
April
June
55% 2%
31%
6% 6% 0%
1%
40%
52% 4%0%3%
71% 2%
12% 0% 7%
8% 0% 5%
76% 13%
6%
57% 34%
6% 3% 0%
50% 4%
31%
9% 6% 0% 12%
79% 4%0%4%1%
3%3% 1% 5% 4%
84%
0%
55% 6%
6%
25%
8%
was followed by Cyanophyceae and in June, when they were followed by Euglenophyceae dominance (26%). The most abundant Chlorophyceae species at the surface
wereScenedesmus quadricauda (Turpin) Brébisson and
Chorella sp.. The dominance of phytoplankton groups
in the middle of the water column in September, October, November, December and June behaved in the same manner that was observed at the surface. In January and February a dominance of Chlorophyceae
was observed, followed by Euglenophyceae, while in March Chlorophyceae (79%) was dominant, followed by Cyanophyceae (12%). Cyanophyceae dominated in April (dry period) with 52%, followed by Chlorophyceae with 31%. A growth in Euglenophyceae (50%) occurred in May, when it became dominant, particularly the
spe-cies Phacus acuminatus Stokes (relative abundance
Chlorophyta Cyanophyta Bacillariophyta Dinophyta Euglenophyta Chrysophyta
September November
January
March May
2% 0%
3% 23%
14% 58%
52%
8%
78%
77% 56%
June
April
February December
October
76% 4%
17%
71% 1%
2% 0%
0%
0% 0%7%
75% 80%
50% 40%
3%0%2%
5%
0% 8%
8%
4%
6% 12%
20%
6%
2% 1%
2% 10%
9% 23% 9%
11%0%
0% 2%1%
2% 2% 2% 10% 6%
30%
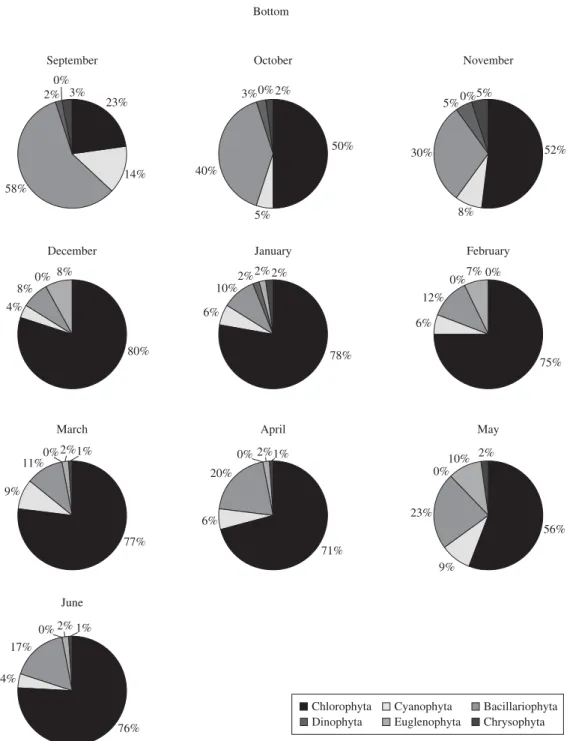
5%0%5% Bottom
in September when there was a strong dominance of Bacillariophyceae. The percentage dominance for these phytoplanktonic species is presented in Table 5.
Table 6 presents some significant correlation between environmental variables and dominant phytoplankton groups on the spatial-temporal scale. A significant corre-lation was established for cyanobacterial abundance with water temperature, dissolved oxygen concentration and transparency during the dry period. Bacillariophyceae correlated positively to water transparency and
ortho-phosphate levels specifically at the bottom during the dry period and with pH, electrical conductivity and or-thophosphate during the wet period. The other dominant group, Chlorophyceae, positively correlated to pH, ni-trate and electrical conductivity.
Table 5. Density of species (ind.mL–1) dominance at surface, mid-column and bottom waters of Cruzeta, RN reservoir during September/04 to June/05.
Surface P.O.
(%)
Sept. Oct. Nov. Dec. Jan. Feb. Mar. Apr. May June
CHLOROPHYCEAE
Chlorella sp. - 1.100 700 1.600 1.400 1.000 700 400 1.500 2.700 90
Coelastrum cambricum Archer 100 100 - - 100 200 100 100 100 100 80
Coelastrum microporum Naegeli 350 150 100 200 600 200 200 100 300 200 100
Cruciginela rectangularis (Naegeli) Komárek
150 - 800 300 1.900 400 700 500 500 300 90
Dictyosphaerium sp. 950 200 100 200 100 600 700 300 100 100 100
Eudorina sp. 250 150 400 900 1.100 700 600 200 400 400 100
Oocystis sp. 750 350 600 400 500 700 1.00 800 300 500 100
Pandorina sp. 300 100 400 300 500 2.200 500 100 100 400 100
Scenedesmus quadricauda (Turpin) Brébisson
- - 300 1.300 4.100 5.800 9.300 4.300 4.900 3.300 80
CYANOPHYCEAE
Anabaena circinalis Robenhorst ex
Bornet et Flahault
100 100 - 100 100 500 100 200 200 100 90
BACILLARIOPHYCEAE
Aulacoseira granulata 350 800 1.400 200 100 300 400 300 700 600 100
Navicula forcipata Grev. - - 200 500 100 100 700 700 600 300 80
CHRYSOPHYCEAE
Mallomonas producta Iwanoff 100 200 200 100 300 400 100 100 500 - 90
Mid-Collum
CHLOROPHYCEAE
Chorella sp. - 1.600 1.200 600 4.000 2.100 800 800 1.600 2.600 90
Coelastrum microporum Naegeli 200 100 100 100 600 - 100 100 100 200 90
Cruciginela rectangularis (Naegeli) Komárek
- 450 400 300 1.700 300 1.000 600 300 400 90
Dictyosphaerium sp. - 150 100 100 200 300 200 100 - 200 80
Eudorina sp. 500 200 400 500 400 1.200 1.800 400 400 100 100
Oocystis sp. 500 150 600 400 200 900 700 1.000 500 1.000 100
Pandorina sp. 200 100 - 200 1.100 800 1.300 100 800 300 90
Scenedesmus quadricauda (Turpin) Brébisson
- - 500 2.200 7.400 6.500 10.600 5.000 5.500 3.800 80
CYANOPHYCEAE
Anabaena circinalis Robenhorst ex
Bornet et Flahault
100 100 100 100 200 200 200 - - 100 80
Woronichinia sp. - - 200 300 200 300 300 300 300 200 80
BACILLARIOPHYCEAE
Aulacoseira granulata 400 1.350 1.600 300 300 900 100 200 200 900 100
Bottom
CHLOROPHYCEAE
Chorella sp. - 100 1.100 800 400 500 700 900 400 500 90
Coelastrum microporum Naegeli 100 100 100 100 400 300 100 200 100 100 100
Eudorina sp. 100 800 500 700 600 500 600 400 300 200 100
Oocystis sp. 100 600 300 1.100 300 100 300 800 100 200 100
Pandorina sp. - 400 100 500 700 300 700 500 300 200 90
Scenedesmus quadricauda (Turpin)
Brébisson
Bottom P.O. (%)
Sept. Oct. Nov. Dec. Jan. Feb. Mar. Apr. May June
BACILLARIOPHYCEAE
Aulacosira granulata 2.700 2.000 1.200 100 1.000 700 400 1.200 500 1.000 100
CHRYSOPHYCEAE
Mallomonas producta Iwanoff 200 100 100 700 200 - 100 100 200 - 80
Criteria of dominance based on Matucci and Colma (1982): 76 -100% Dominants
P.O. (%) – Percentage of occurrence. Table 5. Continued...
Table 6. Pearson correlation coefficient values between abiotic factors and phytoplankton classes (P < 0.01).
Variables Dry Season Rainy Season
Surface Mid-Column Bottom Surface Mid-Column Bottom
Temperature and Bacillariophyceae –1.00 –0.82 - - -
-Cyanophyceae and Nitrate –0.96 - - - -
-Euglenophyceae and Orthophosphate 0.98 - - - -
-Chlorophyceae and Dissolved Oxygen 0.80 –0.90 - - -
-Euglenophyceae and pH - - - 0.98 -
-Orthophosphate and
Bacillariophyiceae / Euglenophyceae
- - - 0.87 / 0.85 -
-Chlorophyceae and Transparency - 0.99 –0.97 - -
-Bacillariophyceae and Rainfall - –0.98 - - -
-Cyanophyceae and
Transparency / Conductivity
- 0.86 / –0.82 - - -
-Cyanophyceae and
Conductivity / Orthophosphate
- - - - 0.82 / 0.83
-Chlorophyceae and
Conductivity / Orthophosphate
- - - - 0.83 / –0.87
-Chlorophyceae and pH/ Conductivity - - 0.93 / 0.97 - -
-Cyanophyceae and Ammonium - - 0.97 - -
-Bacillarioficeae and Transparency - - 0.97 - -
-Bacillariophyceae and pH - - –0.99 - - 0.83
Bacillariophiceae and Orthophosphate - - 0.92 - - 0.93
Bacillariophyceae and Conductivity - - –0.99 - - 0.98
Bacillariophyceae and Nitrate - - –0.8 - -
-Table 7. Species richness, Species diversity, Dominance, Equitability and Total Density of species during the annual cycle of 2004-2005.
Months Richness Diversity Dominance Equitability Total density (ind.mL–1)
S M B S M B S M B S M B S M B
Sept./04 6.75 5.20 6.29 2.22 2.29 3.43 0.68 0.67 0.42 1.49 1.68 2.45 28.000 17.100 6.500
Oct./04 7.68 6.33 5.54 4.44 3.75 3.99 0.18 0.26 0.32 3.01 2.68 2.97 6.000 6.200 6.200
Nov./04 6.51 4.93 5.82 4.02 3.68 3.60 0.20 0.23 0.20 2.84 2.83 2.64 6.900 7.100 6.000
Dec./04 3.66 4.48 4.05 3.35 3.39 3.13 0.24 0.35 0.38 2.85 2.70 2.54 6.700 6.200 9.000
Jan./05 6.10 6.00 5.37 3.45 3.46 3.45 0.33 0.34 0.41 2.44 2.42 2.53 12.300 21.700 12.600
Feb./05 5.88 7.17 6.15 3.53 3.57 3.46 0.33 0.31 0.43 2.49 2.37 2.45 17.800 21.200 11.600
Mar./05 10.01 6.62 7.09 3.58 3.08 3.06 0.47 0.44 0.54 2.18 2.09 2.05 19.700 24.100 17.100
Apr./05 10.30 6.85 6.40 4.50 2.75 3.41 0.29 0.49 0.43 2.74 1.84 2.36 15.000 24.000 16.500
May/05 9.55 8.82 7.41 4.30 3.13 3.89 0.25 0.50 0.36 2.65 1.94 2.61 19.600 34.300 11.200
June/05 3.35 3.63 2.75 3.35 3.63 2.75 0.26 0.52 0.55 2.15 2.39 0.66 18.200 21.600 13.800
values of specific diversity, and equitability (similarity), richness and dominance were observed at the surface and bottom waters than at mid-column. In relation to the dry and wet seasons, there was greater diversity and less evenness during the rainy period. In September 2004, an
invasive species of cyanobacterium, Cylindrospermopsis
raciborskii, dominated both at the surface and the
mid-dle of the water column and never repeated. An elevated
dominance of Scenedesmus quadricauda, Oocystis sp.
and Oedogonium sp., members of Chlorophyceae was
also observed at the bottom in March and June of 2005. The dominance of these three species determined a re-duction in the diversity values in the dry/wet phases of the annual cycle. Phytoplankton species diversity is ad-dressed in relation to three hydroperiods with six repli-cates for each period which reflect the level of organi-zation of the phytoplankton community of Cruzeta, RN reservoir. Phytoplankton species diversity and evenness reflect important processes such as growth, sedimenta-tion, possible grazing losses and nutrient assimilasedimenta-tion, which varied markedly in relation to spatial heterogene-ity and the dry/wet annual cycle. The present study re-veals three hydroperiods, such as the dry period (Sept. to Dec. 2004), the wet period (Jan. to Feb. 2005 and Apr. to June 2005) and the peak rainy period of March 2005. The species diversity and equitability indices were great-ly reduced in March 2005 largegreat-ly due to low attenuation of light due to the accumulation of high suspended mate-rials near the surface.
4. Discussion
Shallow water reservoirs (mean depth <6 m) are dominant freshwater systems in the Rio Grande do Norte State and are more vulnerable to human impact on phy-toplankton dynamics and inland fisheries of the State (Chellappa and Chellappa, 2004). The spatio-temporal distributions of major phytoplankton taxa were quanti-fied to estimate the relative contribution to abundance, cyanobacterial bloom dynamics and chlorophyll biomass in the oligo-mesotrophic Cruzeta, RN reservoir during the annual cycle of 2004-2005. The results are discussed within the framework of shallow water freshwater eco-systems principle and to highlight how phytoplankton community structure, diversity and biomass respond to clear and turbid water conditions during the dry and wet cycles of semiarid climate (Bouvy et al., 2003).
Depth influences sinking loss of phytoplankton and its suspension to surface layer in deep water reservoirs and lakes, while the pronounced effect experienced by phytoplankton under light regime in shallow waters is because of the light attenuation coefficient of the mixed layer (Shaffer, 2004). The present study indicates that the mean depth was never more than 4 m throughout the study period, of mostly an isothermal characteristic with no marked stratification. The light regime experi-enced by the phytoplankton varied on a seasonal basis, with more light penetration in the dry than wet period
and the chlorophyll biomass linearly linked to the light regime than to phytoplankton abundance. Such findings are similar to the results of the Parelhas, RN reservoir (Chellappa et al., 2006). The polymictic nature of semi-arid reservoirs where elevated daytime and low nighttime temperatures characterize the diurnal cycle, favor impor-tant convective movements in the mixing of the water column and the consequent rise of nutrients to the water surface (Bouvy et al., 1999; Chellappa and Costa, 2003). The earlier study of Barbosa and Tundisi (1980) regis-tered such phenomena in other shallow water lakes in Brazil and they considered it as an efficient mechanism of the recycling process in tropical waters and conse-quently improved primary production. The results of nu-trient values found in the present study is akin to the re-search performed by the earlier studies of Chellappa and Chellappa (2004) for the Rio Grande do Norte State, in which the data on surface and bottom concentrations of phosphorous were generally similar, with the exception of September, when phosphorous concentration at the bottom was much greater than that at the surface.
Cruzeta reservoir of Rio Grande do Norte main-tained a high phytoplankton species richness (90 taxons) during the 2004-2005 annual cycle, which is very nearly similar to the report of Train et al. (2005) on algal species in three reservoirs in the Parana basin-Irai, Salto do Vau and Rosana, where phytoplankton was distributed in the following classes: Chlorophyceae (32), Cyanophyceae (17), Bacillariophyceae (15), Chrysophyceae (5), Zygnematophyceae (5), Xanthophyceae (3) and Dinophyceae (2). However, Huszar and Giani (2004) pointed out that the phytoplankton community might present a different pattern in vertical distribution, as a result of the physical structuring of the water mass and the capacity of algae to regulate their position through specific adaptive strategies. The present study demon-strates that Bacillariophyceae was more abundant in mid-column and bottom waters, while Chlorophyceae and Cyanobacteria are more abundant in the surface and mid-column of the reservoir mostly as a response to surface/volume ratio of these groups and the differential buoyancy mechanism.
Bicudo et al. (1999) attributed the high diversity of species found to the mixing of the water column, which changes the progress of succession to a condition of equi-librium. Thus, the presence of an unbalanced community triggers high diversity indices. Moran et al. (1997) ob-served that the biodiversity indicator is fundamental in assessing ecological stability in environments. The high diversity values obtained in the present study can be considered an indicator of the stability of Cruzeta, RN reservoirs because of two reasons: it maintained multi-species phytoplankton in the annual cycle, as evidenced by moderate indices of equitability and the restriction of high dominance index by cyanobacteria only on a rare occasion (September, 2004).
ecosystems. Through the contribution of nutrients and materials in suspension (runoff), light penetration is re-duced and chemical conditions and mixing of the water, triggers the succession process. Giani and Figueiredo (1999), in a study performed at the Pampulha reservoir, Minas Gerias, Brazil, reported that rainfall acts as a di-luting factor and, at the same time, a disturber of aquatic communities, having a strong influence on the compo-sition of phytoplankton species as well as on total bio-mass.
Nutrient dynamics is usually linked to seasonal vari-ation and the degree of allochthonous input to the res-ervoirs. Nutrient availability in shallow lakes differed profoundly between shallow polymictic lakes to deep stratified lakes (Scheffer, 2004). The nutrient loss is con-tinuous through sinking in deep waters from epilimnion to hypolimnion, while shallow waters frequently replen-ish nutrients through efficient recycling and elevated mixing regime (Barbosa and Tundisi, 1980; Scheffer, 2004). The low N/P ratio coupled with high temperature favor cyanobacterial blooms (Smith, 1983), but in the present study, such observation was made only during
a single incidence of Cylindrospermopsis raciborskii
bloom in September 2004 while the rest of the results tend to contradict the influence of low N/P ratio.
Shapiro (1973) attributed the dominance of Cyanophyceae in fresh water reservoirs mainly to water
temperature, light, CO2 and pH. Chellappa (1990)
ar-gued that the semi-arid reservoirs of northeast Brazil had suffered greatly from the effects of the environmental impact of cultural eutrophication, which favor the drastic increase in Cyanophyceae populations and cause reduced diversity in microalgae species. Branco and Senna (1996)
reported an abundant presence of Cylindrospermopsis
raciborskii in Paranoá Lake in Brasilia in the last
three decades of the 20th century, reaching densities of
1.0x10⁸ trichomes per liter that represented the main
cause of high phytoplankton densities. The presence and
the abundance of C. raciborskii were also reported for
a eutrophic ecosystem in São Paulo state for short and long-term periods (Tucci and Sant’ana, 2003). According
to Padisák (1997), Cylindrospermopsis raciborskii has
been considered an expanding species in various parts of the world, and presented potential toxicity and a tenden-cy to bloom formation. Its ecological success is due to various factors: migration capacity in the water column; tolerance to low luminosity; high capacity for phosphate and ammonium absorption; capacity to fix atmospheric nitrogen; herbivory resistance; and the ability of this alga to fix inorganic carbon at high pH values or the capac-ity to use bicarbonates directly as a source of carbon (Golterman et al., 1978).
The Cruzeta reservoir exhibits great phytoplank-ton diversity with a total of 90 taxa distributed into 6 classes. Chlorophyceae dominated most of the
time, the most frequent taxons were: Scenedesmus
quadricauda,Chlorellasp.,Eudorina sp., Pandorinasp.,
Dictyosphaerium sp. and Oocystis sp. Toxic
cyanobac-teria, such as Cylindrospermopsis raciborskii,
domi-nate occasionally and preferentially during the dry pe-riod, possibly as a result of increased temperature and
transparency. Bacillariophyceae, such as Aulacoseria
granulata, is frequent in the environment. The increase
in the Phacus acuminatus population (Euglenophyceae)
coincided with the increase in pH and the greater con-centrations of orthophosphate. The reservoir is charac-teristically an oligo-mesotrophic environment.
Acknowledgements — We thank CAPES/MEC for the scholarship awarded to one of us (J.L.M.B), CNPq (Proc. No.475619/2004-8) for the research Grant and UFRN for the overall facilities provided.
References
APHA. American Public Health Association, 1985. Standard methods for examination of water and wasterwater. 16 ed. 1527 p.
AZEVEDO, SMFO., EVANS, W., CARMICHAEL, WW. and NAMIKOSHI, W., 1994. First report of Microcystins from a Brazilian isolate of the Cyanobacterium Microcystis aeruginosa. Jour. Appl. Phycol., vol. 6, no. 3, p. 261-265.
BARBOSA, FAR. and TUNDISI, JG. 1980. Primary production of phytoplankton and environmental characteristics of a shallow quaternary lake at Eastern Brazil. Arch.Hydrobiol., vol. 90, no. 2, p. 139-161.
BARBOSA, FAR., BICUDO, CEM. and HUSZAR, VLM. 1995. Phytoplankton studies in Brazil: Community structure variation and diversity. In: TUNDISI, JG., BICUDO, CEM. and TUNDISI, JG (Eds.). Limnology in Brasil. Rio de Janeiro: Academia Brasileira de Ciências; Sociedade Brasileira de Limnologia. p. 19-36.
BICUDO, CEM., RAMIREZ, JJ. and TUCCI, A. 1999. Dinâmica de populações fitoplanctônica em ambiente eutrofizado: Lago das Garças, São Paulo. In: HENRY (Ed.). Ecologia de Reservatórios. Botucatu/SP: Ed. FUNDIBIO, FAPESP. p. 449-508.
BOUVY, M., FALÇÃO, D., MARINHO, M., PAGANO, M. and MOURA, A. 2000. Occurrence of Cylindrospermopsis (Cyanobacteria) in 39 Brazilian tropical reservoirs during the 1998 drought. Aquat. Microbiol. Ecol., vol. 23, no.1, p. 13-27. BOUVY, M., NASCIMENTO, SM., MOLICA, RJR., FERREIRA, A., HUSZAR, VL. and AZEVEDO, SMFO. 2003. Limnological features in Tapacurá reservoir (northeast Brazil) during a severe drought. Hydrobiol., vol. 493, no. 1, p. 115-130. BRANCO, CWC. and SENNA, PAC., 1996. Phytoplankton composition, community structure and seasonal changes in a tropical reservoir (Paranoá Reservoir, Brasil). Algol. Stud., vol. 81, no.1, p. 69-84.
CARPENTER, SR., KITCHELL, JF. and HODGSON, JR. 1985. Cascading trophic interactions and lake productivity. Bioscien. vol. 35, no.10, p. 634-639.
CHELLAPPA, NT., AMORIM, JMF., BEZERRA, TA., OLIVEIRA, VC. and COSTA, IA. 1996. Studies on microalgae of Rio Grande do Norte, Brazil. A comparison of phytoplankton assemblages of oligotrophic and eutrophic lake. Beih. Beih. Nova Hedwigia, vol. 12, (Special edition), p. 513-542. CHELLAPPA, NT., CHELLAPPA, T., LIMA, AKA., BORBA, JLM., SOUZA, PVV. and CHELLAPPA, S. 2006. Ecology of freshwater phytoplankton assemblages from a tropical reservoir of Northeastern Brazil. International Jour. Lakes Res. vol. 1, no. 1, p. 61-73.
CHELLAPPA, NT. and COSTA, MAM. 2003. Dominant and co-existing species of cyanobacteria from a eutrophicated reservoir of Rio Grande do Norte State. International Journal of Ecology. Acta Oecol. vol. 24, no 1, p. 3-10.
CHELLAPPA, NT., MARINHO, IR. and COSTA, MAM. 2000. Harmful cyanobacterial blooms from semiarid freshwater ecosystems of Northeast Brazil. Aust. Soc. Limnol. Newsletter, vol. 38, no. 1, p. 45-49.
CHELLAPPA, S. and CHELLAPPA, NT. 2004. Ecology and Reproductive plasticity of Amazonian Cichlid fishes introduced to the freshwater ecosystems of the semiarid Northeast Brazil. In: Kaul, BR. (Ed.). Advances in Fish and Wildlife Ecology and Biology. New Delhi, India: Daya Publications. p. 45-57. CODY, ML. 1996. Introduction to long-term community ecological studies. In: CODY, ML. and SMALLWOOD, JA. (Eds.).Long-term studies of vertebrate communities. San Diego, USA: Academic Press. p. 1-15.
GIANI, A. and FIGUEIREDO, CC. 1999. Recorrência de padrões sazonais do fitoplâncton num reservatório eutrófico: reservatório da Pampulha (MG). In HENRY, R. (Ed.). Ecologia de Reservatórios. Botucatu/SP: Ed. FUNDIBIO, FAPESP. p. 531-550
GOLTERMAN, HL., CLYMO, RS. and OHNSTAD, MAM., 1978. Methods for physical and chemical analysis of Freshwaters. IBP Handbook. Oxford: Blackwell Sci. Publ. 215 p.
HENRY, R. 1999. Ecologia de Açudes: Estrutura, função e Aspectos Sociais. Botucatu, SP: Ed. FUNDIBIO; FAPESP. 799 p.
HUSZAR, VLM., SILVA, LHS., MARINHO, M., DOMINGOS, P. and SANTANNA, CL. 2000. Cyanoprokaryote assemblages in eight productive tropical Brazilian waters. Hydrobiol. vol. 424, no. 1-3, p. 67-77.
HUSZAR, VLM. and GIANI, A. 2004. Amostragem fitoplanctônica em águas continentais: Reconhecimento de padrões espaciais e temporais. In BICUDO, CEM. and BICUDO, DC. (Orgs.). Amostragem em Limnologia. São Carlos: Ed. Rima. p. 133-147, cap. 8.
KIMMEL, BL., LIND, OT. and PAULSON, LJ. 1999. Reservoir primary production. In THORNTON, KW., KIMMEL, BL., PAYNE, FE. (Eds.). Reservoir limnology: ecological perspectives. New York: J. Wiley & Sons. p. 133-194.
MEDEIROS, JL. 2005. Caracterização da Comunidade Fitoplanctônica do Açude de Cruzeta/RN. Pós-graduação em
Bioecologia aquática. Natal: Universidade Federal do Rio Grande do Norte. 141 p. [Dissertação Mestrado].
MEIJER, ML., VAN NES, EH., LAMMENS, EHHR. and GULATI, R. 1994. The consequences of a drastic fish stock reduction in small shallow lake Wolderwijd, The Netherlands – Can we understand what happened?. Hydrobiol.., vol. 276, no. 1, p. 31-42.
MORAN, D., PEARCE, D. and WENDELAAR, S. 1997. Investing in biodiversity: an economic prospect on global priority. Biodivers.Conserv. vol. 6, no. 9, p. 1219-1243. NOGUEIRA, MG., JORCIN, A., VIANNA, NC. and BRITTO, YCT. 2005. Reservatórios em cascata e os efeitos na limnologia e organização das comunidades Bióticas (Fitoplâncton, Zooplâncton e Zoobentos) – Um estudo de caso no Rio Paranapanema (SP/PR). In NOGUEIRA, MG., HENRY, R. and JORCIN, A. (Orgs.). Ecologia de reservatórios. São Carlos, SP: RiMa. p. 83-125.
PADISÁK, J. 1997. Cylindrospermopsis raciborskii (Woloszynnska) Seenayya et Subba Raju, an expanding, highly adaptive cyanobacterium: worldwide distribution and review of its ecology. Arch. Für. Hybrobiology, vol. 107, no. 4, p. 563-593.
PINTO-COELHO, RM., AZEVEDO, LMA., RIZZI, PEV., BEZERRA-NETO, JF. and ROLLA, ME. 2005. Origens e efeitos do aporte externo de nutrientes em um reservatório tropical de grande porte: Reservatório de São Simão (MG, GO). In NOGUEIRA, MG., HENRY, R. and JORCIN, A. (Orgs.). Ecologia de reservatórios. São Carlos, SP: RiMa. p. 127-164. SHANNON, CE. and WEAVER, W. 1949. The mathematical theory of communication. Illinois, Urbana, USA: Ed. John Wiley & Sons. 125 p.
SHAPIRO, J. 1973. Blue-green algae: Why they become dominant. Sci. NY, vol. 179, no. 4, p. 382-384.
SMITH, V. 1983. Low nitrogen to phosphorus ratios favor dominance by blue green algae in Lake phytoplankton. Sci. NY, vol. 221, no. 8, p. 669-671.
TRAIN, S., JATI, S., RODRIGUES, LC. and PIVATO, BM. 2005. Distribuição espacial e temporal do fitoplâncton em três reservatórios da bacia do Paraná. In RODRIGUES, L., THOMAZ, SM., AGOSTINHO, AA. and GOMES, LC. (Orgs.). Biocenose em reservatórios – padrões espaciais e temporais. São Paulo, SP: Ed. RIMA. p. 73-85.
TUCCI, A. and SANT’ANNA, CL. 2003. Cylindrospermopsis raciborskii (Woloszynska) Seenayya & Subba raju (cyanobacteria): variação semanal e relações com fatores ambientais em um reservatório eutrófico, São Paulo, SP, Brasil. Revista Brasil. Bot., vol. 26, no. 1, p. 97-112.
TUNDISI, JG., MATSUMARA-TUNDISI, T. and ROCHA, O. 1999. Theoretical basis for reservoir managemente. In TUNDISI, JG. and STRAKRABA, M. (Eds.). Theoretical reservoir ecology and its applications. São Carlos: International Institute of Ecology – IIE.