Dynamic Maintenance Strategy, the Panacea to
Materials Wastage from Machinery
M.K. Adeyeri, B. Kareem, S.P. Ayodeji, and I. Emovon
ABSTRACT - Many findings on the determination of the performance and efficiency of Nigeria industries were not favourable. The past studies found the performance of many of the indigenous manufacturing and production industries to be low. Low efficiency or poor output was attributed to some factors including inadequate infrastructural facilities, poor maintenance culture and materials wastage from machinery poorly maintained. The research work is aimed at discussing the material wastage from machinery.
Production data are collected from two viable industries through a structured questionnaire to ascertain the losses accrued from machinery engaged for production for five (5) years taking cognizance of machinery age, wear-out and failure. It is to be noted that the fifth year data is used as a control when proper maintenance culture had been adopted by the industries used as case studies.
Statistical analysis test was carried out on the data and it is evident that the machinery efficiency is far better when proper maintenance is adopted compared to the initial practice. Indeed maintenance cannot be traded off for any reason in a virile production firm. As to this, it is recommended that industries should adopt maintenance culture, which are suitable and as well increase production efficiency and better products.
Key words: Dynamic strategy, low efficiency, Machinery, maintenance culture, material wastage
I. INTRODUCTION
From literature, the definition of the term “maintenance strategy” is viewed from the perspective of maintenance policies such as corrective or breakdown maintenance, preventive maintenance and predictive maintenance or condition based maintenance. Sometimes, maintenance concepts like total productive maintenance or reliability-centered maintenance are also included.
Maintenance strategies such as reactive strategy (corrective maintenance), proactive strategy (Preventive Maintenance and Condition based Maintenance); and aggressive strategy (Total Productive Maintenance) [3]. These are further viewed under four strategic dimension as service-delivery options; organization and work structuring; maintenance methodology; and support systems [4].
Manuscript recieved on 22nd March, 2011 and revised till 5th April 2011 1M.K. Adeyeri, 2B. Kareem, 3S.P. Ayodeji, and 4I. Emovon all lecture in
the department of Mechanical Engineering, at the Federal University of Technology, Akure, Ondo State, Nigeria with the following respective e-mail addresses and mobile number: 1[email protected]; 2[email protected];3[email protected]
4[email protected]1+2348060218116 ; 2+2348033373725; 3+2348036709782, 4+2348037092646
The maintenance strategy is defined as a functional hierarchy level similar to manufacturing or any other function. It is a series of unified and integrated pattern of decisions that are based on Hayes and Wheelwright’s decision elements of manufacturing strategy [5].
The maintenance strategies are generally categorized as corrective (reactive) and preventive (proactive). The corrective maintenance is an unscheduled maintenance attempting to restore a system after a failure occurs. The preventive maintenance strategy, on the other hand, is to schedule proactive maintenance routinely by designed
inspection, detection, and repair/replacement. A
cost-effective preventive maintenance policy can significantly extend a system’s life and reduce the number of failures, which, in return, reduces the total cost of maintenance. Most systems inevitably experience performance deterioration, which ultimately leads to a system’s weakness that causes failures [6].
In the literature, there are several published papers on field of maintenance.
Equipment maintenance and reliability are important strategies that considerably influence the organization's ability to compete effectively. The present work is aimed at strategizing maintenance with product demand in order to reduce material wastage from machineries failures or breakdown, inventory and order backlog.
II. FORMULATED MAINTENANCE STRATEGIES
The maintenance strategies developed for the research work entails inculcating demand (D) for the product and the range of severity μi, which is a function of the mean time to
maintain machine (tb), and expected running time of
machine (te). This severity is expressed in equation (1)
below as
(1)
The range of severity μi will determine whether to carryout
preventive, breakdown and predictive maintenance, or their combination in group or otherwise.
High value of tb b
e
t
t
i.e. above 0.5 indicates highIf demand can be satisfied at this level, opportunistic breakdown maintenance could be good, if it is not, opportunistic preventive maintenance backup with condition monitoring could be better. In case of
which shows that not more than 20% of time is available for predictive and preventive maintenance, opportunistic predictive maintenance based on dynamic grouping or opportunistic grouping is good. If demand is satisfied at this level, dynamic grouping is adopted, if not, opportunistic grouping is carried out.
In case of , at this level, maintenance severity is moderate. Planned preventive and breakdown maintenance will be worthwhile based on static and opportunistic grouping. If demand is satisfied, static grouping is good, else, opportunistic grouping is proposed. Spare part inventory is necessary when
0.5
. The actual production, Pactual is expressed as(2)
Where
Pt = total output/ expected output
Pi = total loss due to maintenance activities
The following dynamic conditions are being strategised for actual production as a function of demand and the maintenance activities:
i. If Pactual < demand, and µ < 0.5, breakdown
maintenance based on opportunistic and static grouping is preferred.
ii. If Pactual < demand, and μ > 0.5, preventive and
dynamic maintenance based on opportunistic grouping is recommended.
iii. If Pactual < demand, and μ < 0.5, breakdown
maintenance based on static opportunistic grouping is preferred.
iv. If
P
actual
demand
, and
0.5
, preventive,predictive maintenance with opportunistic and dynamic grouping is recommended.
v. If
P
actual
demand
, and
0.5
, dynamicmaintenance strategy based on static and opportunistic grouping with little or no inventory is employed.
vi. If
P
actual
demand
, and
0.5
, opportunisticor static maintenance strategy is employed with little or no inventory
III. METHODOLOGY
Structured questionnaires were administered to a vegetable oil and cocoa industries as well as oral interview were used to ascertain the research objectives and major machineries in the industries were considered. The process starts from the point of loading raw material (soya beans) into the silos, from silo to crusher, crusher to flaker and this runs through to the process end point. Four consecutive years’ records on input of materials at each process unit as conveyed by the conveyor are considered. For the purpose of the number of
pages constraint of this conference, a process unit is considered by noting the number of tons input into the cracker and as well as determining the cracker’s output. Thus, the material wastage is determined.
The fifth year, which is the year when the dynamic strategies formulated above were adopted, data collected during this period were as well analysed to ascertain the effectiveness of the strategies formulated.
Table (1-10) shows the tabulated input, output and monthly wastes of material records for both industries A and B. Table 11 shows the efficiency of the two machines which are calculated for from table 1-10.
IV. METHODOLOGY
Structured questionnaires were administered to a vegetable oil and cocoa industries as well as oral interview were used to ascertain the research objectives and major machineries in the industries were considered. The process starts from the point of loading raw material (soya beans) into the silos, from silo to crusher, crusher to flaker and this runs through to the process end point. Four consecutive years’ records on input of materials at each process unit as conveyed by the conveyor are considered. For the purpose of the number of pages constraint of this conference, a process unit is considered by noting the number of tons input into the cracker and as well as determining the cracker’s output. Thus, the material wastage is determined.
The fifth year, which is the year when the dynamic strategies formulated above were adopted, data collected during this period were as well analysed to ascertain the effectiveness of the strategies formulated.
Table (1-10) shows the tabulated input, output and monthly wastes of material records for both industries A and B. Table 11 shows the efficiency of the two machines which are calculated for from table 1-10.
Table 1: Industry A Material input and output data in ton at year 2005 on cracker machine
Month Jan Feb Mar Apr May Jun
Cracke
r Machi
n
e
input 1650 1540 1705 1705 1705 1700 output 1620 1512 1674 1674 1674 1670 Waste
(ton) 30 28 31 31 31 30
Month Jul Aug Sep Oct Nov Dec input 1650 1680 1700 1705 1705 1730 output 1620 1650 1670 1674 1674 1699 Waste
Table 2: Industry A Material input and output data in ton at year 2006 on cracker machine
Table 3: Industry A Material input and output data in ton at year 2007 on cracker machine
Table 4: Industry A Material input and output data in (ton) at year 2008 on cracker machine
Table 5: Industry A Material input and output data at year 2009 on cracker machine ( with adoption of dynamic maintenance strategies)
Table 6: Industry B Material input and output data in (ton) at 2005 on Choco ball mill
Table 7: Industry B Material input and output data in (ton) at 2006 on Choco ball mill
Table 8: Industry B Material input and output data in (ton) at year 2007on Choco ball mill
Table 9: Industry B Material input and output data in (ton) at 2008 on Choco ball mill
Month Jan Feb Mar Apr May Jun
Cracke
r Machi
n
e
input 1650 1540 1705 1705 1705 1700 output 1620 1512 1674 1674 1680 1670 Waste
(ton) 30 28 31 31 25 30
Month Jul Aug Sep Oct Nov Dec input 1649 1670 1700 1700 1710 1740 output 1619 1648 1670 1670 1675 1710 Waste
(ton) 30 22 30 30 35 30
Month Jan Feb Mar Apr May Jun
Cr
ac
k
er
m
ach
in
e
input 1800 1680 1800 1800 1800 1800 output 1770 1652 1770 1770 1770 1770 Waste
(ton) 30 28 30 30 30 30
Month Jul Aug Sep Oct Nov Dec input 1800 1850 1850 1850 1850 1850 output 1769 1820 1820 1820 1820 1820 Waste
(ton) 31 30 30 30 30 30
Month Jan Feb Mar Apr May Jun
Cracke
r Machi
n
e
input 1800 1680 1800 1800 1800 1800 output 1785 1660 1775 1765 1768 1780 Waste
(ton) 15 20 25 35 32 20
Month Jul Aug Sep Oct Nov Dec input 1800 1850 1850 1850 1850 1850 output 1780 1835 1835 1835 1820 1820 Waste
(ton) 20 15 15 15 30 30
Month Jan Feb Mar Apr May Jun
Cracke
r Machi
n
e
input 1800 1680 1800 1800 1800 1800 output 1785 1660 1775 1765 1768 1780 Waste
(ton) 15 20 25 35 32 20
Month Jul Aug Sep Oct Nov Dec input 1800 1850 1850 1850 1850 1850 output 1780 1835 1835 1835 1820 1820 Waste
(ton) 20 15 15 15 30 30
Month Jan Feb Mar Apr May Jun
Ch
o
co
Ball
M
ill
input 1800 1680 1800 1800 1800 1800 output 1785 1660 1775 1765 1768 1780 Waste
(ton) 15 20 25 35 32 20
Month Jul Aug Sep Oct Nov Dec input 1800 1850 1850 1850 1850 1850 output 1780 1835 1835 1835 1820 1820 Waste
(ton) 20 15 15 15 30 30
Month Jan Feb Mar Apr May Jun
ch
o
co
b
all
mill
input 420 370 520 520 520 600 output 395 340 500 505 495 580 Waste
(ton) 25 30 20 15 25 20 Month Jul Aug Sep Oct Nov Dec input 525 635 670 640 520 362 output 500 620 660 630 500 345 Waste
(ton) 25 15 10 10 20 17
Month Jan. Feb. Mar. Apr. May Jun
Ch
o
C
o
b
alll
mill
input 420 370 520 520 520 600
output 395 340 510 500 490 578 Waste
(ton) 25 30 10 20 30 22
Month Jul Aug Sep Oct Nov Dec
input 525 635 670 640 520 362 output 498 628 655 625 505 340 Waste
(ton) 27 7 15 15 15 22
Month Jan Feb Mar Apr May Jun
Ch
o
co
Ball
M
ill
input 420 370 520 520 520 600 output 393 343 500 500 495 579 Waste
(ton) 27 27 20 20 25 21 Month Jul Aug Sep Oct Nov Dec input 525 635 670 640 520 362 output
498 625.
5 650 622.
5 505 342
Waste
Table 10: Industry B Material input and output data at year 2009 on choco mill ( with adoption of dynamic maintenance strategies)
Table 11: Efficiency of the machines over the years
V. ANALYSIS ON THE MACHINES
Based on the data shown on tables(1-10), we have
a. Machine A (Cracker)
Total output from 2005 to 2008 = 82,462 tons Total input from 2005 to 2008 = 83,809 tons
Total loss of material wastage from 2005 to 2008 = 1347 tons
b. MachineB (Choco ball mill)
Total output from 2005 to 2008 = 24,224 tons Total input from 2005 to 2008 = 25,127 tons
Total loss of material wastage from 2005 to 2008 = 903 tons
2005 2006 2007 2008 2009
0 50 100 150 200 250 300 350
400 Graph of Efficiency and Material wastage against
Year for Cracking Machine
E
ff
ici
en
cy
(
%
),
M
a
te
ri
al
W
a
s
tag
e(
to
n
s
)
Year Efficiency Material wastage
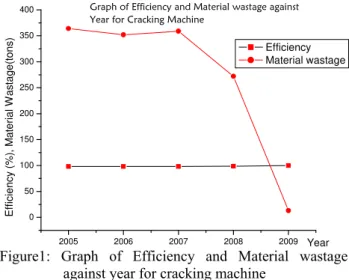
Figure1: Graph of Efficiency and Material wastage against year for cracking machine
2005 2006 2007 2008 2009
0 50 100 150 200 250
Graph of Efficiency and Material Wastage against Year for Choco Ball mill
E
ff
ici
e
n
cy
(%
),
Mate
ri
al
W
a
st
age
(
ton
s)
Year efficiency Material wastage
Figure2: Graph of Efficiency and Material wastage against year for choco ball mill
2005 2006 2007 2008 2009 0
50 100 150 200 250 300 350
Barchart showing Material Wastage against number of years for both Cracking Machine and Choco ball mill
M
a
te
ri
al
W
a
s
ta
ge(tons
)
Year Cracking machine Choco ball mill
Figure 3:Chart showing Material wastage against number of years for cracking and choco mill
Month Jan Feb Mar Apr May Jun
Choco Ball Mill
Input 420 370 520 520 520 600 Output 420 370 520 518 520 595 Waste
(ton) 0 0 0 2 0 5 Month Jul Aug Sep Oct Nov Dec Input 525 635 670 640 520 362 Output 525 635 668 640 515 362 Waste
(ton) 0 0 2 0 5 0
Year Cracker’s efficiency (%)
Choco mill efficiency (%)
2005 98.2 97.0
2006 98.3 96.3
2007 98.3 96.2
2008 98.7 96.8
VI. RESULTS AND DISCUSSION
The results obtained from the analysis of the data collected from the industries investigated as shown in table (1-10) revealed the enormous monthly material wastage from 2005 to 2008 when the industries maintenance approach was purely breakdown maintenance. When the formulated maintenance strategies were introduced, the material wastage from the machinery was reduced to bear minimum if not eliminated as shown in figure 3 above.
In figure 1and figure 2 it is evident that the efficiency of the machine is moderately okay but material wastage could not be married with this. The drop in the two figures still pointed to the drastic reduction in the wastage in year 2009 as the formulated strategies were adopted by the industries.
VII. CONCLUSION
The result of the material analysis of the selected machinery from the two industries showed that the material wastage is of the increase when a rigid approach was used in maintaining the machinery. With the formulated dynamic strategies, it is evident that machinery performance keeps improving, thereby reducing raw materials wastage, increasing product quality and enhancing product demand.
It is recommended that industries should adopt dynamic maintenance strategy culture, which are suitable and as well increase production efficiency and products.
ACKNOWLEDGEMENT
The authors wish to acknowledge the effort of the production managers of these two industries, JOF Vegetable Oil and Coop Cocoa Products Ltd. for the assistance they rendered in the course of this research.
REFERENCES
[1] H.T Panagiotis, H.V. Theodoros and S.A Ioannis, “Reliability and Maintainability Analysis of Strudel Production Line with Experimental Data – A case study,” Journal of Food Engineering vol. 91, pp. 250–259, (2009) www.elsevier.com/locate/jfoodeng
[2] L. Meshkat, J.B Dugan and J. Andrews, “Maintenance Modelling for Computer-based Systems” Proceedings of Institution of Mechanical Engineers Vol 215 , pp 221-231Part E (2001) [3] L. Swanson, . “Linking maintenance strategies to performance”,
International Journal of Production Economics, vol. 70 pp. 237-44 pp. 237-237-44, 2001
[4] H.C.A Tsang,: “Strategic dimensions of maintenance management,” Journal of Quality in Maintenance Engineering,
Vol. 8 No. 1, pp. 7-39, 2002.
[5] P. Liliane, K.P Srinivas and V. Ann, “Evaluating the effectiveness of maintenance strategies,” Journal of Quality in Maintenance Engineering Vol. 12 No. 1, pp. 7-20, Emerald Group Publishing Limited, (2006)
[6] L. Susan, T. Yu-Chen and L. Huitian , “Predictive Condition-based Maintenance for Continuously Deteriorating Systems”, Quality and Reliability Engineering International ; 23:71–81 (www.interscience.wiley.com), 2007.
[7] K. M. Dusmanta, K. S. Pradip and C. Rupendranath : “Optimisation of Safety and Reliability of Captive Power Plant Maintenance Scheduling Using Genetic Algorithm and Simulated Annealing”, International Journal of Emerging Electric Power Systems, Volume 3, Issue 1 Article 1037 , http://www.bepress.com/ijeeps, 2005
[8] N. M. Christian: “Competing through Maintenance Strategies,