Genomic Targets and Features of BarA-UvrY
(-SirA) Signal Transduction Systems
Tesfalem R. Zere1¤a, Christopher A. Vakulskas1¤b, Yuanyuan Leng1, Archana Pannuri1,
Anastasia H. Potts1, Raquel Dias1, Dongjie Tang1¤c, Bryan Kolaczkowski1,
Dimitris Georgellis2, Brian M. M. Ahmer3, Tony Romeo1*
1Department of Microbiology and Cell Science, Institute of Food and Agricultural Sciences, University of Florida, Gainesville, United States of America,2Departamento de Genética Molecular, Instituto de Fisiología Celular, Universidad Nacional Autónoma de México, México D.F., México,3Department of Microbial Infection and Immunity, The Ohio State University, Columbus, OH, United States of America
¤a Current address: Department of Oral Biology, University of Florida, College of Dentistry, Gainesville, FL, 32610–0424
¤b Current address: Integrated DNA Technologies, Molecular Genetics Department, 1710 Commercial Park, Coralville, IA, 52241
¤c Current address: State Key Laboratory for Conservation and Utilization of Subtropical Agro-bioresources, and College of Life Science and Technology, Guangxi University, Nanning, Guangxi, PR China
Abstract
The two-component signal transduction system BarA-UvrY ofEscherichia coliand its ortho-logs globally regulate metabolism, motility, biofilm formation, stress resistance, virulence of pathogens and quorum sensing by activating the transcription of genes for regulatory sRNAs, e.g. CsrB and CsrC inE.coli. These sRNAs act by sequestering the RNA binding protein CsrA (RsmA) away from lower affinity mRNA targets. In this study, we used ChIP-exo to identify, at single nucleotide resolution, genomic sites for UvrY (SirA) binding inE.
coliandSalmonella enterica. ThecsrBandcsrCgenes were the strongest targets of cross-linking, which required UvrY phosphorylation by the BarA sensor kinase. Crosslinking occurred at two sites, an inverted repeat sequence far upstream of the promoter and a site near the -35 sequence. DNAse I footprinting revealed specific binding of UvrYin vitroonly to the upstream site, indicative of additional binding requirements and/or indirect binding to the downstream site. Additional genes, includingcspA, encoding the cold-shock RNA-bind-ing protein CspA, showed weaker crosslinkRNA-bind-ing and modest or negligible regulation by UvrY. We conclude that the global effects of UvrY/SirA on gene expression are primarily mediated by activatingcsrBandcsrCtranscription. We also usedin vivocrosslinking and other exper-imental approaches to reveal new features ofcsrB/csrCregulation by the DeaD and SrmB RNA helicases, IHF, ppGpp and DksA. Finally, the phylogenetic distribution of BarA-UvrY was analyzed and found to be uniquely characteristic ofγ-Proteobacteria and strongly anti-correlated withfliW, which encodes a protein that binds to CsrA and antagonizes its activity inBacillus subtilis. We propose that BarA-UvrY and orthologous TCS transcribe sRNA antagonists of CsrA throughout theγ-Proteobacteria, but rarely or never perform this func-tion in other species.
OPEN ACCESS
Citation:Zere TR, Vakulskas CA, Leng Y, Pannuri A, Potts AH, Dias R, et al. (2015) Genomic Targets and Features of BarA-UvrY (-SirA) Signal Transduction Systems. PLoS ONE 10(12): e0145035. doi:10.1371/ journal.pone.0145035
Editor:Indranil Biswas, University of Kansas Medical Center, UNITED STATES
Received:October 14, 2015
Accepted:November 30, 2015
Published:December 16, 2015
Copyright:© 2015 Zere et al. This is an open access article distributed under the terms of the
Creative Commons Attribution License, which permits unrestricted use, distribution, and reproduction in any medium, provided the original author and source are credited.
Data Availability Statement:The ChIP-exo analyses were submitted to the NCBI GEO repository under the accession number GSE74810. (Provided in the manuscript p.11 under ChIP-exo data analysis).
Introduction
The ability of bacteria to flourish under diverse environmental conditions requires their physi-ology and metabolism to be regulated by complex transcriptional and posttranscriptional cir-cuitries. The Csr (carbon storage regulator) or Rsm (repressor of stationary phase metabolites) system is a post-transcriptional regulatory system ofE.coliand otherγ-proteobacteria that is extensively interconnected with transcriptional regulatory circuits [1–8]. Its centerpiece, CsrA, is a small dimeric RNA binding protein that regulates mRNA translation, turnover and tran-scription termination [3,9–11]. CsrA activity inE.coliandSalmonella entericaserovar Typhi-murium (hereafter referred to asSalmonella) is regulated by CsrB and CsrC sRNAs, which utilize multiple CsrA binding sites to sequester CsrA away from its lower affinity mRNA tar-gets [3,12–14]. CsrB/C levels are regulated by factors affecting both their synthesis and turn-over [15].
CsrB and CsrC transcription is directly regulated by the BarA-UvrY or BarA-SirA two-com-ponent signal transduction system (TCS) inE.coli[13,16,17] andSalmonella[14,18,19], respectively. The BarA protein belongs to a family of membrane-associated tripartite sensor-kinases and UvrY belongs to the FixJ family of response regulators [14,19–21]. BarA is required for sensing the presence of acetate, formate and other carboxylate compounds by an undetermined mechanism [22–24]. This leads to autophosphorylation at a conserved histidine residue (His302), and transphosphorylation of UvrY/SirA through a His302!Asp718! His861!Asp54phosphorelay [20,22]. Phosphorylated UvrY-P/SirA-P, in turn, binds to its DNA targets and regulates their transcription. For instance,in vitrobinding studies suggest that the SirA protein (SirA-P) binds to DNA sequences located upstream of target genes for Csr sRNAs and activates their transcription inSalmonella[18,19,25].
BarA-UvrY and its orthologs in otherγ-proteobacteria, including GacS/GacA ( Pseudomo-nas), VarS/VarA (Vibrio), ExpS/ExpA (Pectobacterium)and LetS/LetA (Legionella pneumo-phila) have been reported to regulate virulence, metabolism, biofilm formation, stress resistance, quorum sensing and secretion systems [4,20,26–30]. Transcriptomics studies of UvrY and its orthologs have shown effects on the expression of numerous genes [30–32]. An understanding of which of these effects represents direct regulation vs. indirect regulation via effects on the Csr sRNAs is necessary for modeling of the complex genetic circuitry that under-pins the systems biology of these species. This question has been examined in only one case, which used ChIP-on-chip analysis to conclude that only the genes for Csr sRNAs (RsmY, RsmZ) inPseudomonas aeruginosaare direct targets for GacA binding [33].
Here, we used ChIP-exo, an advanced procedure for determining genome-wide DNA-pro-tein interactions with single nucleotide resolution [34] to map the UvrY and SirA DNA binding sites across theE.coliandSalmonellagenomes. ThecsrBandcsrCgenes were by far the stron-gest direct targets of binding in both species. These genes exhibited crosslinking at two distinct locations. By comparing the results ofin vivocrosslinking within vitroDNA binding assays, an 18 NT palindrome or inverted repeat sequence (IR) located far upstream of the promoter was found to serve as a specific binding site for UvrY atcsrBandcsrC. Disruption ofbarA elim-inated UvrY bindingin vivo. IHF (integration host factor) was required for optimal UvrY bind-ing to and transcriptional activation ofcsrBbut notcsrC. In addition to thecsrB/Cgenes, weaker genomic binding sites of UvrY were identified by ChIP-exo. Several genes associated with the weaker binding sites were tested and found to exhibit negligible or only modest regula-tion by UvrY, suggesting that diverse effects of this TCS are mediated through Csr circuitry.
In addition to BarA-UvrY, other factors activatecsrB/Ctranscription inE.coli, such as CsrA [13,16,35], DksA and ppGpp of the stringent response [2], and the DEAD-box RNA helicases DeaD and SrmB [4]. The stringent response describes a regulatory network of eubacteria that
Asuntos del Personal Académico, Universidad Nacional Autónoma de México, Award Number: IN209215 to DG, the National Institute of Allergy and Infectious Diseases Award Number: F32AI100322 to CAV, and the National Institute of Allergy and Infectious Diseases Award Number: R01AI097116 to BMMA and TR. The funders had no role in study design, data collection and analysis, decision to publish, or preparation of the manuscript.
responds to amino acid starvation and other stresses [2]. Activation of this system is character-ized by a rapid downshift in synthesis of stable RNAs, such as rRNA and tRNA and stimulation of the expression of genes involved in amino acid biosynthesis and transport, although these processes represent a fraction of its global regulatory role [36]. The effector of this response is the nucleotide secondary messenger guanosine tetraphosphate, ppGpp, also known as“magic spot”[37]. Complexed with RNA polymerase, ppGpp positively or negatively affects transcrip-tion [38]. In most cases, regulation by ppGpp requires the RNA-polymerase associated tran-scription factor DksA [39,40], which acts together with ppGpp to synergistically regulate expression of a number of global regulators and other genes. The DEAD-box RNA helicases are enzymes that utilize ATP energy to alter RNA structure or RNA-protein interactions [4]. Their roles in the posttranscriptional regulation of bacterial gene expression are presently underappreciated. DeaD regulatesuvrYtranslation by altering mRNA structure, while SrmB uses a distinct, but incompletely understood mechanism. We used a combination ofin vivo
andin vitroapproaches to refine our understanding of how these regulatory factors affectcsrB/ Ctranscription.
Bioinformatics analyses revealed that BarA-UvrY orthologs are strongly anti-correlated with thefliWgene, which encodes a protein that binds to and antagonizes CsrA ofB.subtilis
[41], indicating that few if any species use both FliW and BarA-UvrY transcribed sRNAs as CsrA antagonists. These studies advance our understanding of this global regulatory circuitry and highlight the importance of including post-transcriptional regulation along with transcrip-tional control when modeling bacterial regulatory networks.
Experimental Procedures
Bacterial strains, plasmids and primers used in this project are listed inS1 Table.
Bacterial strains and culture conditions
LB medium (1% [w/v] Tryptone; 1% [w/v] NaCl and 0.5% [w/v] yeast extract) was used for cul-ture of bacteria unless stated otherwise. The antibiotics ampicillin (100μg mL−1), tetracycline
(15μg mL−1), kanamycin (50μg mL−1), and chloramphenicol (25μg mL−1) were included in
growth media as needed. Bacterial cultures were stored at -80°C in medium containing ~15% glycerol. To revive cultures, LB medium (2 mL) was inoculated from the frozen stock cultures and incubated with shaking (250 rpm) at 37°C overnight. The overnight cultures served as inoculum (1:1000) for LB medium or Kornberg medium (1.1% [wt/vol] K2HPO4, 0.85% [wt/
vol] KH2PO4, 0.6% [wt/vol] yeast extract containing 0.5% [wt/vol] glucose). Growth was
deter-mined by monitoring OD600and/or by assaying total cellular protein.
Construction of chromosomal deletions and FLAG
1fusion proteins
Gene deletions (ofE.coli) and carboxy-terminally 3XFLAG1-tagged constructs (ofE.coliand
100μg/mL ampicillin and 10 mM arabinose to mid-log (OD600of 0.5), collected by
centrifuga-tion, washed three times with ice-cold 10% glycerol and resuspended with ice-cold 10% glyc-erol. The transformation was then performed by electroporation. After 1h recovery at 37°C in SOB medium, bacteria were spread onto LB agar plates supplemented with antibiotics for the selection of CmRor KnRrecombinants. Correct insertion of the marker and 3XFLAG sequence in the genome was confirmed by PCR amplification and by sequencing of the insertion site using primers listed in (S1 Table). When necessary, the FRT-flanked antibiotic resistance cas-sette was removed using pCP20 [43].
Construction and purification of carboxy-terminally His-tagged UvrY
protein
His-tagged UvrY (UvrY-His6) protein was constructed by PCR amplification of the coding
sequence ofuvrYgene using genomic DNA ofE.coliMG1655 as template DNA and oligonu-cleotides UvrY-6xhis-F and UvrY-6xhis-R as primers (S1 Table). The amplicon was gel-puri-fied, digested usingNdeI andXhoI restriction enzymes (NEB), and cloned into a similarly digested and dephosphorylated pET24-a (+) vector DNA (NEB) using electrocompetent DH5αfor the transformation. The pET-UvrY plasmid was confirmed by gel electrophoresis and sequencing of the inserted DNA using T7-promoter and T7 terminator primers. The pET-UvrY plasmid was moved into BL21 (DE3)E.colistrain for expression. TheE.coli
BL21_DE3/pET-UvrY cells carrying UvrY-His6were grown in 500 mL of LB containing 50μg/
mL kanamycin at 37°C. At OD600of 0.6, expression of the UvrY-His6was induced by the
addi-tion of isopropylβ-D-1-thiogalactopyranoside (IPTG) to 1 mM, followed by 2h of shaking incubation at 37°C, 250 rpm.
The purification procedure for UvrY-His6was similar to the method previously described
for isolation of DeaD-His6with some modification [4]. Cells were collected by centrifugation
(600 x G, 4°C, 5min), suspended in buffer (20 mM Tris-HCl [pH 7.9], 500 mM NaCl, 20 mM imidazole) containing a protease inhibitor cocktail (cOmplete Mini, EDTA-free protease inhib-itor cocktail, Roche Diagnostics), and lysed using a French Press. The lysates were centrifuged (20,000 x G, 15 min, 4°C) to remove unbroken cells and cell debris and the supernatant solu-tions were purified by affinity chromatography on a HisTrap HP column as instructed by the manufacturer (GE Healthcare Life Sciences). Fractions containing UvrY were pooled and dia-lyzed against UvrY storage buffer (20 mM Tris-HCl (pH 7.9), 150 mM NaCl, 1 mM dithio-threitol and 10% glycerol). UvrY was then aliquoted, frozen using liquid nitrogen, and stored at−80°C. The bicinchoninic acid method was used for assaying protein concentration, as
rec-ommended (Pierce Biotechnology).
UvrY phosphorylation
in vitro
Forin vitrophosphorylation, the purified UvrY-His6protein was incubated with 100 mM
ace-tyl-phosphate (Sigma) in a phosphorylation buffer containing 50 mM HEPES pH7.5, 100 mM NaCl and 10mM MgCl2. The reaction mixtures were incubated for 60 min at room
tempera-ture. To determine relative amount of UvrY-P formed, the reactions were fractionated on Phos-tagTMSDS-PAGE gels [1.0mm Protean 3 (Bio-Rad) minigels] of the following composi-tion: 7.5% separating gel [7.5% (29:1) acrylamide: bis-acrylamide, 357mM Bis-Tris, pH 6.8, 100μM Zn (NO3)2, and 50μM Phos-tag reagent (Waco Pure Chemical Industries)] with a 4%
stained with Coomassie blue and the signals were imaged using a ChemiDoc XRS+ system (Bio-Rad) and quantified using Quantity One image analysis software (Bio-Rad).
ChIP-exo and deep sequencing
E.coliandSalmonellastrains carrying biologically functional UvrY-FLAG [4] or SirA-FLAG proteins (S1 Fig) were grown in Kornberg medium and LB (supplemented with 10 mM glu-cose), respectively at 37°C, 250 rpm. At mid-exponential phase of growth (OD600of 0.6),
form-aldehyde (1% final concentration) was added and the cultures were incubated for 20 min at 30°C, 150 rpm. The crosslinking reaction was then quenched by the addition of 5 mL of 1.0 M glycine, pH 8.0 to 10 mL of culture. The samples were kept at room temperature for 5 min with gentle swirling. The cells were harvested by centrifugation (6000 x G, 5 min, 4°C), washed twice with ice-cold 1x PBS, suspended in 500μL lysis buffer (10 mM Tris-HCl pH 8.8, 50 mM NaCl, 20% [w/v] sucrose, 10 mM EDTA) containing protease inhibitor cocktail (cOmplete Mini, EDTA-free protease inhibitor cocktail, Roche Diagnostics) and 2 mg/mL lysozyme. After 30 min on ice, 500μl of 2x IP buffer (100 mM Tris-HCl, pH 7.0, 300 mM NaCl, 2% Triton X-100, 2 mM EDTA) was added and the samples were incubated at 37°C for 10 min, followed by 2 min on ice. The samples were then sonicated on ice, (60 pulses total, 5 sec on 5 sec off per pulse, in a total of 6 sets, separated by 2 min on ice, using a sonicator (Fisher Scientific, Sonic Dismembrator Model 500, set at 20% amplitude). Unbroken cells and debris were removed by centrifugation. Sonicated samples (1 mL) were treated with 20μL ANTI-FLAG1M2 beads (Sigma) by spinning on a tube rotating mixer (Thermo Scientific) at 4°C for 4 hr to immu-noprecipitate UvrY-FLAG. The beads were washed three times with 1mL 1X IP buffer and two times with 1mL 1X TE buffer (10 mM Tris-HCl pH 8.0, 1 mM EDTA). The beads were resus-pended in 100μL TE buffer and the formaldehyde crosslinking was reversed by heating at 95°C for 20 min. Afterward, the samples were incubated with 8μL of 10 mg/mL RNase A for 2 h at 37°C and with 4μL of 20 mg/mL proteinase K at 55°C for 2h. The resulting DNA was purified using a Qiagen MinElute PCR Purification Kit according to manufacturer’s instructions. As a control, wild type strains expressing no FLAG epitope tagged protein were treated using the same procedures. The specificity of the ChIP assay was confirmed by amplifying promoter DNA of thecsrB,lacYand 16s rRNA (rrsH) genes with primers (S1 Table) using the DNA recovered from the ChIP reactions as a template (S2 Fig).csrBwas used as a positive control for UvrY/SirA binding whilelacY(E.coli) and 16S rDNA (Salmonella) were used as negative controls. After confirming the specificity of the ChIP reactions, the DNA samples were frozen and shipped to Peconic LLC for the remainder of the ChIP-exo procedure and deep sequencing with Illumina Hi-seq 2000 as described previously [34].
ChIP-exo data analysis
sequences from the peak-pair midpoint of each of the enriched genomic loci, with +/- 40nt upstream and downstream extension distance were extracted. Centered in the 81nt-long extracted DNA sequence is the UvrY/SirA crosslinking site. The extracted DNA sequences were uploaded into MEME Suite [47] for motif discovery analysis. The datasets from ChIP-exo analyses were submitted to the NCBI GEO repository under the accession number GSE74810.
RNA extraction and Northern blotting
Procedures for RNA extraction and Northern blotting were conducted as described previously, with minor modification [4]. Briefly, bacteria were harvested at mid-exponential phase (OD600
of 0.6) or as otherwise stated and total cellular RNA was prepared (RNeasy mini kit, Qiagen). RNA was separated by electrophoresis on 5% polyacrylamide gels containing 7 M urea, trans-ferred to a positively charged nylon membrane (Roche Diagnostics) by electro-blotting, and crosslinked to the membrane with UV light. Crosslinked RNA was hybridized to DIG-labeled antisense probe (68°C, overnight) and signal was developed using the DIG Northern Starter kit (Roche Diagnostics). Antisense RNAs were prepared from PCR products using the DIG North-ern Starter kit (Roche Diagnostics). Blots were imaged using a ChemiDoc XRS+ system (Bio-Rad) and RNA signals quantified using Quantity One image analysis software (Bio-(Bio-Rad). The 5S or 16S and 23S rRNAs served as loading controls, and were detected by hybridization or methylene blue staining, respectively.
Western blotting
Western blotting was conducted as previously described [4]. Briefly, proteins (10μg) were sep-arated using SDS-PAGE and electroblotted onto 0.2 mm polyvinylidene difluoride mem-branes.Anti-FLAG1M2 monoclonal antibody (Sigma) and anti-RpoB monoclonal antibody (Neoclone) were used for detection of the FLAG epitope and RpoB. Signal detection used treat-ment with horseradish peroxidase-linked secondary antibodies followed by SuperSignal1
West Femto Chemiluminescent Substrate (Thermo Scientific). Blots were imaged using the ChemiDoc XRS+ system (Bio-Rad) and the signals were quantified using Quantity One image analysis software (Bio-Rad).
Analysis of UvrY-FLAG protein stability
Bacterial cells were grown to mid-exponential phase of growth, at which point protein synthe-sis was stopped by the addition of tetracycline (200μg/mL) and chloramphenicol (100μg/mL). Cells were collected at several times following the addition of the antibiotics, harvested by cen-trifugation and were immediately mixed with Laemmli sample buffer and lysed by sonication and boiling. Samples (10μg protein) were subjected to SDS- PAGE and were analyzed by Western blotting as described above.
β
-Galactosidase assays
The assays for specificβ-Galactosidase activity were conducted as described previously [2]. Val-ues represent the averages from two independent experiments. Error bars represent standard errors of the means.
Analysis of UvrY phosphorylation
in vivo
Phos-tagTMSDS-PAGE gels, which resolve UvrY from UvrY-P, and the FLAG epitope of the UvrY-FLAG protein was detected by Western blotting.
Quantitative RT-PCR
Quantitative Real Time-PCR (q-RT-PCR) was conducted in an iCycler™thermocycler (Bio-Rad) using the iScript™One-Step RT-PCR Kit with SYBR1Green (Bio- Rad) as described pre-viously, with minor modifications [4]. Reactions (15μl) contained immunoprecipitated DNA (50 ng/μl), primers (0.5μM each;S1 Table) and SYBR1Green RT-PCR Reaction Mix. PCR cycle parameters were as follows: 40 cycles of PCR at 95°C denaturation for 10 s, 60°C of annealing, extension, and detection for 30 s. The specificity of the PCR product was determined by melting curve analysis with reference to the calculated Tm. For melting curve analysis, the temperature was increased from 60°C to 95°C at a rate of 0.5°C/10 s. PCR product concentra-tion was determined using a standard curve prepared with iCycler iQ optical system software version 3.1 (Bio-Rad), according to the manufacturer’s instructions.
Analysis of UvrY binding to
csrB
DNA
in vivo
by ChIP-PCR
UvrY binding tocsrBgenomic DNAin vivowas analyzed by ChIP-quantitative PCR
(PCR). The first steps of the PCR assay were conducted as described for the ChIP-exo assay. After releasing the formaldehyde crosslinks, the DNA was extracted and purified using Qiagen MinElute Purification Kit. The isolatedcsrBDNA was assayed using quantitative real time-PCR (q-RT-PCR) with primers listed in (S1 Table). ThelacYgene served as a nega-tive control for this reaction using primers also listed in (S1 Table).
Electrophoretic gel mobility shift assay (EMSA) for DNA binding
For DNA electrophoretic gel mobility shift assays, the regions from -246 to +49 and -247 to +56, with respect to the transcriptional start sites ofcsrBandcsrC, respectively, were amplified by PCR and end-labeled with [γ-32P] ATP using T4 polynucleotide kinase. Binding reactions (10μl) contained 0.5 nM of end labeled DNA, 20 mM Tris HCl (pH 7.5), 10% (v/v) Glycerol, 50 mM KCl, 3 mM MgCl2, 1 mM dithiothreitol, 100μg/mL BSA and phosphorylated or
non-phosphorylated UvrY-His6protein. Reactions were incubated for 30 min at 37°C, then 1μl
xylene cyanol was added and samples were separated by electrophoresis on 7% non-denaturing polyacrylamide gels with 0.5X TBE as the running buffer. After electrophoresis, the gels were vacuum dried, the radioactive signals captured by phosphorimage analysis (PMITM, Bio-Rad) and analyzed using Quantity One software.
DNase I footprinting
Double stranded DNA for footprinting ofcsrB(466 bp long, extending from 420 bp upstream to 46 bp downstream of the TSS) orcsrC(419 bp long, extending from 319 bp upstream to 100 bp downstream of the TSS) was prepared by PCR using strand-specific [32P] 5’-end-primers (S1 Table). The 5’-end-labeled PCR products were gel-purified and the DNA (0.5 nM) was used for binding reactions (10μL) containing 20 mM Tris HCl (pH 7.5), 10% (v/v) glycerol, 50 mM KCl, 3 mM MgCl2, 1mM dithiothreitol and 100μg/mL bovine serum albumen along with
phosphorylated or non-phosphorylated UvrY-His6protein. The binding reactions were
electrophoresis on a 6% denaturing polyacrylamide gel. The gel was vacuum dried, radioactive signals captured by phosphor imaging (PMITM, Bio-Rad) and analyzed with Quantity One software.
Construction of plasmid-borne
csrB-lacZ
and
csrC-lacZ
fusions for S-30
transcription-translation
ThecsrB-lacZandcsrC-lacZcarrying plasmids, pLFXcsrB-lacZ and pLFXcsrC-lacZ, were con-structed by first amplifying the 502 nt (-500 to +2 with respect tocsrBtranscriptional start site) and 304 nt (-301 to +3 with respect tocsrCtranscriptional start site) genomic regions using the primer pairs csrB lacZ Fwd / csrB lacZ Rev and csrC lacZ Fwd / csrC lacZ Rev (S1 Table). The PCR products were gel purified, digested withPstI andKpnI, ligated toPstI- andKpnI-digested and dephosphorylated plasmid pLFX, and electroporated into DH5αλpir cells. DNA sequenc-ing was used to confirm that the cloned regions did not contain any mutations.
In vitro
coupled transcription-translation
In vitrotranscription-translational assays used pLFXcsrB-lacZ and pLFXcsrC-lacZ supercoiled plasmids and were performed with S-30 extracts prepared from the UvrY deficient strain, CF7789uvrY::cam, as described previously [16], except that reactions (32μl) contained 0.5 U
E.coliRNA polymerase holoenzyme and 3μl of35S-methionine (1175 Ci/mmol). The UvrY-P (2.3μM), ppGpp (250μM) and DksA (2μM) were included, as indicated, in the reactions. IHF (1μM) was added to all of the reactions that contained pLFXcsrB-lacZ plasmid. DksA protein was a generous gift of Prof. Richard Gourse, University of Wisconsin, Madison. IHF protein was a generous gift from Prof. Anca Segall, San Diego State University. Incorporation of35 S-methionine into protein products was determined after SDS PAGE separation by using phos-phorimaging. Signal intensity was determined using Quantity One software.
Phylogenetic analysis of BarA, UvrY, CsrA, and FliW distribution
We identified CsrA, BarA, UvrY and FliW orthologs from all fully-sequenced bacterial genomes in the NCBI genomes database (http://www.ncbi.nlm.nih.gov/genome/), using the NCBI Prokaryotic Genome Annotation Pipeline v2.0 to assign orthology [48]. This pipeline combines a sequence similarity-based approach with the comparison of the predicted gene products to the nonredundant protein database, Entrez Protein Clusters, the Conserved Domain Database (CDD) [48].
In order to filter out false positives and false negatives from the NCBI orthologs data set, we aligned a set of representative sequences against the genomes with predicted orthologs using tblastn [49]. The alignment results were filtered by sequence similarity and alignment coverage: BarA was filtered by 50% similarity and 50% coverage, UvrY was filtered by 75% similarity and 80% coverage, CsrA was filtered by 60% similarity and 50% coverage, and FliW was filtered by 50% similarity and 50% coverage. All the similarity and coverage thresholds were established by the minimum similarity and coverage observed between annotated sequences from NCBI nucleotide database and the following set of representatives used as query sequences: BarA fromEscherichia coli(NCBI protein identification number PI: 190908466), UvrY fromE.coli
(PI: 190906390), CsrA fromE.coliandBacillus subtilis(PI: 257755450 and 459391362), and FliW fromBacillus amyloliquefaciens(PI: 307608134). After filtering the results by alignment similarity and coverage, we performed a manual refinement of the results by verifying the pair-wise alignments, sequence annotations, and bibliographic information.
[51] and PhyloT v2015.1 (http://phylot.biobyte.de), and gene presence/absence data were visu-alized using iTOL v3.0 [52]. Correlations among presence/absence of CsrA, BarA, UvrY and FliW were calculated using Pearson’s product moment correlation, and significance was assessed using Fisher’s Z transform (implemented in the R stats package, v3.2.0). For calculat-ing the correlations, we clustered the results at species and genus level in order to minimize the number of false negatives and false positives. For clustering the results at species level, we estab-lished the presence/absence as the value that appears most often at strain level (statistical mode). For clustering the results at genus level, we established the presence/absence as the mean calculated at species level.
In order to determine if any strong biases in the methodology used to identify orthologous genes could affect our results we used two additional and widely-employed methods to identify alternative ortholog sets: KEGG orthology database (KO) [53], and UniProt reference clusters of orthologs (UniRef) [54]. KEGG database defines the orthologs by comparing experimental data with KEGG pathway maps, BRITE functional hierarchies and KEGG modules. UniProt defines the orthologs by clustering protein sequences by 50% identity. We compared the corre-lations calculated for these alternative approaches to the results obtained from the NCBI Pro-karyotic Genome Annotation Pipeline, at genus and species level.
Results and Discussion
Determination of genome-wide UvrY/SirA-binding loci using ChIP-exo
To probe for UvrY/SirA DNA binding sites inE.coliandSalmonella, we used ChIP-exo, a comprehensive genomic DNA-protein interaction assay with single nucleotide resolution and high specificity [34]. This assay uses nuclease trimming reactions to remove nonspecific DNA from the immunoprecipitated complexes and to identify the crosslinking sites much more pre-cisely than ChIP-seq [34]. The experiments were performed with mid-exponential phase cul-tures (OD600of 0.6) of strains carrying FLAG-tagged UvrY or SirA proteins, respectively,
expressed from the native genomic loci. Altogether, 44 million sequencing reads for UvrY (E.
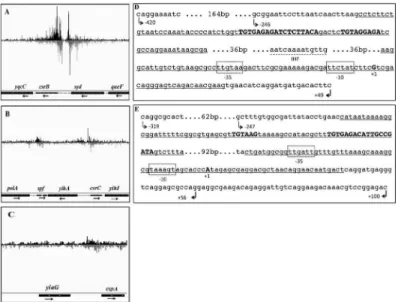
coli) and 31 million for SirA (Salmonella) were mapped to their respective genomes. From these analyses, two highly enriched genomic loci were identified at thecsrBandcsrCgenes of bothE.coli(Fig 1A and 1B)andSalmonella(Fig 2A and 2B). These results indicated that the
csrBandcsrCgenes represent the strongest targets of UvrY/SirA binding in these species. In addition to thecsrBandcsrCgenes, weakly enriched genomic loci were identified proxi-mal to the promoter regions of 286 genes inE.coliand 301 genes inSalmonella(S2 Table). These enriched genomic loci were arbitrarily classified into three groups based on enrichment of their occupancy peaks over background (S2 Table). Accordingly, genomic loci enriched 5-fold or greater than thelacYand/or 16s rRNA (rrsH) genes were included in group one. BesidescsrBandcsrC, the promoter regions offhuFandspffromE.coliandspffrom Salmo-nellafell into group one. Genomic loci that were enriched 2- to 5-fold comprised group two, which included the promoter regions of 9 genes inE.coliand 8 genes inSalmonella. The rest of the genomic loci, which include regions proximal to the promoter regions of 275 genes inE.
coliand 292 genes inSalmonella, have only1.5- to 2.0 occupancy read fold over that oflacYor 16s rDNA (rrsH) and were grouped into group three.
UvrY/SirA consensus DNA binding motif
were also observed at downstream sequences that extended from -56 to +25 (csrB) and from -49 to +32 (csrC) inE.coli(Fig 1D and 1E) and from -41 to +40 (csrB) and from -81 to -1 (csrC) inSalmonella(Fig 2C and 2D). In the center of each of the upstream putative binding
Fig 1. Genomic binding sites for UvrY identified by ChIP-exo.Bedgraphs depict genomic loci enriched by co-immunoprecipitation with cross-linked UvrY-FLAG, proximal to thecsrB(A),csrC(B),spf(B) andcspA(C) genes. Two UvrY crosslinking sites were discovered in the promoter regions ofcsrB(panel A, underlined in panel D) andcsrC(panel B, underlined in panel E). One site is within the region extending from -222 to -142 incsrBor from -223 to -143 incsrC. The other crosslinking site lies close to the promoter, extending from -56 to +25 incsrBand from -49 to +32 incsrCpromoter regions. A 9 bp inverted repeat DNA sequence within the upstream crosslinking regions is bolded and capitalized. A putative IHF binding site (broken underline) is located between the two UvrY crosslinking sites in the promoter region ofcsrB(D), but was not apparent in csrC. The DNA used for DNase I footprinting included 466 bp (-420 to +46) forcsrBand 419 bp (-319 to +100) forcsrC. DNA fragments used for electrophoretic mobility shift assay included (-246 to +49) forcsrBand (-247 to +56) forcsrC. The images were constructed using the Integrated Genome Viewer (IGV, Broad Institute) (44, 45).
doi:10.1371/journal.pone.0145035.g001
Fig 2. Genomic binding sites for SirA discovered by ChIP-exo.Bedgraphs show enriched genomic loci, proximal to the regulatory regions ofcsrB(A),csrC(B) andspf(B). Two putative SirA binding sites are shown for the promoter regions ofcsrB(rna62) (panel A, underlined in panel C) andcsrC(panel B, underlined in panel D). One site is located in the region from -215 to -135 incsrBand from -181 to -101csrCpromoter regions, respectively. The other putative binding site is close to the promoter, within the -41 to +40 (csrB) and -81 to -1 incsrCpromoter regions, respectively. A 9 bp-long inverted repeat DNA sequence in the upstream sites is shown in bold and capitalized. A putative IHF binding site is marked between the two putative UvrY binding sites in the promoter region ofcsrB(C, broken underline), but was not apparent incsrC. The images were constructed using the Integrated Genome Viewer (IGV, Broad Institute) (44, 45).
sites is an 18 nt nearly perfect palindrome or inverted repeat sequence (IR). IncsrB, the sequence, TGTGAGAGATCTCTTACA, is centered at -183/-182 inE.coli(Fig 1D) and -182/-181 inSalmonella(Fig 2C). Moreover, a partially conserved additional sequence (TGTAG-GAGA) located 5 bp downstream of the IR, is seen in thecsrBpromoter ofE.coli(Fig 1D)and
Salmonella(Fig 2C). The IR ofcsrCshows weaker symmetry in bothE.coli (TGTGAGA-CATTGCCGATA) (Fig 1E) andSalmonella(TGTGAGACATTGACCATT) (Fig 2D). More-over, a partially conserved sequence (TGTAAG) representing half of the IR, located 16 bp upstream of the IR, is also seen in thecsrCpromoter ofE.coli(Fig 1E) andSalmonella(Fig 2D). In contrast, the IR is not preserved in the downstream crosslinking sites of thecsrBor
csrCgenes.
To search for the conserved IR at the weaker targets of UvrY/SirA (S2 Table), DNA sequences from these enriched promoter regions were analyzed using MEME Suite software [47]. These analyses showed that the IR sequence is not conserved in any of the weaker putative binding sites.
UvrY requires phosphorylation for DNA binding
In the BarA-UvrY TCS, BarA is the histidine kinase, which upon signal detection, autopho-sphorylates and transfers the phosphoryl group to a conserved aspartate residue of UvrY [20]. The phosphorylated UvrY is then thought to bind specific DNA sequences in the promoters of its target genes and regulate their transcription [18,20,22]. MBP-SirA was previously found to bind similarly tocsrBDNAin vitroregardless of whether it had been phosphorylated or not, starting at a concentration of 1.5μM [25], suggesting that MBP-SirA phosphorylation might not be required for DNA bindingin vitro. This observation was consistent with another report, showing that phosphorylation only increased the DNA binding affinity of SirA-His6by
approximately two-foldin vitro[19].
In contrast to results fromin vitroDNA binding experiments, deletion of the gene for BarA sensor kinase caused more than a 10-fold decrease in the level of CsrB RNA [16,22,35]. Simi-larly, inSalmonella, substitution of alanine for the predicted phosphorylated histine residue of SirA, Asp54, caused the loss of CsrB expression [25]. Thus, it appears that phosphorylation is critical for UvrY activityin vivo. Whether UvrY requires phosphorylation for efficient DNA bindingin vivoor for later steps in transcription initiation was not clear.
To address this issue, we used bothin vitroandin vivoassays to investigate the role of UvrY phosphorylation in DNA binding. We performed electrophoretic mobility shift assay (EMSA) using phosphorylated (UvrY-P) and non-phosphorylated forms of the recombinant protein, UvrY-His6, which was determined to be functionalin vivo(S1 Fig). DNA fragments that
encompass the ChIP-exo-derived putative UvrY binding sites in the promoter regions ofcsrB
(Fig 1D) andcsrC(Fig 1E) were used as probes. UnlabeledcsrBandrrlEDNA fragments were used as competitive and non-competitive DNA probes, respectively. Similar to the previous observations [19,25], our results showed thatin vitrophosphorylation led to a modest
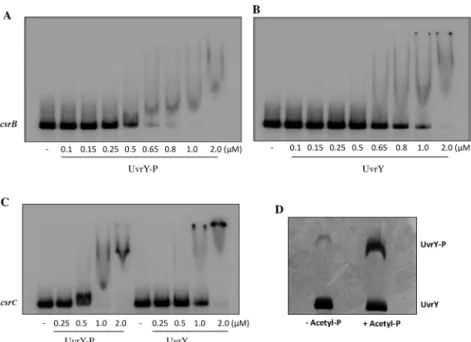
(~2-fold) increase in DNA binding affinity of UvrY tocsrB(Fig 3A and 3B) andcsrCDNA (Fig 3C), as compared to the non-phosphorylated UvrY. However, we also observed that the UvrY protein preparation contained around 7% of UvrY-P prior to thein vitrophosphorylation reac-tion (Fig 3D). It is possible that this contaminating UvrY-P was entirely responsible for binding tocsrBandcsrCDNAin vitro(Fig 3B).
To determine whether UvrY requires phosphorylation forin vivoDNA binding, we tested UvrY-FLAG binding tocsrB in vivoin a strain that lacked BarA (ΔbarA) and its isogenicbarA
of BarA, approximately 7% of the UvrY protein was phosphorylated (S3 Fig), similar to a previ-ous determination [4]. In the absence of BarA, no detectable phosphorylation of UvrY-FLAG protein was observed in LB medium at mid-exponential phase of growth (S3 Fig). We next used ChIP-PCR to test forin vivobinding of UvrY tocsrBDNA under this growth condition. In this experiment, an approximate 35-fold reduction in DNA binding was observed in the strain that lacked BarA (ΔbarA) relative to the isogenicbarAwild-type strain (Fig 4). These results show for the first time that UvrY requires phosphorylation for effective DNA bindingin vivo.
Fig 3. Electrophoretic gel mobility shift assay showing UvrY binding tocsrBandcsrCDNA.Binding of phosphorylated (UvrY-P) and non-phosphorylated (UvrY) UvrY-His6tocsrBDNA (A and B) andcsrCDNA (C) was tested as shown. ThecsrBandcsrCDNA probes (0.5 nM) used for this experiment (depicted inFig 1D and 1E, respectively) were incubated with increasing concentrations ofin vitrophosphorylated or non-phosphorylated UvrY-His6 protein for 30 min at room temperature. The DNA-protein complexes were resolved by electrophoresis on a non-denaturing 7% polyacrylamide gel. The phosphorylation state of the UvrY-His6protein used in these experiments was determined by Phos-tag SDS PAGE gel analysis (D).
doi:10.1371/journal.pone.0145035.g003
Fig 4. Effects of BarA and IHF onin vivobinding of UvrY tocsrB.The effects of BarA, IhfA and IhfB onin vivobinding of UvrY tocsrBpromoter were determined by ChIP-quantitative PCR (ChIP-PCR) in a WT strain (MG1655 expressing UvrY-FLAG) and isogenicΔbarA,ΔihfA,ΔihfBandΔihfAΔihfBstrains, as described in the Experimental Procedures. ThelacYgene served as a negative control for this reaction. Data depict the results of three independent experiments. Error bars represent the standard errors of the means.
UvrY specifically binds to an 18 nt-long IR DNA sequence
In order to more precisely define the UvrY DNA binding sites, we performedin vitroDNase I footprinting experiments oncsrBandcsrCDNA using phosphorylated and non-phosphory-lated UvrY-His6protein. The DNA probes for this experiment encompassed both the upstream
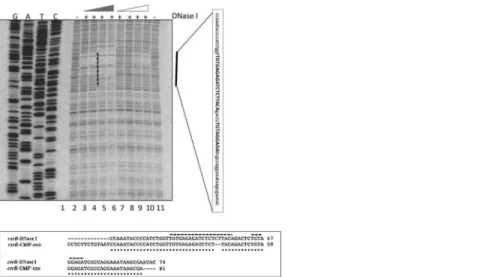
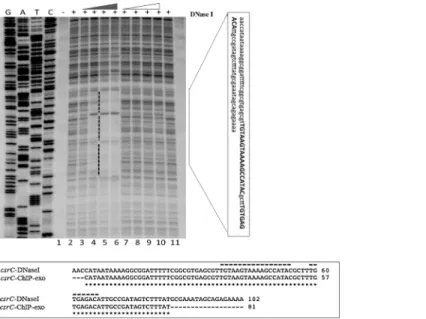
and downstream putative binding sites of these genes (Fig 1D and 1E). The results of these experiments showed protection of only the upstream binding sites containing the IR sequences of bothcsrB(Fig 5) andcsrC(Fig 6andS4 Fig). The putative downstream binding sites that were observedin vivo(Fig 1A and 1B & 1D and 1E) were not protectedin vitro. In addition, only the phosphorylated UvrY-His6 was observed to protect the IR, which further indicates that UvrY requires phosphorylation for tight, specific binding. Together, these results suggest that UvrY-P binds specifically and directly to the IR sequence of these genes. However,in vivo
binding of UvrY-P to the downstream sequences of these genes either requires conditions or factor(s) that were absent from the footprinting reactions or perhaps more likely, UvrY-P becomes cross-linked to DNA indirectly through interactions with DNA binding proteins such as RNA polymerase, which must bind to the downstream regions of these genes in order to ini-tiate transcription.
UvrY requires IHF for optimal binding to and expression of
csrB
but not
csrC
The nucleoid-associated protein Integration Host Factor (IHF) is a heterodimeric protein com-posed of two homologous subunits, IHFα(IhfA) and IHFβ(IhfB), which facilitates the tran-scription of many genes by bending the DNA [55–57]. In the Csr/Rsm system, IHF was shown to directly bind to the promoter of thecsrBgene ofSalmonella) [18] and thersmZpromoter of
Pseudomonas fluorescens[58]. InSalmonella, deletion ofihfAwas also shown to decreasecsrB Fig 5. DNase I footprinting ofE.coli csrBDNA using phosphorylated and non-phosphorylated UvrY.A 32
P-end labeled DNA probe that included both the upstream and downstream putative UvrY binding sites was used for these experiments (shown inFig 1D). Reactions in all lanes except 1 contained DNase I (0.025U/ 12.5ul reaction). Reactions in lanes 3–6 and lanes 7–10 contained 0.25, 0.35, 0.5, 0.7μM of phosphorylated or non-phosphorylated UvrY-His6, respectively. Lane 2 reaction contained no UvrY protein. A vertical black bar indicates a protected region, and the sequence corresponding to the protected region is shown in a vertical rectangular box. An alignment of sequences corresponding to the protected regions from DNase I and the ChIP-exo results is shown in the horizontal rectangular box. The 18nt-long palindromic sequence and the partially conserved palindromic sequences are marked with broken black lines.
expression [18]. However, whether the observed effect of IHF in sRNA expression in those bac-terial species is UvrY-mediated and if so, whether IHF is required for UvrY to bind to DNA or for later transcription initiation steps is not clear.
In this study, we identified a putative IHF binding site in the promoter region ofcsrBofE.
coli(Fig 1D) andSalmonella(Fig 2C), in agreement with an earlier report [18], located between the upstream and downstreamin vivocrosslinking sites for UvrY-P, but we did not identify a similar site within thecsrCgenes. To determine whether IHF affects expression ofcsrBinE.
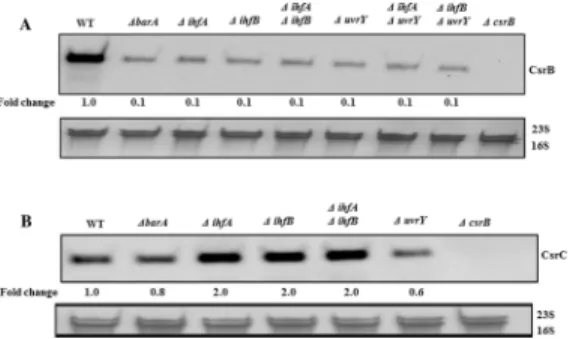
coli, we measured the levels of CsrB in the presence and absence of IHF (ΔihfAand/orΔihfB). Our results revealed a ~10-fold reduction in CsrB RNA levels in the absence of IhfA, IhfB, or both, compared to the isogenic wild type strain (Fig 7A). We also performed epistasis experi-ments in which we measured the effect of IHF (ΔihfAand/orΔihfB) on the expression ofcsrB
in a strain lackinguvrY(ΔuvrY). Our results showed that neither IhfA nor IhfB affected the lev-els of CsrB in theuvrYmutant strain (Fig 7A), suggesting that UvrY mediates the effect of IHF on the expression ofcsrB. Analysis ofcsrBDNA binding by UvrY-FLAG usingin vivo
ChIP-PCR analyses showed that binding was reduced by approximately 2.5-fold in the absence of either IhfA or IhfB (Fig 4), suggesting that IHF is required for optimal binding of UvrY-P to
csrBDNAin vivo. However, this modest effect of IHF on UvrY DNA binding does not appear to account for its 10 to 12-fold effect oncsrBexpression. Therefore, IHF also appears to affect later steps incsrBtranscription (Fig 7A). Western blotting experiments demonstrated that IHF did not affect the phosphorylation (S3 Fig) or expression of UvrY-FLAG (S5 Fig). Hence, our results reveal that IHF is required for optimum binding of UvrY-P tocsrBDNA and activation ofcsrBtranscription.
Fig 6. DNase I footprinting ofE.coli csrCDNA by phosphorylated and non-phosphorylated UvrY.A 32P-end labeled DNA probe that included both the upstream and downstream putative UvrY binding sites was used for these experiments (Fig 1E). Reactions in all lanes except lanes 1 contained DNase I (0.025U/12.5ul reaction). Reactions in lanes 3–6 and lanes 7–10 contained 0.25, 0.35, 0.5, 0.7μM of phosphorylated or non-phosphorylated UvrY-His6, respectively. Lane 2 reaction contained no UvrY. A vertical black bar indicates a protected region, and the sequence corresponding to the protected region is shown in a vertical rectangular box. An alignment of sequences corresponding to the protected regions from DNase I and ChIP-exo results is shown in the horizontal rectangular box. The 18nt-long palindromic sequence and the partially conserved palindromic sequences are marked with broken black lines.
IHF facilitates the transcription of many genes by bringing relatively distant DNA sites (~200 bp) closer together in space by bending the DNA (~140°) [59,60]. Therefore, we propose that UvrY-P bound at the upstream IR site (centered at -183/-182 incsrBofE.coliand at -182/-181 in thecsrBofSalmonella) is brought into the proximity of thecsrBpromoter-RNA polymerase complex by IHF-mediated bending of the DNA. Such DNA bending may lead to UvrY-P binding to the downstream DNA crosslinking site directly or indirectly through inter-actions with RNA polymerase or perhaps with other unknown DNA binding factor(s). This type of transcriptional activation, known as repositioning, is observed in promoters where the primary activator is unable to make a productive contact with RNA polymerase without being repositioned by a secondary activator [60,61]. Such a mechanism appears to be required for the activation of theE.coli narGpromoter by NarL, another FixJ family response regulator, which binds at–190, while IHF binds at -125 and Fnr binds at–41 ofnarG[59,60].
In contrast to its effect oncsrB, IHF was not needed for expression ofcsrC(Fig 7B). In fact, in the single and double IHF deletion strains, CsrC RNA levels were 2-fold higher than in the isogenic wild type strain (Fig 7B). This may be because in theΔihfAΔihfBstrains, the lower lev-els of CsrB RNA (Fig 7A) lead to an increase in the concentration of free CsrA in the cell, which in turn leads to increased levels of CsrC via a negative feedback loop in the Csr system [13].
UvrY effects on the expression of other putative
in vivo
targets
To examine the regulatory effects of UvrY on the expression of the potential new target genes discovered by ChIP-exo (S2 Table), we tested several gene products and transcripts from groups one, two and three by Western and Northern blotting. Our results showed little or no regulatory effects of UvrY on the expression of the genes that were tested (S6A and S6C Fig), with the exception ofcspA. UvrY showed a relatively modest, but reproducible negative effect on the expression of the cold-shock protein CspA (Fig 8).
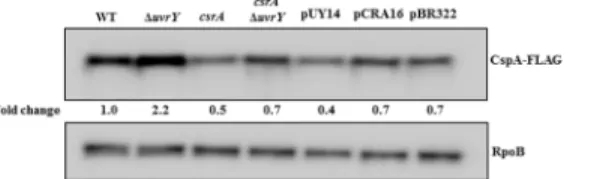
A 2-fold increase in the levels of CspA-FLAG was observed in aΔuvrYstrain compared to the isogenic wild type strain (Fig 8). Furthermore, disruption ofcsrAcaused a modest decrease in CspA-FLAG levels, suggesting that CsrA may activatecspAexpression. To determine whether UvrY regulatescspAindirectly through its effects on CsrB/C, and therefore CsrA activ-ity, we conducted an epistasis analysis (Fig 8). A strain that was disrupted in bothuvrYand
csrAwas transformed with plasmids expressinguvrYorcsrAfrom the plasmid cloning vector pBR322, and CspA-FLAG protein levels were determined in the resulting strains. We observed that CspA-FLAG levels were essentially identical in strains containing pBR322 and thecsrA -expression plasmid pCRA16. In contrast, theuvrY-expression plasmid (pUY14) led to modest
Fig 7. Effects of UvrY, BarA and IHF on CsrB/C sRNAs levels.Northern blots showing effect of several gene deletions on the levels ofE.coliCsrB (A) and CsrC (B). Cultures were grown in LB to mid-exponential growth phase (OD600of 0.6). The 16S/23S rRNA loading controls are also shown.
decrease in CspA-FLAG levels in this strain. These results are consistent with a model in which UvrY inhibitscspAexpression by binding to thecspApromoter, while the effect of CsrA may be mediated indirectly. Also consistent with this model,in silicoanalyses did not reveal typical CsrA binding sequences (GGA) in the 160 NT 5’-UTR of thecspAtranscript (data not shown) and an RNA-seq analysis conducted previously did not revealcspAmRNA among the 721 dif-ferent transcripts that copurified with CsrA [2].
Based on all of these observations, we conclude that, under the growth conditions tested, the BarA-UvrY TCS directly exerts its global effect on gene expression primarily through the Csr system by activating the transcription of the CsrB and CsrC sRNAs, withcspArepresenting a likely exception. This raises the question of why UvrY-FLAG crosslinkedin vivo(though weakly) to the regulatory regions of 286 genesin E.coliand 301 genes inSalmonella(S2 Table), but exerted little or no regulatory effect in the examples that were tested. To explain these observations, we propose three possible hypotheses: (i) Perhaps other unknown activator(s) are required along with UvrY/SirA for the expression of these genes, but were not available or functioning under the chosen growth conditions. Thus, UvrY/SirA might activate some of these genes under other growth conditions. (ii) Perhaps one or more repressors overrides the influence of UvrY/SirA on the expression of these genes under the conditions tested [62]. To address these two hypotheses, we searched for factors known to regulate the expression of the putative UvrY target genes. This analysis revealed several DNA binding proteins including CRP, FNR and IHF appear to regulate the greatest number of potential UvrY targets (S7 Fig). Hence, it is conceivable that such factors may mask the effects of UvrY on the expression of these genes under our growth conditions. (iii) Because the putative UvrY targets from the ChIP lack the 18nt-long IR sequence found in the regulatory regions ofcsrB/C, it is also possible that some of these genes have degenerate UvrY/SirA binding sites with no functional relevance or perhaps serving as nonspecific holding sites for UvrY/SirA [62,63].
UvrY expression is activated by CsrA via a putative posttranscriptional
mechanism that does not involve the RNA helicase DeaD, a known
regulator of
uvrY
translation
In addition to BarA-UvrY, the transcription of CsrB/C is also strongly activated by CsrA [13,
16,35] by mechanisms that are yet to be determined. Recent evidence suggested that CsrA pos-itively affectsuvrYexpression both at the transcriptional and translational levels [35]. More-over, CsrA is required for switching BarA from a protein possessing phosphatase activity to kinase activity on UvrY [35]. Thus, we tested the effect of CsrA on the expression, stability and phosphorylation of FLAG. The results showed that while CsrA does not affect UvrY-FLAG protein stability (S8A Fig), it has a strong positive effect on UvrY-FLAG expression
Fig 8. Effects of genes encoding UvrY and Csr factors on CspA protein levels.Western blot showing effects ofuvrYdeletion andcsrA::kandisruption on the levels of CspA-FLAG protein in an MG1655 derivative expressing CspA-FLAG (WT) from thecspAgenomic locus. Effect ofcsrA::kanΔuvrYcomplemented with UvrY (pUY14), CsrA (pCRA16) or control (pBR322) expression plasmids is also shown. Cultures were grown at 37°C in LB to mid-exponential growth phase (OD600of 0.6). The RpoB protein served as a loading control. This experiment was repeated at least three times with reproducible results.
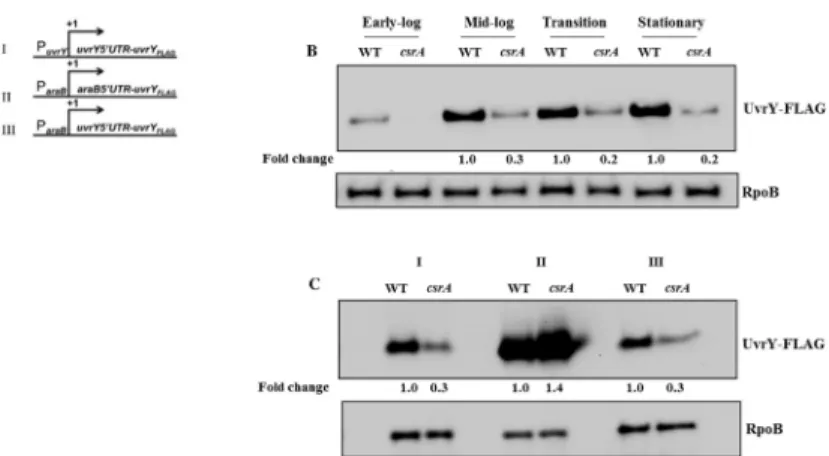
(Fig 9B). We observed a 5-fold reduction in UvrY-FLAG levels in acsrA::kanmutant strain compared to the isogenic wild type strain. These results confirm that CsrA regulates the expres-sion of CsrB and CsrC by activating UvrY expresexpres-sion. Moreover,in silicoanalyses did not reveal any typical CsrA binding sites in the 5’-UTR of theuvrYtranscript (data not shown) anduvrYmRNA was not among the 721 different transcripts that co-purified with CsrA [2], suggesting that the CsrA effect onuvrYexpression is likely to be indirect.
To assess the genetic effects of CsrA on UvrY expression, we analyzed fusion derivatives that replaced theuvrYpromoter or the promoter and noncoding leader with those fromaraB
(Fig 9A) [4]. Results from these experiments showed that regulation by CsrA requires theuvrY
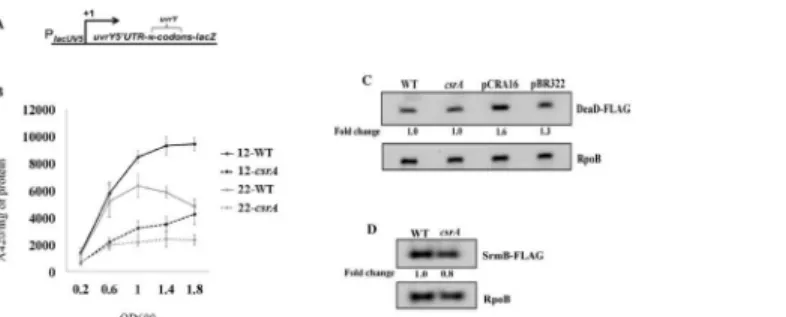
noncoding leader but not the promoter region (Fig 9C). To test whether CsrA requires sequence from theuvrYcoding region for regulation, we measured the expression of a uvrY’-’lacZtranslational reporter fusion containing the leader and 12 or 22 codons ofuvrYin wild type andcsrA::kanstrains (Fig 10A). The two different leaders were chosen because previous studies showed that the DeaD RNA helicase is needed to override inhibitory long-distance mRNA base-pairing between theuvrYnoncoding leader and the proximaluvrYcoding seg-ment, and that DeaD regulatesuvrYexpression from gene fusions with 22 or moreuvrY
codons, but not from fusions with less than this, e.g. 12 codons, which do not permit the inhibi-tory base-pairing [4]. Our results showed that expression of both fusions (22 and 12 codon) was decreased in thecsrA::kanstrain by 2.8 and 2.6-fold, respectively (Fig 10B), suggesting that the effects of CsrA are not mediated via DeaD. We also tested the effect of CsrA on the expres-sion of a DeaD-FLAG fuexpres-sion, expressed from the native chromosomal locus, and confirmed that CsrA does not regulatedeaDexpression (Fig 10C).
Furthermore, another RNA helicase, SrmB, was shown to regulate the transcription of CsrB and CsrC RNAs by an undefined mechanism, which is different than that of DeaD [4]. We, therefore, examined the effect of CsrA on the levels of SrmB-FLAG and observed no effect on the expression of this RNA helicase (Fig 10D). Thus, CsrA does not appear to regulate expres-sion of either of the DeaD-box RNA helicases that activate CsrB and CsrC transcription.
Finally, in a screen to find novel direct CsrA targets by RNAseq analysis,ihfAmRNA was found to co-purify with CsrA [2], suggesting that CsrA might regulate production of the IHF
Fig 9. Effect of CsrA onuvrYexpression.Gene fusions used in this study: (i) nativeuvrYregulatory region and coding sequence containing a FLAG1tag; (ii)araBpromoter and mRNA nocoding leader fused to the uvrY-FLAGcoding sequence and (iii)araBpromoter fused at the transcription start site to theuvrYnoncoding leader anduvrY-FLAGcoding sequence (A) as previously depicted (4). Effects ofcsrAdisruption on expression of the nativeuvrY-FLAGconstruct (panel A, i) in LB at different growth phases (B). Effects ofcsrA disruption on expression of theuvrY-FLAGconstructs shown in panel A (C). Strains were grown in the presence of arabinose, and UvrY-FLAG was detected at mid-log phase of growth by Western blotting. RpoB served as a loading control for these experiments.
protein. Therefore, we hypothesized that in addition to activatinguvrYexpression, CsrA might also activate the expression ofcsrBby activating the expression of IHF. However, we observed no effect of CsrA on IhfA-FLAG or IhfB-FLAG levels when these fusions were expressed from their native chromosomal loci (S8B Fig). Altogether, our results indicate that CsrA activates
csrB/Ctranscription by activatinguvrYexpression, most likely through a posttranscriptional mechanism that is yet to be defined.
Effects of ppGpp and DksA, mediators of the stringent response, on
csrB
expression
Previously, ppGpp and DksA were shown to strongly activate expression of CsrB and CsrC in
E.coli[2]. However, the mechanism for these effects is yet to be elucidated. In an attempt to define this mechanism, we hypothesized that ppGpp and DksA might activate the expression of factor(s) that are known to activate CsrB/C transcription i.e., UvrY, IHF, CsrA, DeaD and/ or SrmB. Previous studies showed that ppGpp and DksA positively affect CsrA levels, but this effect appears to be too modest to account for their strong effects on CsrB/C levels [2]. There-fore, we first determined whether DksA and ppGpp affect thein vivolevels of UvrY-FLAG pro-tein (Western blot) and thein vivo csrBDNA binding (ChIP-PCR) by UvrY inΔdksA,ΔrelA
(encoding the major ppGpp synthase) and isogenic wild type strains. It was found that ppGpp and DksA had weak or negligible effects on UvrY levels (Fig 11),in vivobinding of UvrY to
csrB(Fig 12), and thein vivophosphorylation status of the UvrY protein (S3 Fig). Next, we tested the effects of DksA and ppGpp on IHF expression. The results showed no effect of DksA or ppGpp on IhfA-FLAG (Fig 13A) or IhfB-FLAG levels under our growth conditions
(Fig 13B).
Because ppGpp and DksA did not substantially affect thein vivoexpression of IHF or alter thein vivobinding of UvrY-P tocsrBDNA, we decided to test their direct effects on thein vitrotranscription ofcsrBandcsrCgenes. However, neither gene was expressed in defined transcription reactions that contained UvrY-P and IHF in the case ofcsrBand basal reaction components (5nM RNAP; 40 mM TrisHCl, pH 7.9; NaCl (165 mM); 5% glycerol; 10 mM MgCl2; 1 mM DTT; 0.1μg/μl BSA; 500μMATP; 200μM CTP and UTP; 10μMGTP and
[α-32P] GTP (2.5μCi). This suggests that unknown factors may be required forcsrB/C Fig 10. CsrA activatesuvrYexpression without affecting DeaD or SrmB RNA helicase levels.TheuvrY gene fusions used in this study were previously depicted in (4):lacUV5promoter fused at the transcription start site to theuvrYmRNA leader and N (12 or 22)uvrYcodons fused in frame tolacZ(A). The effect ofcsrA disruption on expression of PlacUV5-uvrY’–’lacZreporter fusions is shown (B). Cells were grown in LB and harvested at various times throughout growth and assayed forβ-galactosidase specific activity (A420/mg protein). The values represent the average of two independent experiments. Error bars depict standard error of the means. Western blots showing effects ofcsrAon the level of DeaD-FLAG (C) or SrmB-FLAG (D) in an MG1655 derivative that expresses the corresponding FLAG-tagged gene from its native genomic locus are shown. Effect ofcsrA::kancomplemented by acsrAexpression plasmid (pCRA16) or with a control plasmid (pBR322) is also shown for DEAD-FLAG. RpoB served as a loading control for these blots.
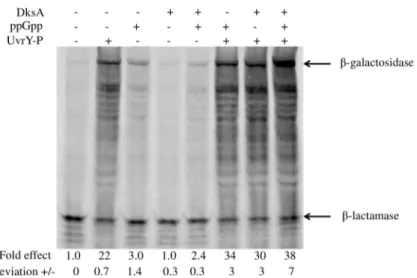
transcription (data not shown). We next used coupled transcription-translation in S-30 extracts to determine whether the addition of ppGpp and DksA would directly regulate expres-sion ofcsrB/Cin the presence of other cellular factors present in the S-30 extracts but not the defined transcription reactions. As previously reported [13,16], UvrY-P strongly stimulated the expression of the full-lengthβ-galactosidase fromcsrB-lacZ(Fig 14) andcsrC-lacZ(S9 Fig) transcriptional fusions in this assay. A series of truncatedβ-galactosidase products was also observed in these reactions, which quantitatively responded to activators similarly to the full-length protein. While expression in the absence of UvrY-P was weak, the addition of ppGpp or ppGpp and DksA to the UvrY-deficientcsrB-lacZreaction caused a modest increase in expression (Fig 14). In the presence of UvrY-P, addition of ppGpp alone modestly activated
csrB-lacZexpression (1.5-fold). DksA alone also had weak effects in the presence of UvrY-P (1.4-fold), while the addition of both ppGpp and DksA led to a 1.7-fold increase incsrB-lacZ
expression. Addition of ppGpp alone, in the absence of UvrY-P, resulted in a slight increase in
csrC-lacZexpression (S9 Fig). However, ppGpp and/or DksA failed to activatecsrC-lacZ
expression in reactions containing UvrY-P. We conclude that ppGpp and DksA directly acti-vatecsrBexpression, at least partially accounting for the stimulatory effect of these regulators on thein vivoexpression of this gene [2]. However, ppGpp and/or DksA may be indirectly involved in or require a factor that was deficient in our assays forcsrCexpression.
As mentioned above, DeaD and SrmB activatecsrBandcsrCtranscription by distinct mech-anisms [4]. While DeaD activatesuvrYtranslation, the mechanism by which SrmB activates
csrB/Ctranscription is still not defined. Our ChIP-PCR data revealed that SrmB is required for normal binding of UvrY tocsrB in vivo(S2 Fig). This effect of SrmB on UvrY binding occurs without it altering UvrY or UvrY-P levels [4]. Because neither ppGpp nor DksA had substantial
Fig 11. Effect of DksA and RelA on UvrY-FLAG levels.Western blotting of UvrY-FLAG levels in strains MG1655 (no FLAG fusion), WT (MG1655 expressing UvrY-FLAG from theuvrYgenomic locus), and isogenic
ΔdksAandΔrelAstrains. Proteins were collected from cultures grown in LB medium to mid-exponential growth phase (~OD600of 0.6). RpoB served as a loading control.
doi:10.1371/journal.pone.0145035.g011
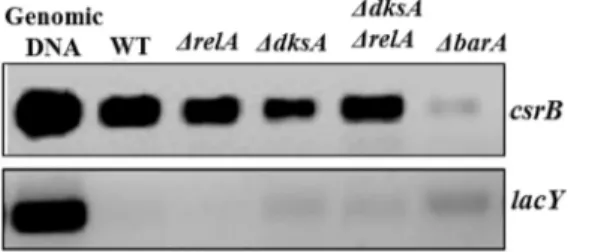
Fig 12. Effect of DksA and RelA onin vivobinding of UvrY tocsrBpromoter.The effect of DksA and RelA onin vivobinding of UvrY tocsrBpromoter was determined by ChIP-PCR assay in a WT (MG1655 expressing UvrY-FLAG) and isogenicΔdksA,ΔrelAandΔbarAstrains. Agarose gel showing PCR
amplification ofcsrBpromoter region recovered from each strain. ThelacYgene served as a negative control in this experiment.
effects onin vivobinding of UvrY tocsrBDNA (Fig 12) we infer that the mechanism by which ppGpp and DksA activatecsrB/Ctranscription does not involve SrmB and vice versa.
In silico
analysis of other possible targets of UvrY (SirA) binding
In many cases, transcription factors compete for binding to their DNA binding sites with other transcription factors, which may play antagonistic roles in the regulation of the target gene(s) [64]. Hence, we reasoned that there could be additional targets of UvrY/SirA in the genomes of
E.coli/Salmonellathat were not captured by ChIP-exo. To test this hypothesis, we performed
Fig 13. Effect of DksA, RelA and UvrY on the expression of IHF subunits.Western blotting of IhfA-FLAG (A) and IhfB-FLAG (B) proteins examined in WT (MG1655 expressingihfB-FLAGorihfA-FLAGfusions from the native genomic loci) and an MG1655 control lacking theFLAGfusions. Proteins from isogenic strains with
ΔdksA,ΔrelAandΔuvrYdisruption are as shown. Proteins were collected from cultures grown in LB medium to mid-exponential growth phase (~OD600of 0.6). RpoB loading controls for these analyses are also shown.
doi:10.1371/journal.pone.0145035.g013
Fig 14.In vitrotranscription-translation of a supercoiled plasmid-encodedcsrB-lacZtranscriptional fusion.Reactions contained pLFXcsrB-lacZ plasmid (2μg), UvrY-P (2.3μM), ppGpp (250μM) and/or DksA (2μM) as indicated. Incorporation of35S-labeled methionine into protein products was detected by SDS PAGE followed by phosphorimaging. Signal intensity of the full length protein was determined using Quantity One software. The fold-effects of regulatory factors were determined with respect to the control reaction lacking the factors, after normalization against the internal control,β-lactamase, which was encoded on the same plasmid. Absolute deviation for each reaction was determined from two independent experiments.
in silicoanalysis using theAb InitioMotif Identification Environment (AIMIE) database [65]. We scanned theE.coligenome using the first six bases of the 18 bp (TGTAAGNNNNNNCT-TACA) UvrY binding sequence, followed by manually checking the presence of the rest of the IR DNA sequence in the regulatory region of each discovered putative target. In this way, we identified 19 putative target genes containing the 18-bp UvrY-P IR sequence either perfectly or near perfectly conserved in their regulatory regions (S10 Fig). Next, we searched for factors known to directly regulate the expression of these putative targets and compared the respective DNA binding motif of each factor with the 18 bp IR UvrY binding motif. Out of the 19 putative targets, regulatory factors were previously established for 5 of them (S11 Fig). When we com-pared the respective DNA binding motifs of each factor with the IR binding motif of UvrY, we found an overlap in all of them (S11 Fig), supporting the possibility that undiscovered direct target sequences for UvrY binding might have gone undetected in our experiments. Whether these putative target sequences function in UvrY regulation under other growth conditions will require future investigation.
Phylogenetic distribution of BarA, UvrY, CsrA and FliW
The BarA-UvrY TCS exerts global effects on gene expression by activating CsrB and CsrC tran-scription, thus controlling CsrA activity [16,35]. This signaling pathway is common to the commensal bacteriumE.coli, the pathogenSalmonella, as well as a variety of otherγ -proteo-bacterial pathogens [66]. In contrast, little is known about the workings of the Csr system in other species that possesscsrAhomologs, but have not been shown to express CsrA-inhibitory sRNAs. Recently, Mukherjee et al. have shown that the FliW protein ofB.subtilisbinds to CsrA and antagonizes its activity, thus preventing it from binding to the flagellin mRNA,hag
[41,67]. Because BarA-UvrY is devoted to transcription of CsrB/C sRNAs inE.coliand Salmo-nellaandfliWis absent in species known to produce CsrA-inhibitory sRNAs [41], we hypothe-sized that BarA-UvrY and FliW might represent different modules for regulating CsrA activity in different bacterial species. To test this hypothesis, we examined the phylogenetic distribu-tions of CsrA, BarA-UvrY and FliW across fully-sequenced bacteria (S3 Table). We found that, for species encoding at least one readily identifiable CsrA ortholog, the presence of Bar-A-UvrY and FliW were strongly anti-correlated at species level (Spearman correlation = -0.97, p = 1.10x10-205) and genus level (Spearman correlation = -0.95, p = 7.31x10-74) (Fig 15). Of the 346 genomes encoding CsrA, 340 also encoded either BarA-UvrY or FliW, but not both, and only 6 species might encode both BarA-UvrY and FliW systems:Desulfosporosinus acidiphilus,
D.meridiei,D.orientis,D.baculatum,Magnetococcus marinus, andCandidatus Sulfuricurvum sp(Fig 15andS3 Table). Interestingly, in all cases where both BarA/UvrY and FliW may func-tion, only the BarA component appears to be present, which may indicate that this two-compo-nent system has lost or is losing its function in these species. Additional experimental data are needed in order to confirm this hypothesis.
After the sequence similarity filtering and manual curation, we found several false positives for CsrA in the Streptococcus genus, such as misannotated heavy metal stress response proteins (NCBI identification numbers (GI): 15675047, 13622200, 21904470), peptide methio-nine sulfoxide reductases (GI: 222114035, 134272076, 209540564, 24638057, 342165139, 342165138), and putative CsrA homologs that lack the N-terminal and C-terminal conserved regions of CsrA (GI: 895760047, 882844105, 882819224). Most of the main false negatives that we identified are BarA and UvrY from genomes that match the representative homologs from
E.coliwithin the similarity and coverage thresholds (see methods) such asPseudomonas
(NCBI genome accession numbers: NC_022594, NC_022591, NC_022361, NC_022360),
Xanthomonas(NC_020815, NC_017271, NC_017267, NC_016010, NC_013722), Pseudox-anthomonas(NC_014924),Shewanella(NC_009052, NC_009665, NC_008321, NC_008322, NC_017566, NC_016901), and other members of theγ-Proteobacteria class (S3 Table).
These false positives and false negatives caused a small increase of 2% in the negative corre-lation, reinforcing the present conclusions (Spearman correlation = -0.95 vs. -0.97, comparing the unfiltered and filtered data sets, respectively) (S3 Table). These results argue against meth-odological bias as strongly affecting our results. Together, these results indicate that the nega-tive correlation between FliW and BarA-UvrY regulatory systems is highly unlikely to be artifactual and thus represents a biologically relevant observation. The implications of this observation for the possible regulation of CsrA activity by inhibitory sRNAs in FliW-encoding species will require additional investigation to unravel.
Conclusions
Using ChIP-exo [34], we probed the complete repertoire of UvrY (SirA) DNA binding sites in the genomes ofE.coliandSalmonella. We discovered that thecsrB/C genes are by far the stron-gest direct targets of UvrY in these species. UvrY binds specifically to an 18 nt palindromic sequence in the promoter regions ofcsrB/Cand exhibited an almost absolute requirement for phosphorylation by BarA for this bindingin vivounder growth conditions examined. UvrY-P requires IHF for optimal binding to and activation ofcsrBbut notcsrC. CsrA activatescsrB/C
transcription by activatinguvrYexpression by an undefined mechanism, which may require the noncoding mRNA leader, but does not involve the other known posttranscriptional
Fig 15. The distribution of CsrA, BarA, UvrY and FliW across phylogenies indicates a strong anti-correlation between BarA/UvrY and FliW.Depicted is a reference phylogeny of fully-sequenced genomes encoding CsrA and at least one of BarA, UvrY or FliW, plotting their presence/absence data obtained from orthology databases. The results show that the presence of BarA-UvrY and FliW are significantly anti-correlated.
regulator ofuvrY, the DeaD-box RNA helicase DeaD [4]. The RNA DEAD-box helicase SrmB, which also activatescsrB/Ctranscription inE.coli[4], promoted binding of UvrY tocsrBDNA
in vivowithout affecting the expression of other factors known to activatecsrBexpression. This suggests that SrmB may regulate unknown factor(s) involved incsrBtranscription. The strin-gent response factors ppGpp and DksA activate CsrB/C expressionin vivo[2] and were found to modestly activatecsrBexpressionin vitroin S-30 extracts. Whether this involves direct bind-ing to RNA polymerase remains to be determined.
Genomic loci that crosslinked weakly to UvrY were identified proximal to the promoter regions of 286 genes inE.coliand 301 genes inSalmonella, respectively (S2 Table). However, further analysis showed weak or negligible regulatory effects of UvrY on the expression of the genes that were tested (S6A–S6C Fig). Hence, we conclude that, under the growth conditions that we have examined, UvrY-P exerts its global effects on gene expression almost entirely by activating the transcription of CsrB and CsrC. We suspect that most of the genes that have been found to respond to BarA and UvrY inE.coli[31] and their orthologs in other species [30,32] are indirect targets of UvrY, which are regulated by CsrA.
The BarA-UvrY/Csr signaling pathway has been studied in the commensal bacteriumE.
coli, the pathogenSalmonella, and a number of otherγ-proteobacterial pathogens [66].B. sub-tilis, the only Gram-positive bacterium in which CsrA has been studied to date, uses FliW as an
α-CsrA protein, which binds to and inhibits CsrA activity [41,67]. While this is only the first such example, FliW is present in diverse species, where it may act as an inhibitor of CsrA. For species encoding at least one readily identifiable CsrA ortholog, the presence of BarA-UvrY and FliW were strongly anti-correlated. This suggests that whileγ-Proteobacteria use the Bar-A-UvrY TCS to control CsrA by activating the transcription of its sRNA antagonists, members of theβ-Proteobacteria,δ-Proteobacteria,ε-Proteobacteria, Firmicutes, Spirochaetes, Thermo-togae, Actinobacteria, Nitrospira, Thermosulfobacteria, Deferribacteres, Planctomycetes, Chla-mideae, Acidobacteria, and Synergistia may use FliW to regulate CsrA activity.
Supporting Information
S1 Fig. SirA-FLAG and UvrY-His6are functionalin vivo.Western blot showing expression of SirA-FLAG (A) and Northern blots showing CsrB levels in 14028S (wild typeSalmonella), 14028S strain withsirA-FLAGfusion integrated at the nativesirAlocus andsirAandcsrB dele-tion strains (B). CsrB levels in MG1655,uvrYdeletion and UvrY-His6(expressed from
pET24-a expression vector)E.colistrains (C). For Western blotting, RpoB loading controls shown (A). For Northern blotting, the 16S/23S rRNA loading controls are shown. Cultures were grown in LB to mid-exponential growth phase (OD600of 0.6).
(TIFF)
S2 Fig. ChIP specificity confirmation by PCR.Polymerase chain reaction was used to con-firm the specificity of ChIP assay. Primers (S1 Table) annealing to the promoter regions of
csrB,lacYand 16S rDNA (rrsH) were used to amplify the promoters ofcsrB,lacYand/or 16S rDNA genes from DNA that was crosslinked and immunoprecipitated fromE.coli(panel A) orSalmonella(panel B). In these analysis,csrBwas used as a positive control andlacYand 16S rDNA (rrsH) were used as negative controls forE.coliandSalmonella, respectively.
(TIFF)