-26- Abstract — The internet provides a wide range of scientific information for different areas of research, used by the related scientific communities. Often the design or architecture of these web pages does not correspond to the mental model of their users. As a result the wanted information is difficult to find. Methods established by Usability Engineering and User Experience can help to increase the appeal of scientific internet information services by analyzing the users’ requirements. This paper describes a procedure to analyze and optimize scientific internet information services that can be accomplished with relatively low effort. It consists of a combination of methods that already have been successfully applied to practice: Personas, usability inspections, Online Questionnaire, Kano model and Web Analytics.
Keywords — Scientific Portal, Usability, User Experience, Questionnaire, UEQ, Kano model
I. INTRODUCTION
OWADAYS, people expect scientific content to be provided by research institutions online via the internet. Therefore, scientific internet portals for a wide range of research areas were developed and can be easily accessed.
For an institution that provides such a service it is essential that the offered information is useful for the user as it can help to increase the provider’s reputation. This includes not only the information itself, but also the way the information is presented to the user. A successful use of an internet information service can be monitored e.g. by web traffic analysis: an increasing number of users, a high number of recurring users or direct accesses to the web pages implicate a satisfying information service.
On the other hand, usually the bulk scientific information within the internet is provided by research groups at universities or institutes. Very often the operation of such a service is not part of the main work and is carried out additionally to the daily research routine. Therefore, it is in the interest of the providers to run a successful internet information service with as low as possible requirements for time and effort.
In this paper we would like to outline a procedure for
analyzing and optimizing scientific internet information services using common methods of Usability Engineering and User Experience.
Usability Engineering within the scope of the World Wide Web traditionally is used for internet services applying to a broad variety of users, like news (paper) portals or shop systems. Corresponding methods are given by Scholtz [1] and Hornbæk [2]. Such broadly ranged internet presences usually are accessed by a large number of users which are already connected content wise to the service. Therefore, standard procedures like questionnaires [3] or A/B-Tests [4] can be applied for achieving fast and valid results.
For business software it is different. Here, usually so-called business users who frequently use such systems are at hand for evaluation. As a result, usability methods based on direct user participation like interviews as well as usability tests can be used.
In contrast to the above outlined internet presences and business software, a scientific information service is accessed by a small spread target audience. In this paper, we would like to introduce the term ‘compact target audience’ to describe this group of users. It is characterized by:
• Limitation: the number of (potential) users is small, • Internationality: users access from all over the world, • Homogeneity: the users share a comparable (academic)
background,
• Focus: the information users look for is very specific. This ‘compact target audience’ brings some limitation to the reasonably applicable methods of Usability Engineering and User Experience. Mainly, due to the relatively low number of (potential) users a reliable statistical analysis is difficult to achieve.
II.PROPOSED PROCESS MODEL
Because of the limitations by a ‘compact target audience’ we would like to propose a combination of methods especially for scientific internet information services. Despite being a mixture of several different procedures the overall amount of work is still relatively low as the collected data is not that extensive and therefore easy to handle.
Usability Evaluation Methods for Special
Interest Internet Information Services
Eva-Maria Schön
1, Jens Hellmers
2, Jörg Thomaschewski
31
SEVEN PRINCIPLES
,
Germany
2
University of Bremen
,
Germany
3
University of Applied Sciences Emden/Leer, Germany
N
International Journal of Artificial Intelligence and Interactive Multimedia, Vol. 2, Nº 6
-27- We recommend the following methods: Personas, usability inspections, User Experience Questionnaire, product usage related questions, product related questions, Kano Model and Web Analytics. The correlations of the particular methods are outlined in Fig. 1.
Fig. 1 Overview of the process model
A corresponding prototypical approach has been undertaken for the internet information portal regarding electromagnetic and light scattering ScattPort [5]. This procedure considers an
already operational internet service which is currently accessed by the corresponding scientific community. That is why access data exists that can be used for the analysis.
For the conception of a new scientific service we would like to refer to Beyer et al. [6], Winter et al. [7] and the process of
Human Centered Design described in DIN EN ISO 9241-210
[8] for more detailed information.
III. EVALUATION OF SPECIAL INTEREST INTERNET INFORMATION SERVICES
A.Personas
To ensure the acceptance of a scientific information service it is essential to know the potential users. Knowledge of their motivation and expectations helps to constructively adapt the web pages in regard to information architecture, interaction design and content editing. As in this case there is a ‘compact target audience’ a convenient approach would be the use of Personas.
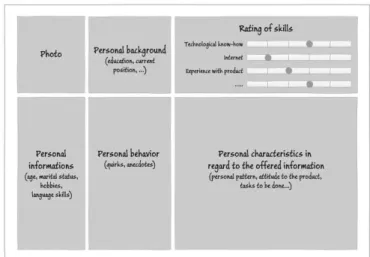
The method Personas originates from the User Centered Design [9]. A Persona concretely describes the profile of a potential user. This profile consists of demographic data like name, age and origin. Also a photograph of the user is presented. Information on the user’s motivation to access an offer and usage patterns are part of the Persona, too. This includes short notes about personal quirks and characteristics. The data is given in short list-form.
Fig. 2 shows an example for the general structure of a Persona. A specific example for a Persona can be found e.g. at Winter et al. [7].
A Persona does not describe a specific, existing person. Instead it represents a whole, concrete group that is part of the target audience. Therefore, several Personas are created to cover the whole range of the users the target audience consists
of. A big advantage of this method is that it can help to prevent providers and developers of a product – in this case the scientific information service – from projecting their own assumptions onto the target audience [10]. Instead an empathic understanding for the real users and their motivation is established.
Fig. 2. General structure of a Persona
There are several ways to develop Personas. One way is to collect data on the target audience by interviews or surveys. This data is then abstracted into Personas [9]. Another way is to develop so-called Ad-Hoc Personas [11]. These are based
on observations and experiences of (potential) users by the providers and developers themselves. It has been mentioned that this joint development of Personas within a project team increases the willingness to use Personas on a permanent base [12]. Such Ad-Hoc Personas were e.g. developed in the frame of a project to investigate the scientific internet information service regarding the topic of electromagnetic and light scattering ScattPort [13]. Here, we would like to exemplarily
list the six different types of users who were identified and for which Personas were created:
• The established professor with many years of experience, • The dynamic young professor who just started a career, • The PostDoc scientist,
• The Ph.D. student,
• The established scientist working outside an university or institute,
• The engineer working in the industry.
Such an approach can be easily transferred to any kind of scientific information service by identifying the relevant user groups and developing corresponding Personas, altogether covering the target audience.
-28-
B.Usability inspections
Usability inspections (see Fig 1.) should be used to analyze the web content to check the information architecture and to identify usability problems. The corresponding methods
Cognitive Walkthrough and Heuristic Evaluation are
described by Scholtz [1]. In the frame of the Cognitive Walkthrough an usability expert defines user-orientated intentions based on Personas. The resulting scenarios are then simulated using the actual user interface. This process is reviewed by an expert who especially examines whether a user would be able to execute the outlined operation and if this action would lead to the correct result or not. On the other hand for the Heuristic Evaluation an interface is reviewed using defined and approved rules for Usability [15], [16], [17]. Again, Personas are applied for this process.
C.User Experience Questionnaire UEQ
The User Experience Questionnaire (UEQ) [3] is an established questionnaire for the quantitative evaluation of the User Experience [8]. The main idea of the questionnaire is to collect the immediate and spontaneous response by a user regarding a product (in this case the product is an internet service on the whole, which includes structure and content).
The best way for this is to survey users directly and personally, e.g. during a conference. In cases when this is not possible the UEQ can be set up online, e.g. by prominently placing a corresponding link on the starting page of the information service.
The advantage of the UEQ in comparison to other surveys (e.g. IsoMetrics [18], SUMI [19]) is that usability aspects (efficiency and effectiveness) are expanded by Hedonic Quality [20] (attractiveness, stimulation, novelty). For this
reason additionally to Usability, User Experience can also be evaluated.
A different survey for the evaluation of User Experience was developed by Hassenzahl [21].
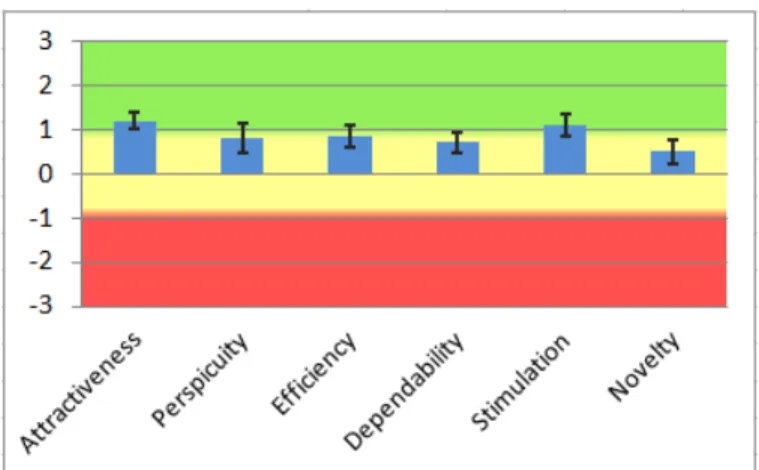
The UEQ covers six dimensions: Attractiveness, Perspicuity, Efficiency, Dependability, Stimulation, and Novelty. It is based on the semantic differential of 26 bipolar pairs of adjectives (Fig. 3).
The items are scaled from -3 to +3. Thus, -3 represents the most negative answer, 0 a neutral answer, and +3 the most positive answer.
Fig. 3. Example of the UEQ
Note: these are the values actually used for the numerical analysis of the impressions given by the users. The survey presented to the users itself (on paper or online) shows a slightly different scale. Here, the values range from 0 to 7. This is done to avoid a subliminal influence on the users during the questioning caused by negative numbers (see Fig.3).
Fig. 4. Example of an UEQ result.
For the analysis the following aspects should be considered. Scale values above +1 indicate a positive impression of the users concerning this scale, values below -1 a negative impression. Due to well-known answer effects, like the avoidance of extremes, observed scales means are in general in the range of -2 to +2. More extreme values are rarely observed, so a value near +2 represents a very positive near optimal impression by the participants. Fig. 4 shows an example for an overall result including error bars. The graphic is automatically generated by the data analysis sheet (Excel) that can be downloaded together with the questionnaire.
Rauschenberger et al. [22] give specific recommendations for the practical work with the UEQ and its interpretation. More information and the UEQ itself are available online [23].
D.Product usage related questions
The UEQ presents pre-defined questions and answers that can be universally applied to a wide range of products and is an easy and fast method to analyze User Experience. But as a result of its universality it cannot cover usage and specific product attributes. Therefore, a survey (see Fig. 1) should contain corresponding fields allowing users to describe their own usage of the product. It is important to keep the number of such fields low as too many fields will have a negative influence on the users’ motivation, which could lead in the end to non-usable data. In this sense the length of a questionnaire plays an important role as it has an impact on the response behavior [24]. The response rate to a short questionnaire is larger than the response to long questionnaires as they tend to lead to a higher drop-out rate [25]. To avoid common errors in the development of questionnaires appropriate guidelines should be used [26].
International Journal of Artificial Intelligence and Interactive Multimedia, Vol. 2, Nº 6
-29- • How often do you use <the internet information
service>?
• On which devices do you use <the internet information service>?
• How high is your motivation to add content yourself? This should be added by questions regarding demographic data like age, position and gender. The results of these questions can be used to verify or optimize the Personas.
E.Product related questions
So far a user cannot state comments on observed flaws or suggest possible improvements. Here, product related questions (see Fig. 1) can help to collect individual impressions to identify more user requirements. Exemplarily, we would like to suggest questions like the following:
• How do you like the general presentation of the internet service?
• How do you like the presentation of <specific product feature>?
• How would you rate <a possible specific product feature for the future #1>?
• How would you rate <a possible specific product feature for the future #2 >?
• etc.
We suggest the usage of a Likert scale [27] followed by a text field for every question to get qualitative and quantitative data. Additionally one text field can be given to write down personal opinions on how to improve the information service.
F.Kano Model
The Kano model (see [28], [29], [30]) sorts requirements into different categories. Each category has specific influence on a user’s satisfaction. This allows identifying the relevance of product attributes. This is outlined in Fig. 5.
Table 1 describes this scheme in more detail. There are three main categories: basic requirement, performance requirement and enthusiasm requirement [29]. The basic requirement is expected by a user. Without it the product
misses its purpose. A user will not feel any satisfaction from it, but will be definitely dissatisfied if it is missing. Contrary to that, a performance requirement has a direct connection to the
user’s satisfaction. The enthusiasm requirement provides a
sort of ‘extra’. It will not be missed, but can help to improve the satisfaction. Additionally to the main categories there are
indifferent factor, reverse factor, and questionable factor.
For constructing a Kano questionnaire a pair of questions for each product feature is formulated: a functional question (“If the product contains the feature, how do you feel?”) and a corresponding dysfunctional question (“If the product doesn't contain the feature, how do you feel?”). Because of these combinations of seemingly similar questions the questionnaire might get exhausting or even boring for the user [26]. Producing an answer for these kind of questions is no longer a motivating challenge, leading to the effect that the attention of the user is not focused on the questions. This is especially disadvantageous as the target audience is already small in
numbers. As a result the usable data set could be decreased significantly.
Because of this, in our proposed procedure the Kano model is not applied 'step-by-step' to its full extent, instead its basic-core with categories as outlined in Table 1 is used to interpret the answers (context see Fig. 1).
Fig. 5. Kano’s model of customer satisfaction (see [30])
By this, a questionnaire can be kept compact. Nevertheless, it enables not only to analyze whether a user requirement is fulfilled or not, but also how satisfied a user is. To give an example how to use the Kano categories for the interpretation of the product related questions we like to refer to the article about the evaluation of the ScattPort internet information
portal [5].
To address the problem of possible self referential assumptions Personas were applied to the interpretation, helping to focus on the users' mental models and needs. This procedure proved itself very helpful for the evaluation of the statements given by the users.
For example for the question “How do you like the presentation of the program list” 24 Likert scale answers and
TABLE I
KANO MODEL – PROPERTIES AND IMPACT (SEE ALSO [5], [29]).
Category Impact Description
basic requirement
Must-be user expects it, will not be satisfied if fulfilled, but dissatisfied if not fulfilled
performance requirement
One-dimensional the better it is fulfilled the more satisfied a user will be
enthusiasm requirement
Attractive user does not expect it, will not be dissatisfied if not fulfilled but satisfied if fulfilled
indifferent factor Indifferent user has no use for it, is neutral
reverse factor Reverse user expects the opposite
questionable
-30- 12 usable text field comments were given. The vast majority expressed satisfaction with the current presentation [5].
The users’ comments stressed the program list as the central feature of the information service ScattPort [31]. This was
interpreted as a Must-be feature and thereby a basic requirement (see Table 1).
The other product related questions were evaluated accordingly. This procedure shows how the users rank the current implementation, general availability or lack of certain product features.
G.Web Analytics
For already existing special interest information services the analysis of the access data can provide useful information about its perception by the users [32]. Web Analytics tools help to collect and interpret data about user behaviour, which then can also be used to verify conclusions gathered by the methods described above. Suitable tools for Web Analytics are
Google Analytics, Piwik or Open Web Analytics (OWA).
It is possible to compare statements (from the UEQ or Kano analysis) regarding the appeal of certain sections with the actual number of accesses to those parts of the service. For example, popular and highly accessed webpages can be considered as a central part of the offered information and therefore indicate a Must-be feature (compare Table 1). Such
data can be cross-checked with statements collected during a Kano-based evaluation respectively interpretation. Also the kind of access contains information. A direct request for a page (e.g. by a bookmark) indicates that this page fulfils a user’s needs. The next step then should be to analyze the rate of recurring accesses and users. Returning users indicate the successful fulfilment of their needs. Additionally the usability of the information service can be estimated: a poorly designed information structure leads to users' frustration and would prevent them from returning. Redirections from result pages of a search engine on the other hand can indicate first time visits. The corresponding rate in combination with the average time a user stays on the page can also be used to determine the appeal of areas of the internet service: immediate leaving of a page accessed via web-search indicates that a user was expecting a different kind of information. Subsequent accesses of other pages (starting from the firstly viewed page after a web-search) are more difficult to interpret: it can either mean that a user got curious and checks out the other pages and their information, or the user simply got lost. Here the time a user stays on subsequent pages can help with the interpretation as interested users should stay longer on these pages, reading them thoroughly, than frustrated ones. Now, indications for satisfaction or frustration can also be derived for example from the UEQ and thereby compared to the web analytic statistics.
While the described methods for usability inspections help to expose flaws in the presentation of the information service, web analytics can help to set priorities for their adjustment. Highly accessed areas should be fixed first.
An In-Page-Analysis shows how users interact with a webpage, e.g. which links they follow and on which areas on
the screen they focus. This allows determining whether the content is presented in a way users prefer or not. As a result the landing page of a service can be adjusted and improved by rearranging the content. Placing interesting – means: popular – topics in front of the user the first time he or she accesses the service will lead to a higher satisfaction and thereby to a better chance for recurring visits.
In general, Unique Visitors, Visits/Sessions and Page Views are considered the most important metrics for Web Analytics [33]. Additionally Entry Page, Landing Page, Visit Duration, Click-through und Page Views per Visit can be useful [34].
A more detailed example for the interpretation of data provided by Web Analytics in relation to statements collected by UEQ and Kano analysis can be found at Hellmers et al. [5].
IV. SUMMARY
This article describes a procedure for the evaluation of scientific special interest internet services using methods of Usability Engineering and User Experience.
It especially takes into account that the user base is a ‘compact target audience’: there is a limited number of (potential) users who are looking for very specific information and who share specific user requirements. This is a disadvantage for the conventional evaluation methods used nowadays as they rely on a sort of 'critical data mass' for a successful statistical analysis.
Now, the importance of small-scale internet information services for compact audiences like a specific scientific community should not be underestimated. By increasing the awareness-level they can help to boost the scientific progress, to improve the reputation of the providing institution, and to gain funding for scientific projects. Therefore, a successfully designed special interest internet service is as advantageous for the provider as it is for its users.
The approach proposed here consists of a combination of methods that already has been successfully applied in practice: Personas, usability inspections, User Experience Questionnaire (UEQ), product usage related questions, product related questions, Kano-based interpretation and Web Analytics.
The idea is to check whether the corresponding statements and results collected by each individual method support each other or not. Matching data can be considered reliable and therefore used to analyze the users' needs and their impression of the usability of an already existing service. This helps to improve the information service further. Inconsistent or even contradictory data hint basic flaws of a service; the corresponding concept should be checked.
By this it is possible to gather information about the users’ perception of an internet service in a relative easy way and with low effort, even in cases where the dataset is low.
Overall, it helps to develop and improve a scientific internet information service in regard to Usability and User Experience.
International Journal of Artificial Intelligence and Interactive Multimedia, Vol. 2, Nº 6
-31- • Usability inspections help identifying usability problems, • The User Experience Questionnaire (UEQ) gives
information on the users perception of an existing internet service,
• Product usage related questions expand the UEQ to gather information about aspects of the usage and specific attributes of the internet service,
• Product related questions allow users to describe their impressions of an existing service, to comment specific requirements, and to suggest ways how to improve the offer,
• A Kano analysis indicates the functional satisfaction by reviewing certain attributes and sorting them into specific categories,
• Web Analytics can be used to analyze the users’ behavior and to check data collected by the other methods for plausibility.
The approach outlined not only suits scientific internet information services. It also should be applicable in other cases with a ‘compact target audience’.
REFERENCES
[1] J. Scholtz. (2004). Usability Evaluation [Online]. Available:
www.itl.nist.gov/iad/IADpapers/2004/Usability%20Evaluation_rev1.pdf [2] K. Hornbæk, “Current practice in measuring usability: Challenges to usability studies and research” in International journal of human -computer studies, 64 (2), 2006, pp. 79–102.
[3] B. Laugwitz, T. Held, and M. Schrepp, “Construction and Evaluation of a User Experience Questionnaire” in Lecture Notes in Computer Science (5298), 2008, pp. 63–76.
[4] J. Nielsen. (2005). Putting A/B Testing in Its Place [Online]. Available: www.nngroup.com/articles/putting-ab-testing-in-its-place/
[5] J. Hellmers, J. Thomaschewski, E.-M. Holt, and T. Wriedt, “Usability evaluation methods for a scientific internet information portal” in Journal of Universal Computer Science (JUCS) 18 (10), 2012, pp.1308– 1322.
[6] H. Beyer, User-centered agile methods. San Francisco, Calif.: Morgan & Claypool, 2010
[7] D. Winter, E.-M. Holt, and J. Thomaschewski, “Persona driven agile development. Build up a vision with personas, sketches and persona driven user stories“, in 2012 Proc. Information Systems and Technologies (CISTI). Vol. 2, pp. 307-310.
[8] DIN EN ISO 9241-210:2011-01, Ergonomics of human-system interaction – Part 210: Human-centred design for interactive systems, Beuth, Berlin, 2011
[9] A. Cooper, The inmates are running the asylum. Indianapolis, Ind.: Sams, 1999
[10] A. Cooper, R. Reimann, and D. Cronin, About face 3: The Essentials of Interaction Design. Indianapolis, Ind.: Wiley, 2007
[11] D. Norman. (2004). Ad-Hoc Personas & Empathetic Focus [Online]. Available: jnd.org/dn.mss/personas_empath.html
[12] Å. Blomquist and M. Arvola, “Personas in action: ethnography in an interaction design team” in Proc. of the second Nordic conference on Human-computer interaction, 2002, pp. 197–200.
[13] J. Hellmers, E.-M. Holt, and J. Thomaschewski, “Personas für das wissenschaftliche Internetportal ScattPort zum Thema Lichtstreuung”, in Proc. 2. Symposium Wissenschaftliche Portale und Informations-netzwerke, Institut für Werkstofftechnik, Bremen, 2011
[14] DIN EN ISO 9241-11:1998, Ergonomic requirements for office work with visual display terminals (VDTs) – Part 11: Guidance on usability, Beuth, Berlin, 1999
[15] R. L. Mack and J. Nielsen, Usability inspection methods. Wiley & Sons, 1994
[16] B. Shneiderman and C. Plaisant, Designing the user interface. Strategies for effective human-computer interaction. 5. ed., internat. ed. Upper Saddle River, NJ: Addison-Wesley/Pearson, 2010
[17] DIN EN ISO 9241-110: 2006, Ergonomics of human-system interaction - Part 110: Dialogue principles, Beuth, Berlin, 2008
[18] G. Gediga, K. Hamborg, and I. Düntsch, “The IsoMetrics usability inventory: an operationalization of ISO 9241-10 supporting summative and formative evaluation of software systems”, Behaviour & Information Technology, 18 (3), 1999, pp. 151–164.
[19] J. Kirakowski and M. Corbett, “SUMI: The software usability measurement inventory” in British journal of educational technology, 24 (3), 1993, pp. 210–212.
[20] M. Hassenzahl, “The Effect of Perceived Hedonic Quality on Product Appealingness” in International Journal of Human-Computer Interaction 13 (4), 2001, pp. 481–499.
[21] M. Hassenzahl, M. Burmester, and F. Koller, “AttrakDiff: Ein Fragebogen zur Messung wahrgenommener hedonischer und pragmatischer Qualität” in Proc. Mensch & Computer 2003, pp. 187– 196.
[22] M. Rauschenberger, M. Schrepp, M. Perez-Cota, S. Olschner, and J. Thomaschewski, “Efficient Measurement of the User Experience of Interactive Products. How to use the User Experience Questionnaire (UEQ). Example: Spanish Language Version“ in IJIMAI: International Journal of Interactive Multimedia and Artificial Intelligence, Bd. 2 (Special issue “Artificial Intelligence and Social Application”, Vol 2. Nr. 1), 2013, pp. 39-45.
[23] User Experience Questionnaire [Online]. Available: www.ueq-online.org
[24] M. Bosnjak, B. Batinic, “Understanding the Willingness to Participate in Online-Surveys – The Case of e-mail Questionnaires” in Online social sciences, 2002, pp. 111–116.
[25] T. Tuten, D. Urban, M. Bosnjak, “Internet Surveys and Data Quality: A Review” in Online social sciences, 2002, 7–27.
[26] L. Gräf, “Assessing Internet Questionnaires: The Online Pretest Lab” in Online social sciences, 2002, 73–93.
[27] R. Likert, “A Technique for the Measurement of Attitudes” in Archives of Psychology No. 140, 1932
[28] E. Sauerwein, F. Bailom, K. Matzler, and H.H. Hinterhuber, “The Kano Model: How to delight your customers” in Preprints Volume I of the IX. International Working Seminar on Production Economics, Innsbruck/Igls/Austria, February 19-23 1996, 1996, pp. 313–327. [29] E. Sauerwein, “Experiences with the reliability and Validity of the
Kano-Method: Comparison to Alternate Forms of Classification of Product Requirements” in Transactions of the 11th Symposium on QFD, 1999, pp. 416–429.
[30] C. Berger, R. Blauth, D. Boger, C. Bolster, G. Burchill, W. DuMouchel, F. Pouliot, R. Richter, A. Rubinoff, D. Shen, M. Timko and D. Walden: “Kano’s Methods for Understanding Customer-defined Quality”; David Walden (Ed): Center for Quality Management Journal, Vol. 2, Nr. 4 (Fall 1993) (Vol. 2, Nr. 4 (Fall 1993)), pp. 3–36.
[31] T. Wriedt and J. Hellmers: “New Scattering Information Portal for the light-scattering community”; Journal of Quantitative Spectroscopy & Radiative Transfer 109, 2008, pp. 1536–1542
[32] L. Hasan, A. Morris, and S. Probets, “Using Google Analytics to Evaluate the Usability of E-Commerce Sites”, Lecture Notes in Computer Science, 2009, pp. 697–706.
[33] J. Burby, A. Brown and WAA Standards Committee, “Web Analytics “Big Three” Definitions Version 1.0”, 2006
[34] J. Burby, A. Brown and WAA Standards Committee, “Web Analytics Definitions Version 4.0”, 2007
-32-
Dr. Jens Hellmers received a diploma in Physics from the University of Oldenburg, Germany in 1998 and a Doctor Degree in Engineering from the University of Bremen, Germany in 2008. Currently, he is Researcher at the Process Engineering department of the University of Bremen. In several projects he investigated the potentials and feasibility of internet information services for a scientific community from technical points of view, but also in regard of Usability and User Experience. Dr. Hellmers is co-creator of the ScattPort internet information portal on the topic of light scattering.
![Fig. 5. Kano’s model of customer satisfaction (see [30])](https://thumb-eu.123doks.com/thumbv2/123dok_br/16400847.193536/4.918.487.855.513.794/fig-kano-s-model-of-customer-satisfaction-see.webp)
