Abstract—Today online social networking platforms such as Facebook, Flicker, Twitter, and YouTube often serve a breaking news role for natural disasters. The role of these social networks has significantly increased following the recent disasters around the world; the 2010 Philippine typhoon, the 2010 Haiti earthquake, the 2011 Brazil flood, and the 2011 Japan earthquake and tsunami. Moreover, these platforms are among the first ones to help communicate the news to a large mass of people since they are visited by millions of users regularly. In such emergency situations, detecting and analyzing hot spots or key events from the pool of information in the social networks are of major concerns in assessing the situation and in decision making. In this paper, a knowledge based event analysis framework for automatically analyzing key events is proposed by using various social network sources in case of disasters. In doing so, some mathematical modeling techniques of branching processes and Markov chain theory are explored and employed to investigate how news about these disasters spreads on the social networks and how to extract trust and reliable key information. Specifically the abnormal or suspicious topics and important events within various social network platforms are analyzed by using a set of selected messages and visual data. Finally some illustrative sample results are presented based on a limited datasets of YouTube and Twitter in the case of March 11, 2011 Japan Earthquake and Tsunami.
Index Terms—social network, disaster event, knowledge based, clustering
I. INTRODUCTION
N recent years, the world has witnessed the occurrence of a series of big natural and man-made disasters such as Hurricane Katrina in USA, earthquakes in Haiti and Asia, the tsunami in Indonesia, the earthquake and tsunami in Japan, extremely cold winter in Europe, Mumbai terrorist attacks in India and World trade tragic event in New York, USA. In general, the disasters whether natural or man-made come without warning and they take lives of hundreds and thousands of people [1]. The disasters also make communication increases among the people to contact family, friends in the disaster zones, and seek information about
Manuscript received January 8, 2013; revised February 7, 2013. This work was supported in part by SCOPE: Strategic Information and Communications R&D Promotion Program (Grant No. 122307004).
Thi Thi Zin is with the Graduate School of Engineering, Osaka City University, 3-3-138 Sugimoto, Sumiyoshi-ku, Osaka 558-8585, JAPAN, (corresponding Author, Tel: & Fax: 81-6-6605-3096, e-mail: [email protected]).
Pyke Tin was with University of Computer Studies, Yangon, Myanmar. He is now a visiting Professor with the Graduate School of Engineering, Osaka City University, JAPAN.
H. Hama was with the Graduate School of Engineering, Osaka City University, JAPAN. He is now in the Research Center for Industry Innovation, Osaka City University, JAPAN.
T. Toriu is with the Graduate School of Engineering, Osaka City University, JAPAN.
potential sources of food, shelter, transportation and many others. In recent disaster situations, online social networking platforms such as Facebook, Flickr, Twitter and YouTube have been played an important role in breaking news about the disasters. Millions of people can share information, knowledge through these social networks even they can ask for helps. Moreover the recent studies have shown that many social networking services can act and solve many problems during natural or man-made disasters [2]-[5]. During disasters almost all the conventional communications generally stop functioning at this time interval while social media or networking services stay active.
Thus, in real life situations, the information appeared on the various social networks could be considered as live network of monitoring active sensor systems for detecting world events such as earthquakes, tsunami, terrorist attacks and etc. [6]-[10]. Moreover, these social network systems can provide the needed resources to be connected for people recovered from disasters. During and after a disaster, there can be found that a variety of groups and individuals in the most of social network services, making discussions for situation awareness, emergency needs, and knowledge sharing among others. For example, when the earthquake struck in Japan on Friday of March 2011, millions of users were allowed to be able connect links and resources on social network sites such as global voices and an international community of bloggers in multiple languages.
According to recent study surveyed by the American Red Cross Society, the social networks such as Facebook, YouTube, MySpace, Flicker and Twitter were the most popular when nature strikes in various forms of disasters [11]-[13].These networks in three different situations: before, during and after events can be explored (i) to make preparations for a disaster, (ii) to communicate share and control the important information during a disaster, and (iii) to coordinate recovery processes after the disasters. In all situations, one of major concerns is to extract key and important events more accessible and meaningful from a user point of view.
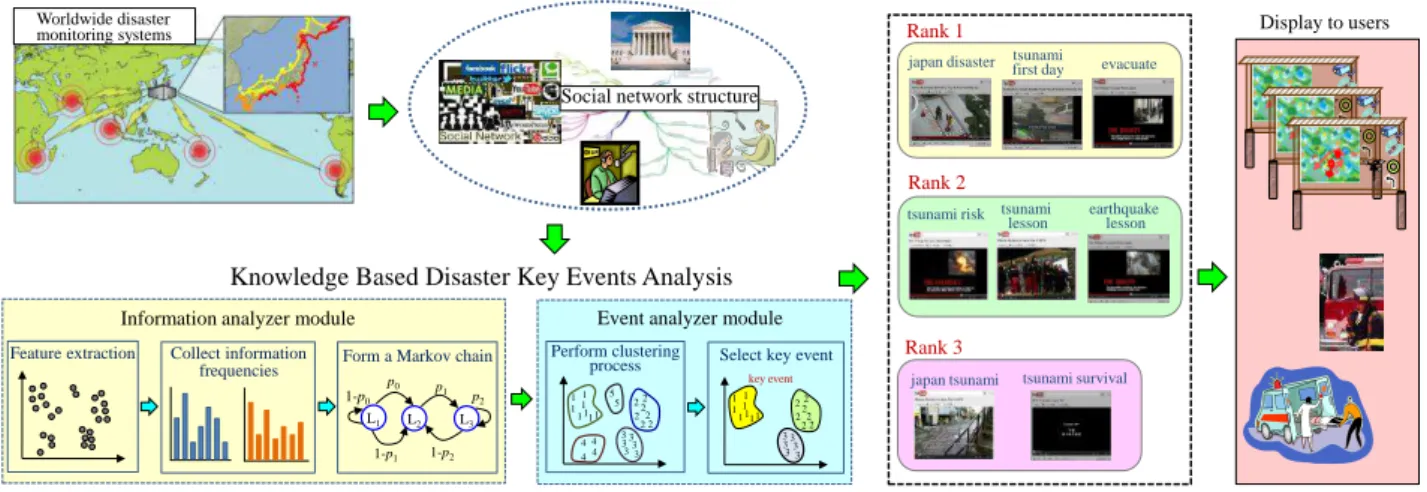
In this paper, a new knowledge based framework for extracting key and important disaster related events through the social networks is proposed. The illustration of the overall proposed system is shown in Fig. 1. The main contribution of this paper is a consideration of both contents and relational patterns of users in the social networks. It is observed that more people are involved in the same events than in different events. Thus an event can be detected by clustering people who make more interactions. Specifically the proposed framework is composed of two key functional processes: (i) detecting new events by generating temporal and spatial patterns for events, and (ii) extracting key events according to their importance.
Knowledge based Social Network Applications
to Disaster Event Analysis
Thi Thi Zin, Member, IAENG, Pyke Tin, Hiromitsu Hama and Takashi Toriu
Fig. 1.Overview of proposed method.
The rest of the paper is organized as follows. Section II presents some related works. The overview of the proposed disaster event analysis system in details is described in section III. The experimental results are presented in section IV followed by conclusions in section V.
II. RELATED WORKS
According to many research findings, the analysis of social media information has been played as essential and important role for measuring situational awareness with respect to time and space framework especially in the cases of a disaster [14], [15]. With ever increasing trends of social network data information, more and more research are required for effective ways of analyzing and extracting critical information (key events) from the situations concerned such as detecting missing people in an earthquake, searching critical areas after a tsunami, and so on. In this context, a substantial amount of research work has been done by various researchers to analyze events in disasters. However those existing social network methods are mainly based on micro blogs investigations in Twitter [16]-[19]. Usually they utilized some special types of messages concerning with warnings, damages, weather conditions. Based on the status messages and corresponding texts occurrences, those methods investigate the pattern of event trends by using statistical time series and linear regression analysis. Apart from text message based analysis, there have been a few research works on social networks applications by using visual information. In this direction, Flickr has taken a major role for detecting certain events in emergency cases since it is a valuable source of information for this purpose [20], [21]. Some researchers also have employed other online photo sharing platforms.
Both text-message and visual information based techniques have their own merits, advantages and disadvantages. It would be more effective if both concepts are combined together. The combined approach can lead an intelligent system to improve and overcome significant amount of disadvantages which we are facing in classical image retrieval contexts. The existing social media analysis for disaster related events are with either text-message based Twitter or visual information based only like Flickr or YouTube or Facebook, but not both together. A system that integrates both text and visual information is highly in demand. In an image retrieval context, hybrid keywords (text
+ image) based information search systems have been found in the literature [22], [23] but not in social network contexts. It would beneficial to employ such hybrid concept on social media platforms for analyzing events and sub-events in disasters. Therefore, in this paper, a combined framework of social networks is proposed for detecting and extracting critical, important and key events in disasters. Specifically the related text messages from Twitter and visual information from photo sharing platforms such as Flickr, YouTube and Facebook are fused by using our newly developed Markov chain based clustering principle and analyzed in details for extracting key and emergency information for user needs. Some related works for partitioning Markov chain states are found in [24], [25]. But they are different from the approach of this paper.
III. KNOWLEDGE BASED DISASTER KEY EVENTS ANALYSIS This section describes a knowledge based framework for detecting and analyzing key and critical events in disasters by using rich information from social network platforms along with Markov chain clustering and analyzing tools.
The proposed framework contains two major modules: (i) information analyzer module and (ii) event analyzer module. The functional processes of the two modules are described in Fig. 2. The tasks of the information analyzer module are to process and refine the raw information collected from specified social network platforms. In this paper, Twitter and YouTube information data will be used. The reason is that there are rich text information on Twitter while enough visual information on YouTube. Thus the proposed framework is designed in such a way that it can be applicable to during or after a disaster. The results returned via the information analyzer module are the basis for the next step, namely key event detection in event analyzer module. Then the key and critical events during a disaster are separated from other events in accordance to time or location.
For example, during a tsunami, in one place a woman may fall down while running, while at the same time in another location also a man gets out of the car and run away in the scene of tsunami waves. This separates an event into smaller key events in terms of location. After the identification of the key events, it is necessary to analyze them. This is performed via clustering and ranking of the resulting key events. The high rank key events are to be presented to the users for an overview of what is going on and what action can be taken.
Rank 2
tsunami lesson
earthquake lesson tsunami risk
Worldwide disaster monitoring systems
Social network structure
Collect information frequencies
Information analyzer module
Form a Markov chain
Event analyzer module
L1
1-p1 1-p2
p0 p1 1-p0
L2 L3
p2
Feature extraction Perform clustering
process Select key event
2 1 1
1 1
1 111 22
2 2 2 2 3 3 3 333
key event
2
4 5 1 1
1 1
1 111 22
2 2 2 2 3 3 3 333 4 4 4
5
Rank 1
evacuate tsunami first day japan disaster
Rank 3
japan tsunami tsunami survival
Display to users
Fig. 2.Functional processes of modules.
A. Information Analyzer Module
The information analyzer module first performs the tasks of extracting three different features of social network information such as location based feature, network based feature and content based feature. The location based feature contains the check-in history of users. The network based feature is concerned with social friendship activities information. The final feature consists of user actions, interactions and feedbacks about different places and different situational events. All these three features may vary in accordance to one timeline and formed six different interaction networks as seen in Table I.
By using the adopted feature networks, the number of text messages containing terms of interest are aggregated into hourly basis along with visual information containing the regions of interest.
Let us denote T(m, h) as the number of text messages which contains the term m and posted during the interval (h, h+1). The corresponding number of visual information containing image r is denoted by V(r, h). Then T(h) and V(h) respectively are defined as the total number of text messages and visual images posted during the same interval (h, h+1). Suppose m1,m2,,mkare the most frequent terms in the specified period determined empirically. Similarly, the most frequent images are denoted byr1,r2,,rk.
It can be noted that the most frequent text messages may not be one to one correspondent to the most frequent visual information. Therefore, the corresponding text messages and visual information are combined as pairs and denoted by
) , ( , ), , ( 1 1
1 m r el ml rl
e .
In order to reveal the key events, we first compute the distance measure dij between ei and ej as
) , ( ) ,
( i j i j
ij dist m m dist r r
d for i,j1,,l.
By using these distance measures, a Markov chain transition probability matrix P = [pij] is defined wherepij dij diand
j
ij
i d
d . The matrix P is also known as 1-step transition matrix which will be employed as an input to event analyzer module for detecting critical events in disaster.
TABLEI
INTERACTION NETWORK MATRIX Interaction
network Location Social network Content Location Location-Location Location-Social Location-Content Social
network Social-Social Social-Content
Content Content-Content
B. Event Analyzer Module
This module performs the clustering process of the most frequent text messages and visual information by establishing a Markov chain based clustering principles. In doing so, the system computes the n-step transition probability matrix
)] ( [pij n
n
P ,
where pij(n) denote n-step transition probability from state i
to state j for i,j1,,l.
According to Markov chain theory, it is known that For very large values of n,
All probability distributions are very close to each other. For small values of n,
The probability distribution of pairs of states from the same group will converge more quickly than those of pairs in different groups.
This fact reveals that for small value of n, the transition probabilities of Pn are higher within the groups and lower between the groups. Thus, a similar clustering principle could be adaptable as shown in definition 1.
Definition 1: Two combined information ei and ej are in the
same cluster if and only if
) 1 ( ) ( and ) 1 ( )
(n p n Th p n p n Th
pij ij ji ji
2 for n . This clustering principle enables us to regroup all frequent text messages and visual information into large clusters. Suppose C1,,Cm are the resultant clusters. Then the cooccurence matrix among these pairs of clusters are derived to form an embedded Markov chain with transition matrix
]. [qij
Q Here qij stand for the transition probabilities
obtained from the cooccurence matrix. By using the Form a Markov chain
Collect information frequencies
Visual information Text
information
Define distance measure
Derive one-step transition matrix
Information analyzer module
Form a Markov chain Feature extraction
Location based features (check-in history)
Network based features (friendship)
Content based features (actions and interactions)
Compute transition probabilities
Event analyzer module
Select key event Perform clustering process
Compute 2-step transition
matrix
Develop clustering principle
Group textual and visual information
into clusters
Compute co-occurrence matrix
between clusters
Compute Markov stationary
distribution
Choose high rank clusters
computational procedure of Markov chain theory, the stationary probability distribution [1,,m] can be calculated from the equationQ.
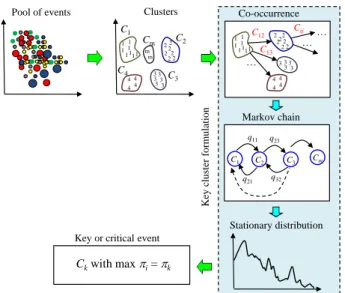
The cluster or sub-event with the maximum component in the stationary distribution will be defined as the key or critical event in the study. This process of key event extraction is shown in Fig. 3. Similar to the famous PageRank algorithm, the stationary distribution can be used for ranking the critical events according to their important. All these theoretical findings are tested and confirmed with the experimental results.
IV. EXPERIMENTAL RESULTS
In this section, some illustrative experimental results are presented to show effectiveness of the proposed framework by using the sampled text data from Twitter and visual data from YouTube during and after the Great East Japan Earthquake and Tsunami in 2011. According to the New Media Index from the Pew Research Center, starting with the minute of the earthquakes occurrence on Friday, 11March 2011, users posted more than 40.000 earthquake-related Tweets. For the one day, Friday, March 11, fully 66% of the news links on Twitter were about the Japanese earthquake and tsunami, according to the New Media Index from the Pew Research Center’s Project for Excellence in Journalism. For the entire week, March 7-11, 20% of the news links were on that subject, making it the No.1 story. Among these were messages like: “EARTHQUAKE!!!!!!!”,“Whoa!!!! Major quake shakes Japan - preliminary M7.8”, “JMA warns of tsunami, up to 6 meters off Miyagi coast”, “wow, that was a crazy earthquake... ran out of the building. 7.9 at epicenter”.
For the purpose of demonstration the sampled data posted on Twitter and You Tube from March 11, 2011 to March 25, 2011, two weeks period are used. The sample data are filtered using disaster related keywords such as (earthquake, people, evacuated early, building shake, and damage). At this point, it is important to note that while several earthquake topics are significant turns in Twitter, the event did not produce significant turns in Flickr and YouTube. This is probably due to fact that many people will write a quick message after a shock but it takes quite some time until images or videos are uploaded from cameras to Flickr and YouTube.
Fig. 3. Key event extraction process.
In this experiment, 8 pairs of visual and textual information from YouTube and Twitter are collected empirically. Fig. 4 shows the visual information and Table II presents the events formation with related textual messages. The corresponding frequencies are shown in Table III.
(i) (ii) (iii) (iv)
(v) (vi) (vii) (viii)
Fig. 4. Example of visual information.
TABLEII
EVENTS USING VISUAL AND TEXTUAL INFORMATION
Events Visual information(YouTube)
Textual information (Twitter) E1 Fig. 3 (i) Japan tsunami E2 Fig. 3 (ii) evacuate E3 Fig. 3 (iii) tsunami lesson E4 Fig. 3 (iv) earthquake lesson E5 Fig. 3 (v) tsunami risk E6 Fig. 3 (vi) tsunami first day E7 Fig. 3 (vii) Japan disaster E8 Fig. 6 (viii) tsunami survival
TABLEIII
FREQUENCIES OF PAIRS OF INFORMATION
Events E1 E2 E3 E4 E5 E6 E7 E8 YouTube 200 200 400 250 300 100 50 150 Twitter 1000 500 800 750 800 500 200 900
The distance function between two events is defined as: D(a,b)a2a1b2b1 .
This leads to one-step transition probability matrix P as follows:
P =
0 0.1587 0.1270 0.0952 0.0952 0.1905 0.3016 0.0318 0.1852 0 0.1852 0.1111 0.1482 0.0370 0.1667 0.1667 0.1290 0.1613 0 0.0645 0.0323 0.1936 0.3065 0.1129 0.1304 0.1304 0.0870 0 0.0435 0.1739 0.3261 0.1087 0.1250 0.1667 0.0417 0.0417 0 0.1667 0.3542 0.1042 0.2069 0.0345 0.2069 0.1379 0.1379 0 0.1207 0.1552 0.1863 0.0882 0.1863 0.1471 0.1667 0.0686 0 0.1569 0.0377 0.1698 0.1321 0.094 0.094 0.1698 0.3019 0
Squaring P, we obtain two-step transition probabilities P2 as follows:
P2 =
0.1669 0.0874 0.1414 0.1034 0.1113 0.0890 0.1627 0.1379 0.1019 0.1427 0.1001 0.0811 0.0771 0.1549 0.2561 0.0862 0.1437 0.0872 0.1653 0.1140 0.1274 0.0874 0.1557 0.1195 0.1416 0.0952 0.1536 0.1165 0.1231 0.0946 0.1569 0.1184 0.1461 0.0867 0.1646 0.1180 0.1316 0.0873 0.1434 0.1224 0.0967 0.1442 0.0934 0.0750 0.0722 0.1623 0.2722 0.0840 0.1005 0.1356 0.0946 0.0708 0.0675 0.1548 0.2906 0.0857 0.1640 0.0878 0.1397 0.1027 0.1109 0.0919 0.1648 0.1382
Ckwith max i= k
Key or critical event
Co-occurrence
2
4 m 1 1
1 1
1 111 22
2 2 2 2
3 3 3 333 4 4 4
m
Pool of events Clusters
C1
C2
C3
C4
Cm
1 1
1 1
1 111 2 2
2 2 2 2 2
3 3 3 3
3 4 4 4 4 C12
C13
Cij
C1
q21 q32
q11 q23
C2 C3 Cm
Markov chain
Stationary distribution
Ke
y
c
lust
er
for
mul
ati
By using P and P2, the threshold Thns , where )
1 ( ) 2 ( min pij pij
and ns is the number of states, it isobserved that
Th p
pij(2) ij(1) and pji(2)pji(1) Th
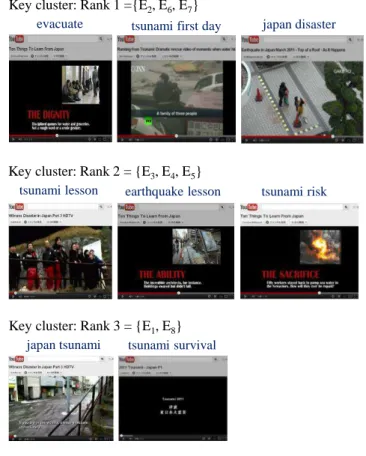
for i,j1,4,8. Therefore the key events are to be obtained by using the clustering principle giving the resultant clusters. The sample results are shown in Fig. 5 in order of their importance.
V. CONCLUSIONS
In this paper, a novel knowledge based approach to key event extraction from social networks for gathering situation awareness information in disasters has been proposed. The proposed framework has demonstrated its ability to provide useful situation awareness information by integrating two commonly used social networks Twitter and YouTube. It can therefore provide on-the-ground information for the persons concerned as reported in Twitter and YouTube to help establish and enhance timely situation awareness during and after a disaster. In future work, more experiments on large- scale datasets to evaluate the overall performance of the system would be focused. Moreover some additional external resources will be used to improve the performance of anomaly detection and classification. Finally, exploring the use of smoothing techniques to tackle the sparseness of social network information for better events and scenarios clustering will be included.
Fig. 5. Some sample results.
REFERENCES
[1] S. Baas, S. Ramasamy, J.D.D. Pryck, and F. Battista, Disaster risk
management systems analysis - A guide book, Environment and
Natural Resources Management, Environment and natural resources series, 13, 2008.
[2] A. Srikanth, Social media can solve many problems during natural
disasters,
http://infworm.com/social-mediacan-solve-many-problems-during-nat ural-disasters/
[3] K. Freberg, Crisis information curators & digital relief coordinators
via social media: Japan Tsunami catastrophe brief report 2011.
Presented to the National Center for Food Protection and Defense. Minneapolis, MN, 2011, May.
[4] D. Pohl, A. Bouchachia, and H. Hellwagner, “Automatic sub-event detection in emergency management using Social Media,” in Proc. of
First Intl. Workshop on Social Web for Disaster Management in conjunction with WWW 2012, Lyon, France, Apr. 17, 2012.
[5] N.J. Bailey, J.S. Bevington, H.G. Lewis, G.G. Swinerd, and P.M. Atkinson, “From Bunce field to Tunguska: hazard and disaster modelling at the University of Southampton,” 5thIntl. Workshop on Remote Sensing Applications to Natural Hazards, Washington DC,
USA, Sep. 10-11, 2007.
[6] A.D.P. Santos, L.K. Wives, and L.O. Alvares, “Location-based events detection on micro-blogs,” Computing Research Repositoryabs/ 1210.4008, 2012.
[7] T. Sakaki, M. Okazaki, and Y. Matsuo, “Earthquake shakes Twitter users: real-time event detection by social sensors,” in Proc. of the
19thIntl.Conf. on World Wide Web (WWW 10), New York, USA, pp.
851–860, 2010.
[8] R. Lee and K. Sumiya, “Measuring geographical regularities of crowd behaviors for twitter-based geo-social event detection,” in Proc. of the
2nd ACM SIGSPATIAL Intl. Workshop on Location Based Social Networks (LBSN 10), New York, USA, pp. 1–10, 2010.
[9] A. Iyengar, T. Finin, and A. Joshi, “Content-based prediction of temporal boundaries for events in twitter,” in Proc. of SocialCom/
PASSAT, pp.186–191, 2011.
[10] F. Samadzadegan, and H. Rastiveisi, “Automatic detection and classification of damaged buildings, using high resolution satellite imagery and vector data,” The International Archives of the
Photogrammetry, Remote Sensing and Spatial Information Sciences,
Beijing, China, vol. 37. Part B8, pp. 415-420, Jul. 2008.
[11] D. Velev and P. Zlateva, “Use of social media in natural disaster management,” Intl. Proc. of Economic Development and Research, Vol. 39, pp. 41–45, Jun. 2012.
[12] L. Palen, “Online social media in crisis events,” EDUCAUSE
Quarterly (EQ), vol. 31, no. 3, pp. 76–78, 2008.
[13] J. Chae, D. Thom, H. Bosch, Y. Jang, R. Maciejewski, D.S. Ebert, and T. Ertl, “Spatiotemporal social media analytics for abnormal event detection and examination using seasonal-trend decomposition,” IEEE
Conf. on Visual Analytics Science and Technology (VAST2012), pp.
143–152, Oct. 14-19, 2012.
[14] Jie Yin, A. Lampert, M. Cameron, B. Robinson, and R. Power, “Using social media to enhance emergency situation awareness,” IEEE
Intelligent Systems, vol. 27, no. 6, pp. 52–59, Nov. 2012.
[15] M. Steyvers, P. Smyth, M. Rosen-Zvi, and T.L. Griffiths, “Probabilistic author-topic models for information discovery,” Proc. of
the 10thACM SIGKDD Intl. Conf. on Knowledge discovery and data mining, pp. 306–315, 2004.
[16] A. Marcus, M.S. Bernstein, O. Badar, D.R. Karger, S. Madden, and R.C. Miller, “Twitinfo: aggregating and visualizing microblogs for event exploration,” Proc. of the SIGCHI Conf. on Human Factors in
Computing Systems (CHI 11), pp. 227–236, 2011.
[17] M. Mathioudakis and N. Koudas, “TwitterMonitor: trend detection
over the twitter stream,” in Proc. of the2010 ACM SIGMOD Intl. Conf.
on Management of Data, pp. 1155–1158, 2010.
[18] S. Vieweg, A.L. Hughes, K. Starbird, and L. Palen, “Microblogging during two natural hazard events: what twitter may contribute to situational awareness,” In Proc. of the SIGCHI Conf. on Human
Factors in Computing Systems (CHI 10), pp. 1079–1088, 2010. [19] R. Li, K.H. Lei, R. Khadiwala, and K.C.-C. Chang, “TEDAS: a Twitter
based event detection and analysis system,” IEEE 28thIntl. Conf. on Data Engineering (ICDE 2012), Apr. 1-5, 2012.
[20] T. Rattenbury, N. Good, and M. Naaman, “Towards automatic extraction of event and place semantics from Flickr tags,” In Proc. of
the 30thIntl. ACM SIGIR Conf. on Research and Development in Information Retrieval (SIGIR 07), New York, USA, pp. 103–110, 2007.
[21] S. Liu, L. Palen, J. Sutton, A. Hughes, and S. Vieweg, “In search of the bigger picture: the emergent role of on-line photo-sharing in times of Key cluster: Rank 1 ={E2, E6, E7}
evacuate tsunami first day japan disaster
Key cluster: Rank 2 = {E3, E4, E5}
tsunami lesson earthquake lesson tsunami risk
disaster,” In Proc .of the Information Systems for Crisis Response and
Management Conf. (ISCRAM 2008), 2008.
[22] B. Dinakaran, J. Annapurna, and C. A. Kumar, “Interactive image retrieval using text and image content,” Cybernetics and Information
Technologies, vol. 10, no. 3, pp. 20-30, 2010.
[23] H. Hama, Thi Thi Zin and Pyke Tin, “A hybrid ranking of link and popularity for novel search engine,” Intl. Journal of Innovative
Computing, Information and Control: Special Issue on Multimedia Processing and Network Technologies, vol. 5, no. 11(B), pp. 4041–
4049, Nov. 2009.
[24] F. McSherry, “Spectral partitioning of random graphs,” In IEEE
Symposium on Foundations of Computer Science, Las Vegas, USA, pp.
529–537, Oct. 14-17, 2001.