©2014 Science Publication
doi:10.3844/ajassp.2014.492.498 Published Online 11 (3) 2014 (http://www.thescipub.com/ajas.toc)
Corresponding Author:Rajakumar, M.P., Sathyabama University Chennai-119, Tamil Nadu, India
SECURITY BREACH IN TRADING
SYSTEM-COUNTERMEASURE USING IPTRACEBACK
1
Rajakumar, M.P. and
2V. Shanthi
1
Sathyabama University Chennai-119, Tamil Nadu, India 2St. Joseph’s College of Engineering Chennai-119, Tamil Nadu, India
Received 2013-12-18; Revised 2014-01-05; Accepted 2014-01-17
ABSTRACT
Recently, economic scenario is often facing security breach that has heavy impact on the financial soundness of a company particularly, stock prices on firms. The utmost consequence being the whole business comes to a standstill. From the estimates attributed by the financial sector, it has been inferred that the loss incurred on virus and worms attack is said to have the greatest impact that hampers the prosperity of a business entity. Thus, security strategies attempt on revolving around the act of security breach, thereby targeting to curb the financial losses of a company totally or at least minimize the losses. If the operating system of the stock market or financial sector gets corrupted the whole system need to be formatted, a new operating system has to be reinstalled and the antivirus software tends to be useless in such cases. In this study, virus and worms are encountered using IPTraceback technique and network security is ensured. The effective integration of spectral analysis, worm detection and IPTraceback, alerts the user dynamically and kills the source which distributes the virus. Real time traffic data are used for evaluating the performance.
Keywords: Virus and Worms Attack, Financial Sector, Security Strategy, IPTraceback
1.
INTRODUCTION
In today’s networked environment where the business is conducted electronically, security breaches have become frequent thereby information system risks tends to be the prime concern of the top level management. These concerns are due the fact that the consequence of security breach affects the financial position of the company. Types of security breaches include virus and worms attack, unauthorized access of information, theft of proprietary information, denial of service, sabotage and website defacement (Gordon et al., 2006).
A worm is a malicious software program that spreads from host to host on the internet. There have been situations where the worms spread entirely in a network and causing destructions which have been very high. A few cases of internet worm attack are as follows: Code-Red worm in 2001 (Moore et al., 2002), the Slammer worm in 2003 (Moore et al., 2003) and the Witty/Sasser worms in 2004 (Casado et al., 2005). All these worms
Rajakumar, M.P. and V. Shanthi / American Journal of Applied Sciences 11 (3): 492-498, 2014
random speed but still invade many systems, making them as stepping stones for further attacks.
Substantial financial loss has occurred due to virus attacks which seem to continue be the source of such mishappening. The unauthorized access is the second greatest source of financial loss following losses related to mobile hardware and theft of propriety. These four cyber-attacks account for more than 74% of financial losses (Gordon et al., 2006). The stock price impact of cyber attacks shows that the identified security breached firms suffer losses of 1-percentage to 5 percentage in the days immediately following a cyber attack, magnitudes the shareholder losses of 50 million dollar to 200 million dollar in New York stock exchange Corporation (Cashell et al., 2004). European companies have ranked computer risks as the prime reason for the drop of stock prices while US companies have ranked them as number two (Hovav and Arch, 2004).
There was a considerable decrease in stock prices of affected firms in the days after an attack (Campbell et al., 2003; Ettredge and Richardson, 2002; Garg et al., 2003; Carusoglu et al., 2004). It was determined that the drop in stock price was related to the type of attack with denial of service attacks generally having a smaller effect than attacks which compromised confidential information (Campbell et al., 2003; Garg et al., 2003). The magnitude of the drop in price of stock was correlated with manager’s assessments of the firm’s exposure to the risk of cyber attacks (Campbell et al., 2003). There was no significant correlation between the kind of attack and the magnitude of the effect of the stock price (Carusoglu et al., 2004).
The impact of security breaches on firm’s performance using matched-sample comparison analysis in the subsequent 4 quarters following the security breach was investigated (Ko and Dorantes, 2006). The result suggested that the breached firms return on assets decreased in the third quarter though there is no change in sales and net income. It also suggested that the performance of the control firms is better than the breached firms.
London Stock Exchange was attacked by a virus on February 2011. The stock exchange suffered a major unexplained outage for 4 h and produced inaccurate stock prices. The Russian Trading System (RTS) halted by a virus attack on February 2006. The virus arrived over the internet and attacked a computer connected to RTS. The infected computer generated tremendous amounts of false traffic and RTS was forced to cease trading for an hour.
It can be concluded that computer virus and worms cause tremendous financial losses to security breached companies especially stock exchange environment. Thus
security strategies attempt on revolving around the act of security breach, thereby targeting to curb the financial loss of a company totally or at least minimize the loss resulting from such a security breach. A security framework to curb the security breach consisting of assessing the risk involved, providing preventive measure to avert the breach and entailing the maintenance of an accepted level of risks was proposed (Gordon et al., 2003).
Tremendous financial losses haunt the trading sector thereby making the market come to a stanstill. Numerous traceback mechanism were proposed to safeguard from such threats and impediments. Viswanathan et al. (2012) discussed geographical division traceback for efficient IP traceback which combined the advantage of attack diagnosis/parallel attack diagnosis and directed graphical traceback. Another mechanism worked with the physical zone address to detect and proficient traceback the identity of attacker (Periyasamy and Duraiswamy, 2013). The present study explores the capability of solving the problem if the source node was found by IPTraceback and by killing or terminating the source node. The huge volume of traffic is also sorted by the spectrum based analysis as this checks the data traffic and also filters the virus free data from the infections or malicious data. IPTraceback technique can be used in stock exchange environment for security and also as a time redeeming factor. Because the more is the time taken for the resumption of the stock markets the more will be the loss. So large amount of loss can be saved by arresting rapid spread of the virus and worms to more number of systems.
1.1.
System Architecture
There are great efforts taken by attacker to conquer and rule the system. However these efforts are less shown onstage than what actually happens behind the screen. But once these efforts proven to be success then their propagation speed increases tremendously. The process of infecting system and the countermeasures along with their main functions for encountering virus and worms is shown in Fig. 1.
Fig. 1. System architecture
Once the information about the vulnerable computers in a network is obtained, this worm propagator immediately starts invading these computers and controls all their proceedings. If a computer in a network is infected and identified random scan then the worm propagator use this computer to perform more scans to invade and infect more systems in the network. In other words these infected computers become stepping stones for further attacks and damages caused in the network.
The worm propagator may use a static or dynamic worm to attack or invade computers in the network. In the recent studies it has been found that propagation of these dynamic worms in a network has been on the increase. These dynamic or smart worms as it has been called scan for vulnerable IP addresses in a network and once they identify them, they propagate at different speeds at a point of time. Propagation growth pattern for dynamic worm keeps changing from time to time whereas for static worms remains constant during the whole period of the propagation. For example in a five minute time the dynamic worm may hibernate for two minutes, the next minute it may propagate at a maximum speed possible and the last two minutes it may slow down its’ propagation speed. It is not possible to detect the dynamic worms and punish them for their malicious activities as they are dynamic. On the contrary, if the worm propagator opts to use a static worm, the chances
of being identified and killed are more. The reason is that the static worms have a constant behaviour that can be predicted easily and thereby punished for their activities. Since the propagation pattern of dynamic worm is not constant during the whole period, the speed increases in the later stage infecting more computers. The chances of them being detected is very difficult than that of the static worm.
1.2.
Countermeasures
Due to the extremely rapid spread and greatest destructive power of dynamic worms the elimination process is done by integrating spectrum analysis where the behaviour of propagation of worms is identified. Worm detector and the third method IPTraceback helps in tracing back the source IP address. IPTraceback is done at the later stages because unless the propagation of the worm is verified the final method is too costly to be implemented just to find out whether there is any worm propagation.
1.3. Spectrum Anlaysis
Rajakumar, M.P. and V. Shanthi / American Journal of Applied Sciences 11 (3): 492-498, 2014
is brought to existence. This spectrum based analysis restricts the propagation growth rate of a worm at the initial stage of propagation. The main purpose of using spectrum analysis is to extract high scale pattern or abnormal pattern called signal from the normal traffic signal called noise. The concept of spectrum analysis is widely used in digital signal processing (Allen and Mills, 2004). Even when the signal to noise ratio is low, spectrum analysis is mature enough to distinguish meaningful information from the unwanted signal. The execution process in a spectrum based analysis is as follows:
Step 1: Collect the time series data of scan traffic volume.
Step 2: Transform the time series data into frequency domain data
Step 3: Analyse the worm scan traffic data
Step 4: Use the Spectral Flatness Measure (SFM) (Yantorno et al., 2001) to measure the energy at a given time (If the data is in the form of time series use Power Spectrum Density measure to measure the energy). If the value of SFM is small it indicates that the worm is propagating on the network. In this case there will be a relatively abruptly change point in the network and strong low-frequency component in the frequency domain. If the value of SFM is large it indicates that there is no worm propagation on the network. In this case the background traffic volume has equal strength on all frequency components.
Step 5: Report to the data centre and alert the worm detector as a countermeasure to detect the worm.
Thus the spectrum based scheme enables detection and proves to be an ideal technique. Spectral analysis is done before IPTraceback because implementing IPTraceback frequently becomes very costly. Once the worm propagation in a network is identified, the spectrum based analysis immediately raises an alert to the user and reports to the data centre.
1.4. Worm Detector
Worm detector as the name signifies focuses on detecting worms over the network. Worm detector has two objectives similar to the worm propagator. The worm detector does all the reverse work the propagator does so that the propagator’s chance of invading the network becomes meagre. The first and the major work done by the worm detector is to minimize the number of systems that are being invaded by the propagator. The
second objective is to detect the propagator worm on the internet. The worm detector becomes useless if excessive numbers of false alarms are generated. The major function of worm detection is shown in Fig. 2.
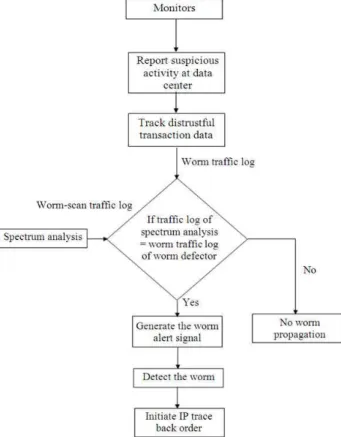
1.5. IPTraceback
The IPTraceback is the final countermeasure for punishing the malicious activities of the propagator. The IPTraceback is done immediately after the spectrum based analysis and worm detector identifies the propagation of a worm in a network and raises an alert. In the process of IPTraceback all the IP addresses involved are traced back. Since all the IP addresses are traced, the existence of routers and hosts which have been processing and forwarding the packets in the data are also traced. The source system which originally sent the file or packet is traced, identified and automatically terminated or killed. In other words the connection of the source with the other nodes is cut off in the network communication. The IPTraceback process is shown in Fig. 3.
Source attack elimination involves eliminating or killing the source propagator. Once the suspicious computers are listed and the source worm propagator is found the process of IPTraceback is complete. The source attack elimination is done immediately after the propagator is identified by the IPTraceback method. In source attack the malicious activities done by the source propagator is punished and the source is eliminated and further packet sent to or from that source is cut off. Now let us consider that the propagation growth pattern varies from very low to high and high frequency of scan traffic volume is observed. The log can identify traffic volumes from the stored set of traffic volumes:
Case 1: If the traffic volume set stored in the log = {TV1, TV2, TV3, TV4...TVN} and the traffic volume detected by the spectrum based analysis is TV2 then it is matched and the source propagator is identified almost immediately without any wastage of time and the source is killed.
Fig. 2. Process of worm detector
Fig. 3. IPTraceback
Rajakumar, M.P. and V. Shanthi / American Journal of Applied Sciences 11 (3): 492-498, 2014
2.
CONCLUSION
For the past few years there has been an increase regarding the information security breach and many incidents related to this have been recorded. As a result many organizations especially those firms which deal with financial issues and the stock prices are the worst sufferers. There has been a huge financial loss and it has been noted that this information security breach has become a prominent problem for many of the top level managers. It has been shown that the proposed technique will significantly reduce the attack of virus and worms on firms which handle large volume of data, increases the network security communication and finally eliminate the corruption of the operation system in a stock exchange environment. The IPTraceback is advantageous on the source from where the worm arrived can be found out and killed, thus providing secure communication without the risk of damaged or malicious data. The virus and worms encountered by IPTraceback is a promising direction that calls for the integration of spectral based method with a worm detector.
This research work has some limitations. False alarms may be generated continuously and propagation of worms may not be distinguished from the normal traffic being implemented if the threshold value is not proper. In this work the nodes and networks engaged are not too complex. They are experimented in a smaller scale whereas stock exchange and financial sectors are pretty wider area which involves numerous nodes and networks, ample transactions, handling large volume of data which seem to make the activities too complex to implement the project. But the idea enumerated in this work can be generated widely by integrating these ideas to make the work feasible. Further improvements can be done in various possible ways namely detecting the worms at their downloading stage, creating backups for the data centre and improving the spectral based analysis to a proper frequency and databases. It is worthwhile to look further into the micro structure activities at a personal level as well as the macro structure of activities done at a competitive level.
3.
REFERENCES
Allen, R.L. and D. Mills, 2004. Signal Analysis: Time, Frequency, Scale and Structure. 1st Edn., Wiley and Stones, ISBN-10: 0471234419, pp: 966.
Campbell, K., L.A. Gordon, M.P. Leob and L. Zhou, 2003. The economic cost of publicly announced information security breaches: Empirical evidence from the stock market. J. Comput. Security, 11: 431-448.
Carusoglu, H., B. Mishra and S. Raghunathan, 2004. The effect of internet security breach announcements on market value: Capital market reactions for breached firms and internet security developers. Int. J. Elect. Commerce, 9: 70-104.
Casado, M., T. Garfinkel, W. Cui, V. Paxon and S. Savage, 2005. Opportunistic measurement: Extracting insight from spurious traffic. Proceedings of the 4th ACM SIGCOMM Hotnets Workshop, (HW’ 05).
Cashell, B., W.D. Jackson, M. Jickling and B. Webel, 2004. The economic impact of cyber-attacks. CRS Report for Congress.
Chen, Z., L. Gao and K. Kwait, 2003. Modeling the spread of active worms. Proceedings of the 22nd Annual Joint Conference of the IEEE Computer and Communications, Mar. 30-Apr. 3, IEEE Xplore
Press, pp: 1890-1900. DOI:
10.1109/INFCOM.2003.1209211
Ettredge, M. and V.J. Richardson, 2002. Assessing the risk in E-commerce. Proceedings of the 35th Hawaii International Conference on System Sciences, Jan. 7-10, IEEE Xplore Press, pp: 01-11. DOI: 10.1109/HICSS.2002.994192
Garg, A., J. Curtis and H. Halper, 2003. Quantifying the financial impact of IT security breaches. Inform. Manage. Comput. Security, 11: 74-83. DOI: 10.1108/09685220310468646
Gordon, L.A., M.P. Leob and T. Sohail, 2003. A framework for using insurance for cyber-risk management. ACM Commun., 46: 81-85. DOI: 10.1145/636772.636774
Gordon, L.A., M.P. Leob, W. Lucyshyn and R. Richardson, 2006. CSI/FBI computer crime and security survey. Computer Security Institute. Hovav, A. and J.D. Arch, 2004. The impact of denial of
service attack announcements on the market value of firms. Inform. Syst. Security, 12: 32-40.
Ma, J., G.M. Voelker and S. Savage, 2005. Self-stopping worms. Proceedings of the ACM Workshop Rapid Malcode, Nov. 7-10, ACM Press, Alexandria, VA, USA., pp: 12-21. DOI: 10.1145/1103626.1103630 Moore, D., C. Shannon and K. Claffy, 2002. Code-Red:
A case study on the spread and victims of an internet worm. Proceedings of the 2nd ACM SIGCOMM Workshop on Internet Measurment, Nov. 6-8, ACM Press, Marseille, France, pp: 273-284. DOI: 10.1145/637201.637244
Moore, D., V. Paxon and S. Savage, 2003. Inside the slammer worm. IEEE Mag. Security Privacy, 4: 33-39. DOI: 10.1109/MSECP.2003.1219056
Periyasamy, S. and K. Duraiswamy, 2013. A proficient traceback approach using provincial locality aspects to eliminate denial of service attacks. J. Comput. Sci., 9: 271-276.DOI: 10.3844/jcssp.2013.271.276
Viswanathan, A., V. P. Arunachalam and S. Karthik, 2012. Geographical division traceback for distributed denial of service. J. Comput. Sci., 8: 216-221. DOI: 10.3844/jcssp.2012.216.221
Yantorno, R.E., K.R. Krishnamachari, J.M. Lovekin, D.S. Benincasa and S.J. Wenndt, 2001. The spectral autocorrelation peak valley ratio-a usable speech measure employed as a co-channel detection system. Proceedings of the IEEE International Workshop Intelligent Signal Processing (WISP’ 01).
Yu, W., N. Zhang, X. Fu and W. Zhao, 2010. Self-disciplinary worms and countermeasures: Modeling and analysis. IEEE Trans. Parallel Distrib. Syst., 21: 1501-1514. DOI: 10.1109/TPDS.2009.161