253
THE IMPACT OF FOREIGN DIRECT INVESTMENT ON ECONOMIC
GROWTH IN JORDAN
Basem Mohammed Louzi1 & Abeer Abadi2
1
Associate professor, Al-Balqa Applied University
2
Assistance professor, The World Islamic Sciences University
ABSTRACT
Foreign direct investment (FDI) is assumed to be benefiting a poor country like Jordan. Jordan offers attractive investment opportunities for foreign companies and has adopted a number of policies to attract foreign direct investment into the country. This paper focuses on the FDI-led growth hypothesis in the case of Jordan. The study is based on time series data from 1990 to 2009. The econometric framework of ciontegration and error correction mechanism was used to capture two way linkages between variables interest. An econometric result shows that FDI inflows do not exert an independent influence on economic growth. And also the impact of DIN and TP on GDP growth rate is found to be positive. Based upon these results the ultimate objective of the Jordan government is to attract FDI for development an appropriate policy mix is necessary to be taken in the future.
1. INTRODUCTION
Foreign direct investment (FDI) plays an important role in economic growth. the growth of international production is driven by economic and technological forces . It is also driven by the on going liberalization of foreign direct investment and trade policies . In this context, globalization offers an unprecedented opportunity for developing countries to achieve faster economic growth through trade and investment. In the period 1970s, international trade grew more rapidly than FDI, and thus international trade was by far than most other important international economic activities. This situation changed dramatically in the middle of the 1980s, when world FDI started to increase sharply. In this period, the world FDI has increased its importance by transferring technologies and establishing marketing and procuring networks for efficient production and sales internationally through FDI, foreign investor's benefits from utilizing their assets and resources efficiently, while FDI recipients benefits from acquiring technologies and from getting involved in international production and trade networks. While global FDI flows increased by 25% during 1991-2009, developing countries as a group show an FDI increase of 22% at constant prices (world developing report 2010). FDI flows to poor countries increased to almost 5% of GDP. However, FDI provides much needed resources to developing countries such as capital , technology , managerial skills , entrepreneurial a ability , brands , and access to markets . These are essential for developing countries to industrialize, develop, and create jobs attacking the poverty situation in their countries. As a result, most developing countries recognize the potential value of FDI and have liberalized their investment regimes and engaged in investment promotion activities to attract various. Globalization and regional integration arrangement can change the level and pattern of FDI and also it reduces the trade costs. However, FDI, flows to developing countries started to pick up in the mid-1990s largely as a result of progressive liberalization of FDI polices in most of these countries and the adoption of generally more outward-oriented policies.
2. OBJECTIVES OF THE STUDY
The main objective of the study is to analyze the impact of foreign direct investment on economic growth in Jordan. To achieve this objective the study first reviews the theoretical and empirical literature on the impact of FDI on economic growth in Jordan. According to the previous literature the FDI inflows have a positive impact on economic growth oh host countries. This paper focuses on the FDI – led growth hypothesis in the case of Jordan. Accordingly the main objectives are:
1- To consider the short run and long run relationship between FDI and economic growth. 2- To consider the perception of the civil society, and foreign from coward FDI.
3. LITERATURE REVIEW
Empirical evidence from different countries suggests that FDI plays an important role in contributing to economic growth. However, most studies generally indicate that the effect of FDI on growth depends on other factors such as the degree of complimentarily and substitution between domestic investment and FDI, and other country – specific characteristics.
254
growth of a country. That study found that economic growth can be significantly affected by foreign direct investment.
According to the study done by Pardeep Agrawal (2000) on economic impact of foreign direct investment in south Asia by under talking time -series , cross- section analysis of panel data from five south Asian countries , India , Pakistan , Bangladesh , Srilanka , and Nepal , that there exist complementarily and linkage effects between foreign and national investment . Further he argues that, the impact of FDI inflows on GDP growth rate is negative prior to 1980, mildly positive for early eighties and strongly positive over the late eighties and early nineties.
The result of the analysis carried out by Archanun kohpaiboon(2008) on the impact of FDI on growth performance in investment receiving countries through a case study at Thailand for the period 1920 – 2000, shows that the growth impact of FDI tends to be greater an export promotion trade regime compared to an import substitution regime. Li and Liu (2005), by using a single equation and simultaneous equation techniques, examined the relationship between FDI and economic growth on a panel of data for 84 countries for the period 1970 – 1999, and found a positive impact of FDI on economic growth through its interaction with human capital in developing countries, but a negative impact of FDI on economic growth through its interaction with the technology gap.
Getinet and Hirut (2006) studied the nature and determinants of foreign direct investment in Ethiopia over the period 1974-2001. The study gives an extensive account of the theoretical explanation of FDI as well as reviewing the policy regimes, the FDI regulatory framework and institutional set up in the country over the study period. It also undertakes empirical analysis to establish the determining factors of FDI in Ethiopia. This paper findings show that growth rate of real GDP, export orientation, and liberalization, among others, have positive impact on FDI. On the other hand, macro economic instability and poor infrastructure have negative impact on FDI. These findings imply that liberalization of the trade and regulatory regimes, stable macroeconomic and political environment, and major improvement in infrastructure are essential to attract FDI to Ethiopia.
Al – Ahdulrazaq and Bataineh (2007) employed Box-Jenkins methodology, namely, Autoregressive Integrated Moving Average (ARIMA) model to forecast foreign direct investment inflows into Jordan over the period 2004-2005. That study showed that foreign direct investment witnessed an increasing trend over the forecasted period 2004-2005. Also, it expected a positive impact of foreign direct investment inflows on the different macroeconomic variables in the economy of Jordan. However, no consensus has yet been reached on the steady state as well as dynamic effects of FDI on growth. While some studies argue that the impact of FDI on growth is highly heterogeneous across countries with relatively open economies showing statistically significant results, the other studies maintains that the direction of causality between the two variables depends on the recipient country's trade regime. However, most studies don’t pay any serious attention to the possibility of a bi-directional link between the two variables in reference.
4. RESEARCH METHODOLOGY
There have been many studies with different specification regarding the relationship between FDI and the growth of gross domestic product. In order to capture the basic relationship between FDI and output growth a simple production function were used, but add several slight difference variables. The starting point of model formulation is;
Y
f
A
,
FDI
,
K
Where
Y
is out put; Gross Domestic product (GDP), andK
is capital stock. The variableA
captures the total factor productivity of growth in output not accounting for increasing in factor input
K
,
L
,
andK
. The effect of trade liberalization on economic growth is operating through total export and import and GDP (TP).
Y
f
FDI
,
DIN
,
TP
Available data series on capital stock is not available. As a result in most studies, ratio of the gross fixed domestic investment to GDP is employed as a proxy variable represent
K
. In this study the researcher employed the gross domestic investment except FDI as a proxy variable forK
. As the research is studying the impact of FDI inflows on economic growth, the research consider the nationally owned investment defined as gross fixed domestic investment minus the net FDI inflows and FDI as different variables.Accordingly, the estimating equation used in this study is:
GDP
B
FDI
B1DIN
B2TP
B3U
0
Where
GDP
= gross domestic product (in log form).
FDI
= foreign direct investment (in percentage form).DIN
= domestic investment (in log form).255
U
= stochastic error term.The coefficients
B
1andB
2are the out put elasticity with respect toFDI
andDIN
. The impact ofFDI
on growth
Y
is given byB
1. Note that the coefficient,B
1, of this variable should be equal to the coefficient,B
2, ofDIN
ifFDI
is just as efficient in promoting GDP growth as nationally owned investment. If the greater technology, human capital or exporting capabilities of FDI make it more efficient in promoting growth the co-efficient,B
1, can beexpected to be greater than the coefficient,
B
2, On the other hand, ifFDI
takes excessive profits out of the countrywithout contributing much in terms of technology etc, the co-efficient,
B
1, should be smaller than thecoefficient,
B
2.The model includes the log of the real
GDP
, realFDI
, realDIN
, and trade liberalization , various procedures have been suggested for determining the appropriate lag length in a dynamic model. The adjusted R2 is one possibility. Other includes the AKaiKe (1973) Information Criterion (AIC) and Schwartz's criterion (SC). The research used above two critererias to select the appropriate lag length for this study. Basic structure of VAR is as following:
4 3 2 1
Z
Z
Z
Z
Zt
=
alization
TradeLiber
vestment
DomasticIn
ent
ectInvestm
ForeignDir
oduct
ic
GrossDoast
Pr
Zt
t
Zt
i
Zt
Ut
n
i
i
1
1
This gives the long-run and short-run dynamic of a group of integrated variables.
Zt
is a vector ofI
i
variables;Ut
is a vector of white noise residual, and
is a constant vector. The adjustments to disequilibrium are captured over n lagged period in the coefficient matrixt
i, this part of the ECM represent a traditional vector auto regressionof the differenced variables. The
Zt
1
terms represent long-run equilibrium or co integrating relationship and the coefficient matrix can be decomposed into
B
matrix. A procedure developed by Johansen (1991) provides a means to investigate the co integrating relationship between integrated series. The Johansen test was used to determine the co integrating rank. Obviously, for a long- run relationship to exist, at-least the first column must contain non- zero elements. If more than one linear combination occurs, we can normalize and combine them to investigate pair - wise effects between the variables. This co integrating relationship represents the foundation of a complete dynamic error correction model. For this paper, the ECM and co integrating relationship allows the researcher to compare the immediate and overall effects and then, the model will show how fast adjustments occur. Third, we interpret the co integrating relations and test for weak exogeneity. Based on these result a vector error correction model (VECM) of the endogenous variables is specified.The model is estimated using annual data for the period 1990-2009. Data on gross domestic product (GDP), domestic investment (DIN) export and import are obtained from the Central Bank of Jordan (CBJ). Data to investigate of perception of civil society and foreign firms were collected by interviewing company representative and various people who lived in and around Qualified Industrial Zone (OIZ).
5. ECONOMIC RESULT
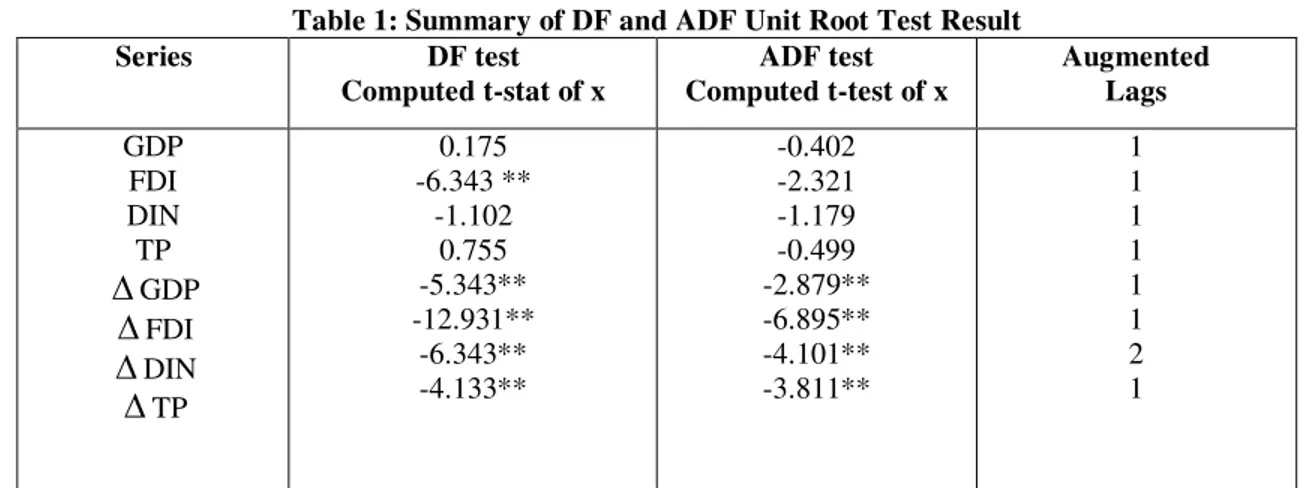
Using the Dickey - Fuller (DF) test and the Augmented - Fuller (ADF) test for a unit root, the stationary of each series was checked. The DF and ADF results for the four series involved in the equation are presented in Table (1). The result shows that all variables exhibit integrated order one. This means that the series are non- stationary in level but stationary in first – differences. The implication is that there is a possibility to have a co integrating vector whose coefficient can directly be interpreted as long-term equilibrium. Therefore, as next step, Johansen trace test is used to check whether we have a co integration relationship. Result of the trace test is reported in Table 2 which gives the number of co integration vectors. According to the Table 2, we can reject the null hypothesis that no co integration exists but fails to reject a hypothesis of more than one stationary linear combination. The implied co integration relationship is obtained from first row of the standardized beta eigenvector.
256
Table 1: Summary of DF and ADF Unit Root Test Result
Series DF test
Computed t-stat of x
ADF test Computed t-test of x
Augmented Lags GDP
FDI DIN TP
GDP
FDI
DIN
TP0.175 -6.343 **
-1.102 0.755 -5.343** -12.931**
-6.343** -4.133**
-0.402 -2.321 -1.179 -0.499 -2.879** -6.895** -4.101** -3.811**
1 1 1 1 1 1 2 1
Notes: ** denotes rejection of null hypothesis at a 5% level of significance. It is interpreted as the GDP;
Table 2: Test of co integration among variables
A constant with the co integration vector No constant in the co integ.
R T Critical values D T Critical
values
D r = 0
r < 1 r < 2 r < 3
91.553 51.532 17.931 7.932
76.66 52.82 33.81 19.95
R F F F
73.122 33.221 8.442 0.005
67.63 46.23 28.29 3.83
R F F F
The number of co integration vectors (r) is tested using the trace with the constant within and outside the co integration vectors. The test statistic (T) is the calculated trace test, associated with the number of co integration vectors. The critical values are taken under 5% level. The column labeled "D" gives our decision or rejects (R) or fail to reject (F), at a 5 per cent level of significance, the null hypothesis of the number of co integration vectors. The correction model provides a generalization of the partial adjustment model and permits the estimation of short-run and long-short-run elasticities. This long-short-run association would show us the elasticites of GDP with respect to FDI, DIN and TP. According to the result, at 1 per cent the increase FDI result in a 0.155 percentage increase in GDP but this variable is not significantly different from zero. If the level of DIN, goes up 1 percent GDP increase by 0.932 a percentage point. For TP, the result is a 0.102 percent increase in GDP. Although the co-efficient of FDI is not significance, the co-efficient of DIN and TP are significantly different from zero. Here the magnitude of TP implies very inelastic with respect GDP. In order to appropriately model the full dynamic behavior of GDP, the researcher needs to the incorporate short-run adjustment factors along with the co integration equilibrium relationship. This is best done using the error correction model technique introduced above. In this research there is only one stationary linear combination of the four integrated variables. The simplified ECM for two lags period.
Vt
Ut
i
Zt
Zt
n
i
i
1
1
Where n = 2
257
Table 3: Error correction model representation
Notes: * denotes rejection of null hypothesis at least than 5% level of sign.
The two most important equations in error correction model are those containing
DIN and
TP as dependent variables. The other two indicate a small relationship. It's clear from table 3 that 11 percent of the GDP response to disequilibrium occurs within the immediate period after a shock, and around 61 percent of the domestic investment response occurs within this period. The short-run elasticity with respect to DIN is 0.61. The second equation highlights the impact that GDP, DIN, and TP can have no foreign direct investment. Accordingly total elasticity of GDP in relation to the FDI is 3.821 and elasticity of DIN in relation to the TP is 6.117. Almost all estimated regression in this third equation is significance.The regressors in this model explain about 50 percent of the variation in the dependent variable, and autocorrelation in the residuals is not a problem as its value is almost equal to two.
6. CONCLUSION
This paper has examined the relationship between FDI and GDP using time series data from the Jordanian economy. In Jordan FDI has increased dramatically since the 1985. Many studies find a positive link between FDI and growth. But econometric result shows that FDI inflows do not exert an independent influence on economic growth. And also the direction of causation is not towards from FDI to GDP growth but GDP growth to FDI. That is the direction growth impact of FDI on the Jordanian economy has not existed so far. The impact of DIN and TP on GDP growth rate is found to be positive.
Net attitude of the civil society and foreign firm to wards FDI in the country is positive. Net attitude reveals that the investment climate has improved in Jordan as a result of; political stability and the implied policy stability, good developed infrastructure facilities and high levels of human capital. The importance of FDI can't be over stated. As a result, the investment climate in the country must be improved more through appropriate measures such as creating more transparency in the trade policy and more flexible labor markets and setting a suitable regulatory framework and tariff structure. Currently Jordan provides an attractive investment regime due to the financial crisis, but the response from the investor has not been very encouraging. If the ultimate objective of the government is to attract FDI for development an appropriate policy mix is necessary to achieve these.
Dependent variable
Independent GDPt FDIt DINt TPt
GDPt
GDPt-1
GDPt-2
FDIt
FDIt-1
FDI t-2
DIN t
DIN t-1
DIN t-2
TPt
TPt-1
TPt-2Ut-1 2
R
DW
0.117(0.554) -0.129(-0.766)
0.114(0.473) -0.041(-1.211)
0.001(0.024) 0.611(-4.170)*
0.251(1.377) -0.002(-0.017)
0.704(4.700)* -0.276(-1.227) 0.002(0.021) -0.111(3.333)*
0.507 1.872
3.821(4.713)* -1.732(-1.411) 1.221(1.252)
0.516(2.751) -0.027(-0.188) 5.704(24.681)* -3.005(-2.773) 0.169(0.176) 6.117(-344.380)*
3.131(2.776) -0.167(-0.177)
-0.001(0.107) 0.30 1.955
0.601(-4.171)* 0.324(1.734) -0.214(-1.163) 0.159(42.677)* -0.095(-3.111)* 0.004(-3.111)*
0.532(3.051)* -0.031(-0.211) 1.028(44.211)* -0.492(-3.144)* 0.032(0.215) -0.200(2.887)*
0.511 1.971
0.613(4.7800)* -0.301(-1.500)
0.211(1.291) -0.161(-351.381)*
0.084(2.874) -0.004(-0.216) 0.941(44.231)*
-0.487(-2.807) 0.031(-2.731)
0.432(2.805) -0.031(-0.211) 0.201(-3.051)*
258
7. REFERENCES
[1] Ali, A.Bolbol and M. Fatheldin, 2005. “Arab exports and direct investment: an empirical analysis”. Arab Monetary Fund, Abu Dhabi.
[2] UNCTAD, World Invest Report, 2008.
[3] Kumar, S. and Pant, M, 2004. “Incentives for attracting FDI in South Asia: a Survey”. Paper presented at UNCTAD Virtual Institute, Annual Meeting, Geneva.
[4] Escribano, G. and V. Alejandro, 2007. “Economic reform in the Magreb: from stabilization to modernization. Working paper. Madrid: Elcano Royal Institute.
[5] Government of Jordan, Ministry of Industry and Trade, 2006. Trade Liberalization Agreement. Digital documents available at www.gov.jo (in Arabic).
[6] UNCTAD, 2006. “FDI from developing and transition economies: Implications for development. World Investment Report. Digital document available at http://www.uncotd.org/en/docs/wir.
[7] M, Metwally, 2004. “Impact of EU FDI on economic growth in Middle Eastern Countries”. European Business Review, vol. 16, iss: 4, pp. 381-389.
[8] Bashier, A, 2007. “the causal relationship between foreign direct investment and savings in Jordan: an Error correction Model”. International Management Review, vol. 3, No.4, pp. 13-16.
[9] Husni, K. and W. Siam, 2010. “Determinants of direct foreign investment: Evidence from Jordan”. BEH-Business and Economic Horizons, vol. 1, iss: 1, pp. 69-71.
[10] Central Bank of Jordan (CBJ), (2010), Annual reports (2000-2010), Amman, Jordan.
[11] Department of Statistics (DOS) (2010), Annual reports (2000-2010), Amman, Jordan.
[12] Giovanni, S. 2001. “Measuring the effect of globalization on labor demand elasticity: An empirical application to OECD countries”. Universita Bo econi, Milano.
[13] Bruce, A. and M. Slanghter, 2001. “Foreign-affiliate activity and US skill upgrading. The Rev. Econom., No. 83, pp. 364-367.