Chemotaxis Network
Abdullah Hamadeh1,2, Mark A. J. Roberts1,2,3, Elias August1,2, Patrick E. McSharry2,4, Philip K. Maini2,5, Judith P. Armitage2,3, Antonis Papachristodoulou1,2*
1Department of Engineering Science, University of Oxford, Oxford, United Kingdom,2Oxford Centre for Integrative Systems Biology, Department of Biochemistry, Oxford, United Kingdom,3Department of Biochemistry, University of Oxford, Oxford, United Kingdom,4Mathematical Institute, University of Oxford, Oxford, United Kingdom,5Centre for Mathematical Biology, Mathematical Institute, University of Oxford, Oxford, United Kingdom
Abstract
Bacteria move towards favourable and away from toxic environments by changing their swimming pattern. This response is regulated by the chemotaxis signalling pathway, which has an important feature: it uses feedback to ‘reset’ (adapt) the bacterial sensing ability, which allows the bacteria to sense a range of background environmental changes. The role of this feedback has been studied extensively in the simple chemotaxis pathway ofEscherichia coli. However it has been recently found that the majority of bacteria have multiple chemotaxis homologues of theE. coliproteins, resulting in more complex pathways. In this paper we investigate the configuration and role of feedback in Rhodobacter sphaeroides, a bacterium containing multiple homologues of the chemotaxis proteins found inE. coli. Multiple proteins could produce different possible feedback configurations, each having different chemotactic performance qualities and levels of robustness to variations and uncertainties in biological parameters and to intracellular noise. We develop four models corresponding to different feedback configurations. Using a series of carefully designed experiments we discriminate between these models and invalidate three of them. When these models are examined in terms of robustness to noise and parametric uncertainties, we find that the non-invalidated model is superior to the others. Moreover, it has a ‘cascade control’ feedback architecture which is used extensively in engineering to improve system performance, including robustness. Given that the majority of bacteria are known to have multiple chemotaxis pathways, in this paper we show that some feedback architectures allow them to have better performance than others. In particular, cascade control may be an important feature in achieving robust functionality in more complex signalling pathways and in improving their performance.
Citation:Hamadeh A, Roberts MAJ, August E, McSharry PE, Maini PK, et al. (2011) Feedback Control Architecture and the Bacterial Chemotaxis Network. PLoS Comput Biol 7(5): e1001130. doi:10.1371/journal.pcbi.1001130
Editor:Jason M. Haugh, North Carolina State University, United States of America
ReceivedAugust 12, 2010;AcceptedApril 1, 2011;PublishedMay 5, 2011
Copyright:ß2011 Hamadeh et al. This is an open-access article distributed under the terms of the Creative Commons Attribution License, which permits unrestricted use, distribution, and reproduction in any medium, provided the original author and source are credited.
Funding:This work was funded by the EPSRC [www.epsrc.ac.uk], project E05708X. PKM was partially supported by a Royal Society-Wolfson Merit Award. The funders had no role in study design, data collection and analysis, decision to publish, or preparation of the manuscript.
Competing Interests:The authors have declared that no competing interests exist. * E-mail: [email protected]
Introduction
Living organisms respond to changes in their internal and external environment in order to survive. The sensing, signalling and response mechanisms often consist of complicated pathways the dynamical behaviour of which is often difficult to understand without mathematical models [1]. Considering the structure and dynamics of these signalling pathways as integrated dynamical systems can help us understand how the pathway architecture and parameter values result in the performance and robustness in the response dynamics [2].
One extensively studied sensory pathway is bacterial chemo-taxis. This pathway controls changes in bacterial motion in response to environmental stimuli, biasing movement towards regions of higher concentration of beneficial or lower concentra-tion of toxic chemicals. The chemotaxis signalling pathway in the bacterium Escherichia coliis a simple network with one feedback loop [3] which has been extensively studied and used as a paradigm for the mechanism of chemotaxis signalling networks [4]. In E. coli, chemical ligands bind to methyl-accepting chemotaxis protein (MCP) receptors that span the cell membrane and alter the activity of a cytoplasmic histidine kinase called CheA.
When attractant ligands stimulate the chemotaxis pathway by binding to MCP, there is a decrease in the autophosphorylation rate of CheA; conversely, repellent binding or lack of attractant binding increase CheA autophosphorylation activity. CheA, when phosphorylated, can transfer the phosphoryl group to two possible response regulators: CheY and CheB. CheY-P (where ‘-P’ denotes phosphorylation) interacts with FliM in the multipleE. coliflagellar motors resulting in a change in the direction of rotation of the motor. At the same time, a negative feedback loop allows the system to sense temporal gradients and react to a wide ligand concentration range: the MCP receptors, which are constantly methylated by the action of a methyltransferase CheR, are de-methylated by CheB-P. This negative feedback loop restores the CheA autophosphorylation rate and the flagellar activity to the pre-stimulus equilibrium state [5,6].
Many species have chemotaxis pathways that are much more complicated than that of E. coli [10,11], either containing chemotaxis proteins not found inE. coli, e.g. in the case ofBacillus subtilis [12]; or containing multiple homologues of the proteins found in theE. colipathway, as in the case ofRhodobacter sphaeroides [11,13]. Furthermore, in R. sphaeroides there are two receptor clusters containing sensory proteins which localize to different parts of the cell, one located at the cell pole and the other in the cytoplasm [14]. Although the purpose of the two clusters is unclear,in vitrophosphotransfer experiments [15,16] show that the CheA homologues located at the two clusters can phosphotransfer to different CheY and CheB homologues: at the cell pole CheA2-P phosphotransfers to CheY3, CheY4, CheY6, CheB1and CheB2, while at the cytoplasm CheA3A4-P phosphotransfers to CheY6and CheB2. The two methylesterase proteins, CheB1 and CheB2, which are homologues of CheB inE. coli, are responsible for the adaptation mechanism in R. sphaeroides [13,17]. Past localization studies have shown that CheB1 and CheB2 are found diffuse throughout the cytoplasm [14]. This is different toE. coliwhere the CheB protein is localized at the cell pole, and could potentially mean that the two proteins de-methylate either receptor cluster [14].
As a system featuring an adaptation mechanism similar to that inE. coli, but with multiple homologues of theE. colichemotaxis proteins, it is useful to examine the R. sphaeroides chemotaxis pathway from a control engineering perspective. In this way, we can suggest structures for the R. sphaeroides chemotaxis pathway that integrate the control mechanisms thought to be responsible for adaptation in E. coli along with the possible feedback architectures that arise from the dual sensory modules present in R. sphaeroides. The relative evolutionary advantages of the different architectures can then be compared from both control engineering and biological points of view. The fact that there are two endogenous ‘measurements’ available to the feedback mechanism (CheB1-P and CheB2-P) which can be used to regulate two signals (CheA2 and CheA3A4) makes the whole chemotaxis feedback pathway a multi-input, multi-output control system (as opposed to possessing only one CheB and one CheA as in theE. colimodels
[7,18]). This introduces extra degrees of freedom in the feedback control mechanism of the system and, thus, the potential for better regulation.
However, the different conceivable connectivity configurations between the two CheB-P proteins and the two receptor clusters actually correspond to different feedback control architectures, each with different properties. Some of these configurations, as will be demonstrated, could allow the bacterium to integrate information from both internal and external sources and to function more efficiently, e.g., by varying how strongly it reacts to external attractants depending on its internal state. At the same time, the additional receptor cluster not found inE. coli has the potential of introducing extra sources of performance degradation such as noise (both intrinsic and extrinsic) and variations in quantities internal to the cell such as protein copy numbers and phosphorylation rates: the feedback signalling pathway may be required to remedy this, and in this regard, some of these feedback architectures perform better than others.
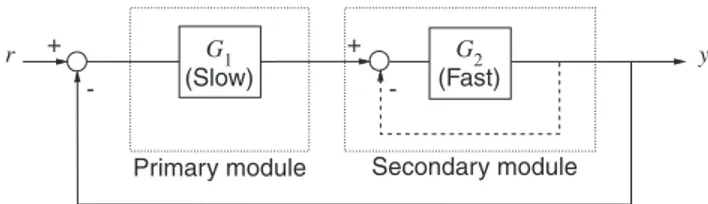
One of the different pathway configurations that is possible in this system has similarities to a feedback architecture commonly found in engineering control systems termed cascade control[19], which is usually employed when the process to be controlled can be split into a slow ‘primary’ sub-process (G1in Figure 1) and a faster, secondary sub-process (G2in Figure 1). Without the internal feedback shown dashed in Figure 1 the primary module maintains a set-point for the secondary module to follow and the output of the secondary module is fed back to the primary. A cascade control design places an additional feedback loop around the fast secondary process (shown dashed). This has been known to improve system performance in several ways: it reduces the sensitivity of the output of the secondary module to changes in the parameters (thus improving robustness), it attenuates the effects of disturbance signals, it makes the step response of the control system to inputs and disturbances less oscillatory and, since the secondary process is relatively fast, the effects of unwanted disturbances are corrected before they affect the system output. Including this additional internal feedback also allows the control system designer more flexibility in increasing the feedback gain to achieve higher bandwidth and faster system responses without losing stability. In fact, cascade control is employed as a design principle in several engineering systems such as aircraft pitch control and industrial heat exchangers (see Text S1 for further details).
In our previous work [20], we used a model invalidation technique to arrive at a possible pathway architecture that allows the R. sphaeroides chemotaxis system to convey, via a signalling cascade, sensed changes in ligand concentration outside the cell to the flagellar motor. In that model, proteins CheY3-P and CheY4-P act together to promote autophosphorylation of CheA3A4 (schematically illustrated in Figure 2(A)) whilst CheY6-P binds
Figure 1. A cascade control system. The subsystem G1 is slow
relative toG2. Cascade control involves placing a negative feedback
loop (dashed line) around the fast secondary module. This scheme helps reduce the sensitivity of the system’s output to uncertainties in the subsystemsG1andG2.
doi:10.1371/journal.pcbi.1001130.g001 Author Summary
with the FliM rotor switch to increase the frequency of motor switching (and hence reduce the motor rotation frequency). This stimulation of CheA3A4need not be a direct interaction [20].
In this paper, we assume that the chemotaxis pathway has the same forward signalling pathway of [20] and then suggest four plausible interconnection structures for the feedback pathway between the two CheB-P proteins and the two receptor clusters. Following this, we present the results of experiments that are used to invalidate all but one of these structures. We then discuss the results ofin silicoexperiments that highlight the differences in chemotactic performance between the different models with particular focus on the robustness of chemotaxis to parametric variations in the chemotaxis pathway and noise [21,22]. Using analytical techniques from control theory, we demonstrate that the model not invalidated by our experiments is structurally similar to the cascade control
architecture, and we use the structural properties of this interconnection, which are commonly used to reduce the effects of uncertainty and disturbances in various engineering applications, to explain the robustness features of the suggested model.
Results
Chemotaxis model creation
Given the structure of the forward path of the chemotaxis pathway from [20], illustrated in Figure 2(A), and given the rates previously measured in [15,16] for the phosphotransfer reactions also shown in Figure 2(A), we constructed a generic ordinary differential equation model of the R. sphaeroides chemotaxis pathway, detailed in Materials and Methods. With this forward signalling pathway, the model makes the following assumptions:
Figure 2. Chemotaxis inR. sphaeroides.(A) The chemotaxis pathway inR. sphaeroidesas currently understood, including the forward chemotaxis pathway previously proposed [20]. MCP: transmembrane methyl accepting chemotaxis protein, Tlp: cytoplasmic methyl accepting chemotaxis protein, A: CheA histidine protein kinase, W: CheW a linker protein between receptors and CheA, Y: the response regulator CheY, B: the response regulator CheB, R: the methyltransferase CheR. P indicates a phosphoryl group. The number in subscript denotes one of the multiple homologues in
R. sphaeroides. The flagella motor is shown at the right of the figure. (B) The possible de-methylation feedback structures for the phosphorylated proteins CheB1-P and CheB2-P inR. sphaeroides. Each possible connection is denoted by a (red) thick solid, dashed or dotted line. Possible models
involve combinations of these four lines. Interactions from the phosphotransfer network are shown in (black) thin dashed arrows, receptor activation/ de-activation is denoted by (black) thin solid lines.
N
Polar and cytoplasmic cluster receptors are either methylated or un-methylated.N
Only a subset of methylated receptors is active, as in [23].N
CheR2/CheR3 act to methylate inactive receptors whilstproteins CheB1-P/CheB2-P de-methylate active polar and cytoplasmic receptors with unknown connectivity, as in [23].
N
A sensed increase in ligand concentration causes a reduction in the number of active receptors.N
Active polar and cytoplasmic receptors promote the auto-phosphorylation of CheA2and CheA3A4respectively.N
CheY3-P and CheY4-P act together to promote autopho-sphorylation of CheA3A4(Figure 3) whilst CheY6-P binds the FliM rotor switch to increase the frequency of motor switching.N
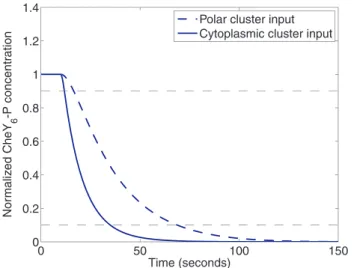
Through the phosphotransfer network, a decrease in the number of active receptors due to a sensed increase in ligand concentration results in a subsequent decrease in the amount of CheY3-P, CheY4-P, CheY6-P, CheB1-P and CheB2-P.One effect of a sensed increase in ligand concentration is a decrease in the flagellar switching frequency due to decreased amounts of CheY6-P binding with FliM. Figure 3 shows the result of a simulation of the signalling pathway that demonstrates the fall in the concentration of CheY6-P in response to a step decrease in the number of active receptors at the polar or at the cytoplasmic clusters. The reaction rates of the phosphotransfer network are such that a change in the number of active receptors at the cytoplasmic cluster causes a faster fall in CheY6-P concentration than does a similar change in the number of active receptors at the polar cluster.
Qualitatively, the adaptation mechanism in the generic ODE model presented in Materials and Methods functions as follows: CheB1-P and CheB2-P are assumed to de-methylate active receptors, and the phosphotransfer network responds to a sensed increase in ligand concentration by reducing the concentration of
CheB1-P, CheB2-P, CheY3-P, CheY4-P and CheY6-P. This results in a reduction in the de-methylation rate of active receptors in the two receptor clusters, and also results in a decrease in the flagellar stopping frequency (which corresponds to an increase in the flagellar rotation rate). The constant methylation of inactive receptors by CheR2 and CheR3 then causes the number of methylated receptors, and, it is assumed, of active receptors, to increase. Thus, the number of active receptors is eventually restored to its pre-stimulus equilibrium level. In turn, the phosphotransfer network then restores the amount of CheY6-P, and hence the flagellar switching frequency, back to its original level. According to the model of the forward signalling pathway, the proteins CheB1-P and CheB2-P therefore act as feedback signals that restore the chemotaxis pathway to its original state. However, the exact connectivity between CheB1-P/CheB2-P and the two receptor clusters is unknown.
To determine the most likely interconnection structure and to provide a rationale of how such a structure may be advantageous in terms of chemotactic performance, we created four variants of the generic ODE model with the forward pathway, each having a different interconnection structure between the proteins CheB1-P/ CheB2-P and the two receptor clusters (Figure 2(B)). All models were able to produce wild type response data and behaved as expected for the response data generated with gene deletions available at the time. The unknown parameters in the models (K1,K21,K22,K3andKK~1,
~
K
K21,KK~22,KK~3) were fitted to wild type data for each model. The significance of these parameters is as follows:
N
K1,KK~1 : Along with the sensed ligand concentration, theseparameters determine the proportion of methylated receptors that are active at the polar and cytoplasmic clusters respectively.
N
K21,K22: These parameters determine the strength of the CheB1-P, CheB2-P feedbacks to the polar cluster respectively.N
KK~21,KK~22: These parameters determine the strength of the CheB1-P, CheB2-P feedbacks to the cytoplasmic cluster respectively.N
K3,KK~3 : These parameters represent the activity of CheR2/ CheR3respectively.For notational convenience, it is useful to group the CheB1-P/ CheB2-P feedback gainsK21,K22,KK~21,KK~22into a feedback matrix
K2~ KKK~21 K22 21 KK~22
. The four CheB1-P and CheB2-P feedback
connectivities (and their associated K2) for which models were constructed are as follows:
I. CheB1-P regulates the methylation state of the polar receptor cluster and CheB2-P of the cytoplasmic cluster only (shown in solid de-methylation reactions in Figure 2
(B)):K2~ K021 KK~0 22
.
II. CheB1-P regulates the methylation state of both the polar cluster and the cytoplasmic cluster while CheB2-P methylates only cytoplasmic cluster receptors (solid de-methylation reactions and the dotted de-de-methylation
reaction in Figure 2 (B)):K2~ K~21 0 K K21 KK~22
.
III. CheB1-P and CheB2-P both regulate the methylation state of the polar receptor cluster and CheB2-P of the cytoplasmic receptor cluster only (solid de-methylation reactions and the dashed de-methylation reaction in
Figure 2 (B)):K2~ K021 KKK~22 22
. Figure 3. The speed of response of each cluster to input
signals.The response of the normalized CheY6-P concentration to a
step decrease, at time 10 seconds, in the number of active receptors at the polar cluster (from Ra= 1mM toRa= 0mM, dashed) and at the cytoplasmic cluster (from RRa~ = 1mM to RRa~ = 0mM, solid). Such a decrease in active receptors can be due to a step increase in sensed ligand. A step decrease in active polar cluster receptors results in a slower fall in the normalized CheY6-P concentration (90%-10% fall time:
50.57 sec) than would an identical change in the number of active cytoplasmic cluster receptors (90%-10% fall time: 21.98 sec).
IV. CheB1-P and CheB2-P both regulate the methylation state of both receptor clusters (solid de-methylation reactions, the dashed methylation reaction and the dotted
de-methylation reaction in Figure 2 (B)):K2~ K~21 K22 K K21 KK~22
.
After constructing these four models, we carried out experiments to differentiate between them, by finding the optimal initial conditions of the cells in the assay so as to maximize the difference between the outputs of the different models [20,24]. The conditions searched were limited to what could be implemented experimentally and included deletions, over-expression of proteins and combinations of these. To confirm these conditions allow for invalidation, simulations were run of the four models I–IV testing the possible initial conditions and inputs. The simulations showed that the initial conditions that allow for the best model invalidation were the deletion of CheR3 and, in a separate experiment, the deletion of CheB1 (Figure 4).
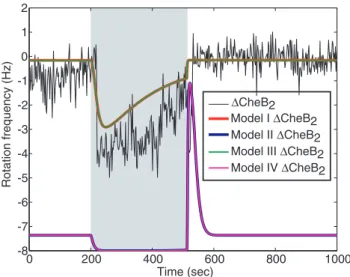
The experiments were then implemented in R. sphaeroides, subjecting a population of cells to a step increase in ligand concentration (propionate) and then measuring the resulting flagellar activity through a tethered cell assay (Figure 4). Experimentally the deletion of either CheB1 or CheR3 resulted in cells with a rotation frequency of 28 Hz that showed no noticeable response to the addition or removal of ligand. In the simulations, only Models I and III displayed this behaviour upon deletion of CheR3 (Figure 4, top row) and only Model III displayed this behaviour upon deletion of CheB1(Figure 4, bottom row). Models I, II and IV were thus invalidated and only Model III was able to replicate the experimental data. As a test of this model invalidation, a further experiment wherein CheB2 was deleted was performed. The result of this experiment and the outputs of the four models under the CheB2deletion (overlaid) are shown in Figure 5. Models I and III were once again able to replicate the deletion data whilst Models II and IV produced outputs that differed from the experimental outcome.
Figure 4. Model invalidation.Top left: Simulations of the wild type Models I–IV and with CheR3deleted in response to 100mM of ligand added at
100 seconds and removed at 220 seconds. Top right: Average responses of wild type cells and CheR3deletion cells in a tethered cell assay with
100mM of propionate added at 100 seconds and removed at 220 seconds. Bottom left: Simulations of the wild type Models I–IV (dashed line) and with CheB1deleted in response to 100mM of ligand added at 100 seconds and removed at 220 seconds. Bottom right: Average responses of wild
type cells and CheB1deletion cells in a tethered cell assay with 100mM of propionate added at 100 seconds and removed at 220 seconds. Cells rotate
Dynamic properties of chemotaxis models
The experiments described above demonstrated that the proposed Models I, II and IV are invalid, being unable to explain experimental data. To compare the four models further,in silico experiments were performed on the data-fitted Models I–IV that compared how the different feedback configurations affect chemo-tactic performance in terms of the sensitivity of the flagellar stopping frequency in response to variations in the values of the models’ biochemical parameters and in response to noise. Following these results, we use linear models with structures that represent the different connectivities of Models I–IV to analyze these structures’ relative sensitivities to parametric variations and noise.
Chemotactic performance. The performance of the different chemotaxis models was compared by simulating the
efficiency of each model in ascending an attractant gradient, as illustrated in Figure 6 (left). For each chemotaxis model, Figure 6 shows the average distance travelled up the attractant gradient by ten bacteria during a simulation lasting 80 seconds. As shown in Figure 6 (right), the chemotactic performances of the different models according to this measure were nearly identical (see Materials and Methods for more details).
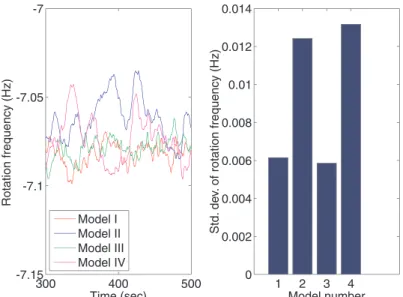
Response to noisy ligand variations. The bacterium’s environment is typically composed of regions of high and low chemoattractant or chemorepellant concentrations. Additionally, the bacterium will sense small, fast fluctuations in the detected level of ligand due to molecular noise. To test how sensitive the chemotaxis Models I–IV are to such ligand fluctuations, anin silico experiment was performed on each model in which the ligand concentration sensed by the polar cluster,L, was modelled as the noisy signalL= max(0,1+g), wheregis a white noise signal with a
zero-mean, unit variance Gaussian distribution. The resulting rotation frequencies were then recorded and are shown in Figure 7. As can be seen in Figure 7, ligand level fluctuations sensed at the polar cluster of receptors resulted in larger variance of the rotation frequency in Models I, II and IV than in Model III.
The sensitivity of the chemotaxis Models I–IV to ligand inputs was then tested in twoin silicoexperiments which were performed on each model and in which the flagellar rotation frequency was recorded in response to sinusoidal variations in the ligand signals
LandLL~(the latter of which corresponds to ligand inputs acting on the cytoplasmic cluster). As can be seen in Figure 8, ligand level fluctuations sensed at the polar cluster of receptors resulted in larger changes in the rotation frequency in Models II and IV than in I and III. When the ligand concentration variations were sensed at the cytoplasmic cluster the result was a greater variation in the rotation frequency in Models I and III than in the other two models. Once more, these simulations suggest that CheB1-P de-methylating the cytoplasmic cluster differentiates the performance of Models II and IV from Models I and III.
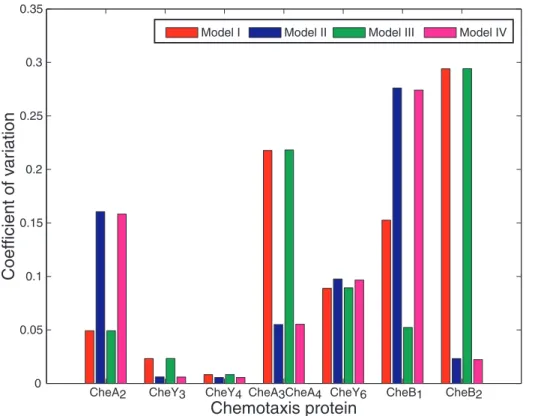
Parametric sensitivity analysis of the chemotaxis models. To investigate the sensitivity of the models to parameter variations, we performed an in silico experiment in which, for each of the different chemotaxis models, the variation of the steady-state of the chemotaxis system was measured under randomly chosen values of the copy numbers of chemotaxis proteins
Figure 5. Deletion of CheB2.Average responses of CheB2deletion
cells in a tethered cell assay with 100mM of propionate added at 200 seconds and removed at 512 seconds. Solid lines: simulations of the Models I–IV with CheB2deleted in response to 100mM of ligand
added at 200 seconds and removed at 512 seconds. Cells rotate counter clockwise hence negative Hz values are observed. Ligand addition is marked by grey shading.
doi:10.1371/journal.pcbi.1001130.g005
(see Materials and Methods). For each chemotaxis protein, the resulting coefficient of variation of the steady-state is shown in Figure 9. Once more, there was a similarity in the sensitivity of each model to these parametric variations between Models I and III and between Models II and IV, with the latter pair showing slightly higher sensitivity to copy numbers of the chemotaxis protein CheY6 among others. In addition, Model III showed considerably lower sensitivity with respect to CheB1 copy numbers than the other models.
Linear model analysis. Further insight to the differences in performance between the models can be obtained by analyzing the interconnection structure of these models using control theory. In particular, the way in which such feedback arrangements can affect the performance of control systems like the R. sphaeroides chemotaxis pathway can be studied by comparing the behaviour of different linear systems that are structurally similar to Models I–IV. The block diagram in Figure 10 depicts a system composed of two modules representing the polar and cytoplasmic clusters. The CheB1-P/CheB2-P outputs of the two modules exhibit exact adaptation through integral control in response to step changes in the input ligand concentration level, as inE. coli[8]. Depending on the values of feedback gains~kk21andk22(which correspond to KK~21 andK22 respectively in the chemotaxis models described above), the system can represent one of the four chemotaxis models:
Model I:~kk21~0,k22~0 Model II:~kk21w0,k22~0 Model III:kk~21~0,k22w0 Model IV:~kk21w0,k22w0.
The gainsa,bin Figure 10 are such thatbwaw0, representing the fact that the cytoplasmic receptor cluster can, as a result of the measured reaction rates, relay a sensed ligand input signal to the flagellar motor faster than the polar receptors cluster (see Figure 3). For the examples we shall consider we seta~1andb~10. Gains ~
k
k22 and k21 correspond toKK~22 andK21 in the chemotaxis model respectively. The frequency domain transfer function of the system in Figure 10 from the ligand inputsLandLL~to the outputyis then
Y~
bq s G1G2
1zab
s2qk22G1G2
Lz G2
1zab
s2qk22G1G2 ~
L
L ð1Þ
whereG1~ s
szak21,G2~ s szb~kk22,q
~1{~kk21,kk~22w0,k21w0.
This function is a frequency-domain map from signalsL andLL~
to the output Y, which corresponds to the flagellar rotation frequency. In the following, we shall use this frequency domain
Figure 7. Response to external ligand variations.Standard deviations of the flagellar rotation frequencies for each of the four chemotaxis models in response to a noisy ligand input sensed at the polar cluster given byL= max(0,1+g) (wheregis a white noise signal with a zero-mean, unity variance Gaussian distribution).
doi:10.1371/journal.pcbi.1001130.g007
Figure 8. Input-output gains of the two sensing clusters.
Frequency response magnitude plots showing the response of the different models to sinusoidally-varying ligand concentrations model-ling noisy ligand input signals. Top: Constant ligand to cytoplasmic cluster and variable ligand to polar cluster (L~Lzsin(vt),
~
L
L~3:5Lz0:035, where L~2). Bottom: Constant ligand to polar cluster, sinusoidal to cytoplasmic cluster (L~L,LL~~ 3:5(Lz
representation of the chemotaxis system to demonstrate how the feedback of linear systems with structures similar to the chemotaxis Models I–IV affects system performance.
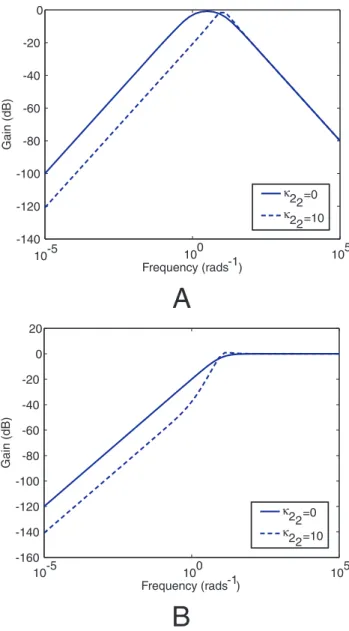
The Bode magnitude diagrams (Materials and Methods) in Figure 11(A) illustrate the effect of increasingk22 in reducing the sensitivity function of the system (1) over most excitation frequencies (see the Discussion and Text S1 for a brief introduction to sensitivity functions). At the same time, Figure 11(B) shows that strengthening the feedback ~kk22, which corresponds to increasing the de-methylation of the cytoplasmic cluster by CheB2-P, decreases the sensitivity of the polar cluster over low frequencies.
Figure 12 presents a Bode magnitude plot showing the gain of the linear system (1) to inputsL and LL~ which represent sensed ligand at the polar and cytoplasmic receptor clusters respectively. The figures show that, similar to the simulations of Models I and
III, the linear model with a gaink22~0(similar in structure to Model I) andk22~10(similar in structure to Model III) also shows a relatively low sensitivity to high frequency (noisy) inputs at the polar receptor cluster and a relatively high sensitivity to noise detected at the cytoplasmic receptor cluster.
Discussion
From the designed experiments performed, it was possible to invalidate all models but Model III. This suggests that the feedback in the chemotaxis system could occur in an asymmetric fashion. That is, CheB1-P may only interact with the membrane signalling cluster whilst CheB2-P interacts with both clusters. It is likely that the two chemotaxis pathways initially evolved independently and then became part of the same organism by horizontal gene transfer.
Figure 9. Parametric sensitivity analysis.Relative sensitivities of the rotation frequency outputs of the different chemotaxis models to changes in the chemotaxis protein copy numbers.
doi:10.1371/journal.pcbi.1001130.g009
Figure 10. Comparison with engineering systems.Block diagram representation of a linear system structurally similar to theR. sphaeroides
chemotaxis pathway. In this system, gaink~k21corresponds toKK~21in the chemotaxis model,k22toK22,k~k22toKK~22andk21toK21. Levels of CheB1-P and
CheB2-P exhibit exact adaptation to step changes in ligand concentrationL,LL~. We assumebwa, mirroring the faster dynamics of the cytoplasmic
Thus one would possibly expect either full connectivity or complete isolation of the two pathways until a further mutation occurs.
Understanding the outputs of the designed experiments R. sphaeroideshas a more complex chemotaxis network thanE. coli and the multiple receptor clusters and multiple feedback pathways mean that mutants will not always have an intuitive phenotype. For example theDcheB1mutant does not have the loss of response phenotype one would expect from a direct comparison with theE. colisystem. We can try to understand whyDcheB1has a steady state at28 Hz by looking at the structure of the model we have been unable to invalidate, and the reason is as follows:
CheB1, CheB2 and CheY6(along with CheY3and CheY4) each compete for phosphoryl groups from CheA2-P. CheB1is present in relatively large copy numbers and CheB1-P has negligible degradation rate (see Table 1). When present, CheB1 ‘stores’ a large proportion of phosphoryl groups. When absent, the competition for phosphoryl groups from CheA2-P remains between CheB2, CheY6, CheY3 and CheY4. The rate of phosphorylation of CheY6 by CheA2-P is relatively small, CheY6-P receiving most of its phosphorylation from the CheA3A4-P complex. Therefore deletingcheB1 shifts the
equilib-rium of the system so that a higher proportion of the phosphoryl groups from CheA2-P go to CheY3, CheY4 or CheB2. The increase in CheY3-P and CheY4-P results in a stronger negative feedback to the cytoplasmic cluster, and the steady-state amount of active receptors at the cytoplasmic cluster is therefore less in the case ofDcheB1. The consequence of this is that the main source of Figure 11. Variation of linear system sensitivity under different
feedback strengths as a function of frequency. (A) Bode magnitude plots of the sensitivity function of system (1) with~kk21~0 and different values of gaink22, which corresponds to the feedback strength of CheB2-P de-methylating active polar cluster receptors. With
these gains the system is structurally similar to Model III. (B) Sensitivity function of the block corresponding to the cytoplasmic cluster in the linear model (1), for different values of feedback gain ~kk22, which corresponds to the feedback strength of CheB2-P de-methylating active
cytoplasmic cluster receptors. The frequency domain sensitivity function isScyt~ s
szkk~22b
(see Text S1).
doi:10.1371/journal.pcbi.1001130.g011
Figure 12. Variation of linear system gain magnitude under different feedback strengths as a function of frequency.Bode magnitude plots of transfer functions from ligand inputsL,LL~toYin the linear system (1) corresponding to Models I (k22~0) and III (k22~10). (A) Bode magnitude plots fromLtoY. (B) Bode magnitude plots fromLL~toY.
phosphorylation for CheY6-P, which is CheA3A4-P, is reduced, and hence the level of CheY6-P is reduced. The stopping frequency is consequently reduced. Therefore, rather thanDcheB1
leading to a loss of response to stimulus, the result of this deletion is a shift in the steady state to a high rotation frequency.
Relative advantages of the chemotaxis models
The performance measure of Figure 6 suggests that in ascending a ligand gradient under ideal conditions the four models behave almost identically, which may be expected as they all exhibit the same output profile under a step ligand addition. At the same time, simulations of the chemotaxis models showed a difference in robustness between Model III and the other models. From an evolutionary point of view, this may suggest that Model III may have advantages in terms of the robustness of chemotactic performance with respect to the other models. These differences in performance and their implications for chemotaxis are discussed next.
Sensitivity to parameter variations, noise and ligand inputs
It is desirable that the chemotactic performance of the bacterium is unaffected by changes such as noise in gene expression between the expression of CheOp2 and CheOp3 and therefore the ability to filter out any parametric variations from the pathway’s output would be an advantageous feature. The pathway’s primary output and the main determinant of chemo-taxis performance is the flagellar rotation frequency, which,
according to the four models presented, is directly controlled by CheY6. It was shown that Models I and III (the latter of which was not invalidated) have a slightly lower sensitivity to variations in the copy number of CheY6compared to Models II and IV (Figure 9). If Model III is indeed valid, such robustness could serve to better maintain the nominal steady state rotation frequency.
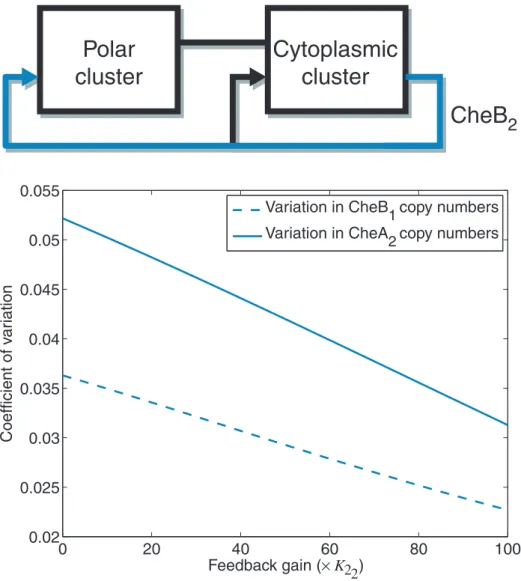
Model III also has advantages with respect to Model I due to the CheB2-P feedback to the polar cluster. Strengthening this feedback to the polar cluster, which corresponds to increasing the de-methylation rate of the polar cluster by CheB2-P, is equivalent to increasing the gaink22 in the linear system (1) – see Figure 10. For the linear model (1), this reduction in sensitivity is illustrated in the Bode sensitivity plot in Figure 11(A). From the point of view of control system design, this feedback is typically used to reduce the magnitude of the system’s sensitivity function (see Text S1). This function is dependent on the frequency at which the system is excited and can be shown to be equal to the relative incremental change in the overall system’s transfer function in response to an incremental change in the transfer function of the system’s sub-modulesG1andG2. If the sensitivity of the chemotaxis system is low, then the bacterium would be able to maintain its chemotactic response despite changes in the system’s biological parameters. The Bode plots (Materials and Methods) in Figure 11(A) illustrate the effect of increasingk22 in reducing the sensitivity function of the system (1) over most excitation frequencies. This effect can observed in the chemotaxis models in Figure 9 and Figure 13, where it is shown that strengthening the CheB2feedback to the polar cluster reduces the sensitivity of the steady state rotation frequency to changes in the copy numbers of CheB1and CheA2 (see Materials and Methods).
Simulation results in Figure 7 show that the switching frequency in Model III has a low sensitivity to noisy variations in ligand signals detected at the polar receptor cluster relative to the other models. Figure 8 shows the result of a further set of simulations of the four chemotaxis models in which the gain of each chemotaxis model in response to sinusoidal ligand variation detected at the two clusters is given as a function of ligand fluctuation frequency (see Materials and Methods). The figure shows that the switching frequency in Models I and III has a relatively low gain with respect to varying ligand signals detected at the polar receptor cluster and a relatively high gain with respect to ligand variations detected at the cytoplasmic cluster. The Bode magnitude plots in Figure 12 show the frequency-dependent gain of the linear system (1) to sinusoidal ligand inputs in the case~kk21~0, which is structurally similar to Models I and III. These plots parallel the results of the frequency response magnitude plots of Figure 8 which, for Models I and III, show low gain in response to high frequency inputs at the polar receptor cluster and high gain in response to high frequency signals at the cytoplasmic receptor cluster. The rejection of high frequency inputs at the cell pole may be advantageous in that the flagellar switching rate is then only varied when the polar cluster senses a relatively significant ligand concentration gradient that is large in spatial extent, and remains relatively unchanged when the receptors are subject to rapid fluctuations in sensed ligand due, for example, to molecular noise at the receptor such as that simulated in Figure 7.
Although the chemotaxis model assumes that the cytoplasmic cluster input depends on the sensed ligand, it is unknown what the cytoplasmic cluster senses. In addition to the possibility that this input is a function of the sensed ligand concentration, this cluster may potentially also integrate information about the metabolic state of the cell. In this case, this signalling may well be important to chemotactic performance and the relatively high gain of Model III to inputs at the cytoplasmic cluster may suggest that this
Table 1.Model parameters.
Reaction Parameter(s) Value(s)
(R1)A2?A2p k1 0.03 s21
(R2)A2pzB1<A2zB1p k2z,k
{
2 0.035 (mM s) 21, 0.01
(mM s)21
(R3)A2pzY3<A2zY3p k3z,k
{
3 0.065 (mM s) 21
, 0
(R4)A2pzY4<A2zY4p k4z,k{4 0.004 (mM s) 21, 0
(R5)A2pzY6<A2zY6p k5z,k
{
5 0.0006 (mM s) 21, 0
(R6)A2pzB2<A2zB2p k6z,k
{
6 0.0035 (mM s) 21,
0.01(mM s)21
(R7)B1p?B1 k7 0
(R8)Y3p?Y3 k8 0.08 s21
(R9)Y4p?Y4 k9 0.02 s21
(R10)Y6p?Y6 k10 0.1 s21
(R11)B2p?B2 k11 0.015 s21
(R12)(A3A4)pzY6<(A3A4)zY6p k12z,k
{
12 0.1 (mM s) 21, 0
(R13)(A3A4)pzB2<(A3A4)zB2p k13z,k
{
13 0.006 (mM s) 21, 0.07
(mM s)21
(R14)(A3A4)?(A3A4)p k14 0.02 s21
CheA2 26000 copies per cell
CheY3 1000 copies per cell
CheY4 4000 copies per cell
CheA3A4 12000 copies per cell
CheY6 51500 copies per cell
CheB1 23000 copies per cell
CheB2 3000 copies per cell
configuration would favour internal signals over external signals in terms of output. However, if chemotaxis is sensitive to such signals, it would be important that: (i) these signals are tightly controlled and relatively free of the influence of noise and (ii) the cytoplasmic cluster be insensitive to variations in its biological parameters, as sensitivity to such variations would diminish the system’s ability to correctly respond to inputs to the cytoplasmic cluster. In Model III, the CheB2-P feedback loop around the cytoplasmic cluster could offer this reduction in the sensitivity function of this cluster to such parametric variations. This reduction in sensitivity to variations of cytoplasmic cluster parameters is illustrated in Figure 11(B) using the linear model (1) of the chemotaxis system. The figure shows that increasing the feedback gain~kk22, which corresponds to the gain of the CheB2-P feedback to the cytoplasmic cluster in Model III, achieves a reduction in the sensitivity of the cytoplasmic cluster. In this way, the cytoplasmic cluster remains sensitive to its inputs, as shown by the large gain at high frequency in Figure 12(B), whilst its sensitivity to parametric variation is reduced due to the internal CheB2-P feedback. This effect can be observed in the chemotaxis
models in Figure 14, where it is shown that strengthening the CheB2 feedback to the cytoplasmic cluster reduces the sensitivity of the steady state rotation frequency to changes in the copy numbers of CheA3A4and CheY6(see Materials and Methods).
Figure 8 also shows that for Model I and III, high frequency variations in the ligand concentration sensed at the polar cluster are largely filtered out before causing flagellar switching. This may suggest that the relatively slow dynamics of the polar receptor cluster enable it to function as a low pass filter, preventing any high-frequency noisy variations in the sensed concentration of ligand from being signalled through to the flagellar motor. Figure 12(A) illustrates this attenuation of high frequency polar cluster ligand inputs for the linear model (1).
Chemotaxis as a cascade controlled system
When combined with the forward signalling pathway which was not invalidated previously [20], Model III has a feedback structure that corresponds to a control scheme termedcascade control. This term is used to denote a modular system that includes two feedback loops, one
Figure 13. Sensitivity to copy number with varying external feedback.Sensitivity of the chemotaxis steady state to random changes in copy numbers of chemotaxis proteins under different CheB2feedback strengths to the polar cluster. Sensitivity is measured as the ratio of the standard
deviation of the steady state to the nominal steady state. Solid line: Sensitivity of the chemotaxis steady state to changes in the copy number of CheA2under different strengths of CheB2feedback to the polar cluster. Dashed line: Sensitivity of the chemotaxis steady state to changes in the copy
number of CheB1under different strengths of CheB2feedback to the polar cluster.
nested within the other. The nested loop is used to regulate a sub-process of the system whilst the ‘external’ negative feedback loop from the system output to the input is used to regulate the entire system.
The measured reaction rates of the two clusters [15,16] are also such that the cytoplasmic cluster is faster than the polar cluster in responding to inputs, which would be required for the chemotaxis pathway to function as a cascade controlled system [19]. This modularization of the chemotaxis system into fast and slow parts mirrors the division of the cascade controlled system in Figure 1 into the slow and fast subsystems G1 and G2 respectively. The cascade control architecture enables the slow (primary) subsystem to fix a set-point for the fast (secondary) system and for the feedback around the secondary system to quickly regulate the secondary output in response to disturbances and variations in the secondary process [19]. This difference in speed is represented by havingbwwa,kk~21~0andk22w0in the linear model (1). Model III also features both an ‘internal’ feedback loop nested within an ‘external’ one corresponding to the dashed and solid feedbacks in Figure 1, respectively. These two feedbacks are manifested by the
CheB2-P feedback that de-methylates the cytoplasmic and the polar clusters respectively.
Interestingly this architecture mirrors the ability of the system to phosphotransfer, with the membrane cluster being able to phosphotransfer to and be de-methylated by both CheB proteins and the cytoplasmic cluster only phosphotransferring to CheB2, the protein that is able to de-methylate it. It does however raise an interesting question. Whereas CheB in E. coliis localised to the polar signalling cluster, inR. sphaeroidesboth expressed CheB’s are found to be delocalised. Yet, only one of the CheB proteins interacts with both signalling clusters. Thus the advantage of having delocalised CheB1is unclear.
We have shown that if theR. sphaeroideschemotaxis pathway has a cascade control architecture, this would enable robust chemo-taxis in an uncertain, noisy environment, conferring a selective advantage. InE. coli, one feedback loop is used to achieve perfect adaptation and sensing of temporal gradients and because there is only one signalling cluster all signal integration occurs there. UnlikeE. coli, theR. sphaeroideschemotaxis pathway with cascade
Figure 14. Sensitivity to copy number with varying internal feedback.Sensitivity of the chemotaxis steady state to random changes in copy numbers of chemotaxis proteins under different CheB2feedback strengths to the cytoplasmic cluster. Sensitivity is measured as the ratio of the
standard deviation of the steady state to the nominal steady state. Dashed line: Sensitivity of the chemotaxis steady state to changes in the copy number of CheA3A4under different strengths of CheB2feedback to the cytoplasmic cluster. Solid line: Sensitivity of the chemotaxis steady state to
changes in the copy number of CheY6under different strengths of CheB2feedback to the cytoplasmic cluster.
control feedback provides the bacterium with two feedback loops, one embedded within the other, to adapt and to reduce its sensitivity to parameter variations and noise. The other advantage to this architecture is demonstrated by the simulations shown in Figure 12, which illustrate that with this structure the system would be strongly sensitive to fast-changing inputs to the cytoplasmic cluster, perhaps from the metabolic state of the cell.
Understanding how biological networks achieve robust func-tionality in the face of disturbances and noise in their internal and external environment is a key question in systems biology. Such networks can be seen as control engineering feedback systems and can be analyzed using system engineering tools in order to understand the advantages of particular internal connectivities over others. In line with this methodology, this paper first utilized a network discrimination approach [20] to construct a model of the feedback connectivity within theR. sphaeroideschemotaxis pathway, and then explained the robustness properties of that model by re-interpreting the theoretical advantages of its cascade control structure in a biological framework and comparing it to the other possible models. This suggests a mechanism by which the bacterium can achieve robust chemotactic performance despite biochemical parameter variations and noise. Given that many chemotactic systems have multiple homologues [10] it would appear that using more complex feedback architectures to improve performance may be common in chemotaxis and in other signalling pathways, raising the possibility that this methodology can be used to analyze a wide set of biological systems.
Materials and Methods
Modelling the chemotaxis pathway in R. sphaeroides In the next three subsections, we present the three different modules of the chemotaxis signalling pathway: sensing, transduc-tion and actuatransduc-tion.
Sensing. We assume the same underlying mechanisms for the polar (MCP) and the cytoplasmic (Tlp) receptors. The parameters of the Tlp cluster are labelled with a tilde superscript. We also make the same assumptions of our model as those in [20], which are adopted from theE. colichemotaxis literature [23].
With the notation defined in Table 2, the model for the sensing mechanism is as follows:
Ra
½ ~ 1
K1ze½ L ð Þ½Rm
_
R Rm
~K3ð½RT{½ RaÞ{½ Ra K21 B1p
h i
zK22 B2p
h i ~ R Ra ~ Y3p h i
z Y4p
h i
~
K
K1 Y3p
h i
z Y4p
h i
zLL~
RR~m
_~ R R~ R Rm h i
~KK~3 RR~T
{ RR~a
{ RR~a
~
K K21 B1p
h i
zKK~22 B2p
h i
ð2Þ
We assume that the cytoplasmic receptor cluster senses extracellular ligand concentrations indirectly; for example, LL~
could be internalized attractants, a by-product of the internaliza-tion process or a metabolic response to it. For simplicity, we assume the following affine relationship betweenLandLL~
~
L L
~3:5½ Lz0:035 ð3Þ
We let e= 1 (mM)21 and ½RT~RR~T~1mM. The remaining unknown parameters in this model are the dimensionless quantities
K1,KK~1, the feedback matrixK2~ KKK~21 K22 21 KK~22
(which have units
of (mM s)21
) andK3,KK~3(which have units of s21). The significance of these parameters was detailed in the Results section. We obtain the following values for these unknown parameters for the different models by fitting them to data from tethered cell assays:
K1~KK~1~20,K2~
33:75 0
0 33:75
,K3~KK~3~0:0612
K1~KK~1~1,K2~
0:0022 0
0:0022 0:0022
,K3~KK~3~0:002
K1~KK~1~20,K2~
33:75 33:75
0 33:75
,K3~KK~3~0:0612
K1~KK~1~1,K2~
0:0022 0:0022
0:0022 0:0022
,K3~KK~3~0:002
The difference between models I–IV lies in the structure of the CheB1-P, CheB2-P feedback.
Table 2.Model notation.
Species Definition
RT Total polar cluster receptors
~ R
RT Total cytoplasmic cluster receptors
Rm Methylated polar cluster receptors
~ R
Rm Methylated cytoplasmic cluster receptors
Ra Active polar cluster receptors
~ R
Ra Active cytoplasmic cluster receptors
A2 Un-phosphorylated CheA2
A2p Phosphorylated CheA2
A3A4
ð Þ Un-phosphorylated CheA3-CheA4 A3A4
ð Þp Phosphorylated CheA3-CheA4
B1 Un-phosphorylated CheB1
B1p Phosphorylated CheB1
B2 Un-phosphorylated CheB2
B2p Phosphorylated CheB2
Y3 Un-phosphorylated CheY3
Y3p Phosphorylated CheY3
Y4 Un-phosphorylated CheY4
Y4p Phosphorylated CheY4
Y6 Un-phosphorylated CheY6
Y6p Phosphorylated CheY6
L Ligand acting on polar cluster receptors
~ L
L Ligand acting on cytoplasmic cluster receptors
M Motor activity
Y Average bacterium body rotation rate
Transduction. We assume that the structure of the phosphotransfer network is the same as that of the models presented previously in [20], with the modification that when polar and cytoplasmic receptors are in their active state the respective auto-phosphorylation rates of CheA2 and CheA3, k1 and k
14, are accelerated to k1~100Rak1 and k14~100RR~ak14 where k1 and k14 are the reaction constants of the auto-phosphorylation of CheA2 and CheA3 obtained from in vitro experiments in the absence of the influence of receptors, as given in Table 1 and in [20]. Biologically, it would be expected that the auto-phosphorylation ratesk
1 andk14 (for the case where CheA2 and CheA3are each in a fully active complex) are higher than the ratesk1andk14 measuredin vitro.
Actuation. We denote the flagellar stopping frequency byM. We assume some interaction which does not lead to a long lasting binding between CheY6-P and the FliM rotor switch. However, stopping frequency decreases at a constant rate in the absence of CheY6-P. This relationship between the CheY6-P and the stopping frequency effectively constitutes a low-pass filter that attenuates fast changes in CheY6-P concentration. We model this behaviour by:
_
M
M~ Y6p
100 {M ð4Þ
The output of the model is the flagellar rotation frequency observed in tethered cell assays. We use the following heuristic description to convert motor activity into R. sphaeroides body rotations (given in rot/sec or Hertz):
y~{ 1
SzM4
ð Þ: ð5Þ
We setS~0:125which means that saturation occurs at28 rot/
sec. This value follows from experimental observations – even for major changes in attractant concentrations this value was almost never surpassed.
Measuring chemotactic performance
The measure of chemotactic performance used in the paper is the relative distance travelled by the bacterial cells up an attractant gradient. The medium in which the cells chemotax is assumed to be a two-dimensional plane having an x- and a y- dimension (where distance along these two directions is unit-less), as illustrated in Figure 6 (left). The ligand concentrationLis assumed to vary as L= 100x (for x.0) and L= 0 otherwise, remaining unchanged along theydirection. The simulation is initialized with the bacterial cells having a starting position ofx= 0 and an initial orientation aligned with the positivexdirection.
At each switch, the bacterium is assumed to change its orientation by an angle (measured in radians) randomly selected from the zero-mean, unity-variance Gaussian distribution. The concentration of ligand at its position, is then input into the chemotaxis model described above. The output, the flagellar rotation frequency (in Hz), is then translated to the size of the step the bacterium makes in the direction of its orientation.
Parametric sensitivity analysis
To measure the effect of the variation of a particular parameter on the steady state flagellar rotation frequency, several values of the parameter of interest were randomly selected from a normal distribution with a mean given by the nominal value of the
parameter for the given model and with a standard deviation given by half the nominal value of the parameter. A simulation of the model at steady state was then run and the resulting steady state rotation frequency was recorded for each of the randomly chosen parameter values. The coefficient of variation, given by the ratio of the standard deviation of the recorded steady state values to the nominal steady state value was then computed. This dimensionless quantity can be used to compare the dispersion of quantities with a non-zero mean. Sensitivity to a certain parameter value is therefore high when its corresponding coefficient of variation is high, as this would indicate a significant shift from the nominal output in response to a variation in parameter values.
Linear systems analysis techniques
To compare the different chemotaxis feedback structures in an analytical way, the linear system (1) was constructed. A rich theory exists to analyze and compare the properties of linear systems in the so-called frequency domain using their associated transfer functions [25]. Using such tools, it is possible to study the effects of excitation frequency on systems’ gains and sensitivities as was done in this paper. As an example of how this method works, consider a linear dynamical system
_
x
x~AxzBu, y~Cx ð6Þ
whereA,Band Care matrices of appropriate dimension, whose entries depend on the model parameters, andu(t)~rsin(vt)is a sinusoidal input with angular frequencyvand fixed amplituder.
System (6) is the so called state space representation of the model in the time domain. It is common in control systems engineering to investigate the behaviour of such a system’s dependency on excitation frequencyv. This requires transforming the system to
the frequency domain via the Laplace transform. We denote the Laplace transform ofuandybyU(s) andY(s) respectively, wheres is a complex independent variable. Then,
Y(s)~G(s)U(s)
whereG(s) is the transfer function in the frequency domain and is given by [25]:
G(s)~C(sI{A){1B
:
By evaluating this function for values ofson the imaginary axis (by settings~jvwherejispffiffiffiffiffiffiffiffi{1) we obtain a frequency domain relationship between the system’s input and output. If the system is stable (the eigenvalues of matrixAhave negative real parts) and is excited with a periodic input signaluof frequencyv, then after
some transient behaviour the outputy is given by a sinusoidal wave that is phase shifted and amplified with respect to u by amounts dependent on v. The amplification factor is given in
decibels by
G jvð Þ
j jdB~20log10
ffiffiffiffiffiffiffiffiffiffiffiffiffiffiffiffiffiffiffiffiffiffiffiffiffiffiffiffiffiffiffiffiffiffiffiffiffiffiffiffiffiffiffiffiffiffiffiffiffiffiffiffiffiffiffiffiffi <fG(jv)g
ð Þ2zð=fG(jv)gÞ2 q
,
whilst the phase shift is given by
%G jvð Þ~arctan =fG(jv)g <fG(jv)g
The Bode magnitude plot shows the variation ofjG jvð ÞjdB in decibels with frequency of excitation v. The Bode phase plot
shows the variation of %G jvð Þ in radians with frequency of excitationv.
Model parameters
Model parameters were obtained by performing least squares fitting on previously obtained experimental data [15], as described in [20]. These are listed in Table 1. Protein concentrations were obtained via quantitative western blotting as described in [20].
Response to noisy ligand input
We tested the gain of each model to sinusoidally varying ligand input signals, applied separately at the polar and at the cytoplasmic clusters. In the first case we applied the constant ligand input LL~~3:5Lz0:035, with L~2 to the cytoplasmic
cluster whilst simultaneously applying to the polar cluster sinusoidally varying ligand signals given byL~Lzsin(vt), with frequencyvin the range 0.01 to 1 rads21
.
In the second case we applied the constant ligand inputL~L
to the polar cluster whilst simultaneously applying to the cytoplasmic cluster sinusoidally varying ligand signals given by ~
L
L~3:5(Lzsin(vt))z0:035, with frequencyvin the range 0.01
to 1 rads21 .
The frequency response magnitude plots of Figure 8 show the magnitude of the fundamental frequency of the sinusoidal
variation in the flagellar rotation frequency in response to these sinusoidal ligand input signals.
Plasmids and strains
The strains used in this study are shown in Table 3.R. sphaeroides strains were grown in succinate medium at300Cunder aerobic conditions with shaking. Where required, nalidixic acid was used at concentrations of 25 g ml21
.
Tethered cell analysis
Tethered cell responses to propionate of theR. sphaeroidesstrains were characterized as described previously [20]. For each strain and wild type 4 slides were analyzed each containing 10 cells.
Supporting Information
Text S1 Supporting information text.
Found at: doi:10.1371/journal.pcbi.1001130.s001 (0.95 MB DOC)
Author Contributions
Conceived and designed the experiments: AH MAJR EA PKM JPA AP. Performed the experiments: AH MAJR EA. Analyzed the data: AH MAJR EA AP. Contributed reagents/materials/analysis tools: AH MAJR EA PEM JPA. Wrote the paper: AH MAJR EA PKM JPA AP.
References
1. Tyson JJ, Chen KC, Novak B (2003) Sniffers, buzzers, toggles and blinkers: dynamics of regulatory and signaling pathways in the cell. Curr Opin Cell Biol 15: 221–231.
2. Hartwell LH, Hopfield JJ, Leibler S, Murray AW (1999) From molecular to modular cell biology. Nature. pp C47–53.
3. Wadhams GH, Armitage JP (2004) Making sense of it all: Bacterial chemotaxis. Nat Rev Mol Cell Biol 5: 1024–1037.
4. Emonet T, Cluzel P (2008) Relationship between cellular response and behavioral variability in bacterial chemotaxis. Proc Natl Acad Sci U S A 105: 3304–3309.
5. Shimizu TS, Tu Y, Berg HC (2010) A modular gradient-sensing network for chemotaxis inEscherichia coli revealed by responses to time-varying stimuli. Mol Syst Biol 6: 382.
6. Clausznitzer D, Oleksiuk O, Løvdok L, Sourjik V, Endres RG (2010) Chemotactic Response and Adaptation Dynamics in Escherichia coli. PLoS Comput Biol 6: e1000784.
7. Baker M, Wolanin P, Stock JB (2006) Signal transduction in bacterial chemotaxis. BioEssays 28: 9–22.
8. Yi T-M, Huang Y, Simon MI, Doyle J (2000) Robust perfect adaptation in bacterial chemotaxis through integral feedback control. Proc Natl Acad Sci U S A 97: 4649–4653.
9. Brogan WL (1991) Modern control theory. Englewood Cliffs; London: Prentice-Hall. xviii, 653 p.
10. Wuichet K, Zhulin IB (2010) Origins and Diversification of a Complex Signal Transduction System in Prokaryotes. Sci Signal 3: ra50.
11. Hamer R, Chen P-Y, Armitage J, Reinert G, Deane C (2010) Deciphering chemotaxis pathways using cross species comparisons. BMC Syst Biol 4: 3. 12. Szurmant H, Ordal GW (2004) Diversity in Chemotaxis Mechanisms among the
Bacteria and Archaea. Microbiol Mol Biol R 68: 301–319.
13. Porter SL, Wadhams GH, Armitage JP (2008)Rhodobacter sphaeroides: complexity in chemotactic signalling. Trends Microbiol 16: 251–260.
14. Wadhams GH, Warren AV, Martin AC, Armitage JP (2003) Targeting of two signal transduction pathways to different regions of the bacterial cell. Mol Microbiol 50: 763–770.
15. Porter SL, Armitage JP (2002) Phosphotransfer in Rhodobacter sphaeroides
chemotaxis. J Mol Biol 324: 35–45.
16. Porter SL, Armitage JP (2004) Chemotaxis inRhodobacter sphaeroidesrequires an atypical histidine protein kinase. J Biol Chem 279: 54573–54580.
17. Martin AC, Wadhams GH, Shah DS, Porter SL, Mantotta JC, et al. (2001) CheR- and CheB-dependent chemosensory adaptation system of Rhodobacter sphaeroides. J Bacteriol 183: 7135–7144.
18. Rao CV, Kirby JR, Arkin AP (2004) Design and diversity in bacterial chemotaxis: a comparative study inEscherichia coliandBacillus subtilis. PLoS Biol 2: E49. 19. Seborg DEET, Mellichamp DA (2004) Process Dynamics and Control John
Wiley & Sons, Inc.
20. Roberts M, August E, Hamadeh A, Maini P, McSharry P, et al. (2009) A model invalidation-based approach for elucidating biological signalling pathways, applied to the chemotaxis pathway inR. sphaeroides. BMC Syst Biol 3: 105. 21. Andrews BW, Yi T-M, Iglesias PA (2006) Optimal Noise Filtering in the
Chemotactic Response ofEscherichia coli. PLoS Comput Biol 2: e154. 22. Jiang L, Ouyang Q, Tu Y (2010) Quantitative Modeling of Escherichia coli
Chemotactic Motion in Environments Varying in Space and Time. PLoS Comput Biol 6: e1000735.
23. Barkai N, Leibler S (1997) Robustness in simple biochemical networks. Nature 387: 913–917.
24. Melykuti B, August E, Papachristodoulou A, El-Samad H (2010) Discriminating between rival biochemical network models: three approaches to optimal experiment design. BMC Syst Biol 4: 38.
25. Zhou K, Doyle JC, Glover K Robust and optimal control: Prentice-Hall, Inc. pp 596.
26. Sockett RE, Foster JCA, Armitage JP (1990) Molecular biology of theRhodobacter sphaeroidesflagellum. FEMS Symposium 53: 473–479.
Table 3.Strains used in this study.
Strain/Plasmid Characteristics Source
R. sphaeroidesWS8N Spontaneous nalidixic acid resistant mutant of wild type WS8 [26]
R. sphaeroidesJPA517 WS8N with thecheB1gene deleted by genomic replacement [17]
R. sphaeroidesJPA 1320 WS8N with thecheR3gene deleted by genomic replacement [15]
![Figure 2. Chemotaxis in R. sphaeroides . (A) The chemotaxis pathway in R. sphaeroides as currently understood, including the forward chemotaxis pathway previously proposed [20]](https://thumb-eu.123doks.com/thumbv2/123dok_br/16396327.193136/3.918.87.819.94.700/chemotaxis-sphaeroides-chemotaxis-sphaeroides-currently-understood-chemotaxis-previously.webp)