www.biogeosciences.net/11/7159/2014/ doi:10.5194/bg-11-7159-2014
© Author(s) 2014. CC Attribution 3.0 License.
Drought impact on carbon and water cycling in a
Mediterranean
Quercus suber
L. woodland during the
extreme drought event in 2012
A. Piayda1, M. Dubbert2, C. Rebmann1, O. Kolle3, F. Costa e Silva4, A. Correia4, J. S. Pereira4, C. Werner2, and M. Cuntz1
1Department Computational Hydrosystems, UFZ Helmholtz Centre for Environmental Research, Permoserstr. 15, 04318 Leipzig, Germany
2Agroecosystem Research, BayCEER, University of Bayreuth, Universitätsstr. 30, 95447 Bayreuth, Germany
3Field Experiments & Instrumentation, Max Planck Institute for Biogeochemistry, Hans-Knöll-Str. 10, 07745 Jena, Germany 4Department of Forestry, Instituto Superior de Agronomia, Technical University of Lisbon, Tapada da Ajuda,
1349-017 Lisbon, Portugal
Correspondence to:A. Piayda (arndt.piayda@ufz.de)
Received: 17 June 2014 – Published in Biogeosciences Discuss.: 3 July 2014
Revised: 29 September 2014 – Accepted: 12 November 2014 – Published: 16 December 2014
Abstract. Savannah-type ecosystems account for 26–30 %
of global gross primary productivity GPP, with water being one of the major driving factors. In Europe, savannah-type woodlands cover an area of about 1.5 million ha. Here, the recent past has shown a significant decrease in precipitation P in winter and spring as well as a decrease in total annual precipitation. Strong effects on local water balance and car-bon sink strength have thus been reported due to changes in precipitation regime.
The objective of this study is to quantify the impact of the extreme drought event in 2012 on the water balance, gross primary productivity and carbon sink strength of a typ-ical Portuguese cork-oak woodland (montado) compared to the wet year of 2011. Physiological responses of the dom-inant tree species Quercus suber(L.) are disentangled em-ploying combined photosynthesis and stomatal conductance modelling.
Precipitation effectiveness ET/P increased from 86 % in 2011 to 122 % in the 2012 dry year due to deep soil or groundwater access of the Q. subertrees leaving no water for groundwater replenishment. Understorey and overstorey GPP were strongly reduced, by 53 and 28 %, respectively, in 2012 compared to 2011, due to the late onset of the au-tumn rains in 2011 and an additional severe winter/spring drought. However, the ecosystem was still a carbon sink in
both years, but with a 38 % reduced sink strength under ex-treme drought in 2012 compared to 2011. The combined photosynthesis–stomatal conductance model yielded the best results if it was allowed to adjust photosynthetic and stomatal parameters simultaneously. If stomatal response was mod-elled with the Leuning approach, which allows for a differ-ent sensitivity to vapour pressure deficit, the stomatal model parameters were highly coupled. A change in either of the parameters needed to be compensated by the other to guar-antee a stable sensitivity of stomatal conductance to assim-ilation, independent of variations in vapour pressure deficit. TheQ. subertrees showed a 37 % reduced stomatal conduc-tance during the drought period of 2012 compared to 2011, due to water supply limitations. In response to reduced leaf-internal CO2availability, the trees strongly reduced the ap-parent maximum carboxylation rate by 43 % in 2012 com-pared to 2011. Unexpectedly, the optimum temperatureTopt of the maximum electron transport rate decreased during the drought period, enhancing the susceptibility of the trees to high temperature stress during the summer.
To model the effect of drought on the montado ecosystem successfully, variable apparent maximum carboxylation rate Vc,max, stomatal conductance parametermand vapour pres-sure deficit sensitivity parameterD0need to be incorporated into photosynthesis–stomatal conductance modelling.
1 Introduction
One of the typical semi-arid ecosystems in Europe is a savannah-type woodland (montado), consisting of a sparse overstorey tree layer and a herbaceous understorey layer. During the biomass peak of the herbaceous plants in spring, the understorey layer can provide a large contribution to the whole ecosystem water and carbon balance and, thus, can play a significant role in the annual carbon and water budgets (Unger et al., 2009; Paco et al., 2009; Dubbert et al., 2014b). However, each layer responds differently to changes in pre-cipitation, depending on its life form (chamaephyte or thero-phyte) and access to different water reservoirs throughout the year (Paco et al., 2009), including deep soil or groundwater (David et al., 2004).
Montado ecosystems (span.: dehesa) cover an area of about 1.5 million ha in Europe (Bugalho et al., 2011) and contribute together with savannah-type ecosystems on other continents about 30 % to global gross primary productivity GPP (Beer et al., 2010; Grace et al., 2006). The major driving factor of GPP inmontadoecosystems is water (Vargas et al., 2013; Pereira et al., 2007; David et al., 2004), since annual precipitation patterns show that periodical summer droughts and evapotranspiration losses are high (Krishnan et al., 2012; Huxman et al., 2005).
In the recent past, precipitation shows a significant de-crease in rain amount in February and March as well as a decrease in total annual rainfall on the Iberian Peninsula (Guerreiro et al., 2013; García-Barrón et al., 2013; Mourato et al., 2010; Paredes et al., 2006). A trend towards ex-treme events in the form of droughts is observed due to a more heterogeneous distribution of precipitation through-out the year (Zeppel et al., 2014; García-Barrón et al., 2013). These types of changes in precipitation regime have been reported as strongly affecting the local water balance (Ro-drigues et al., 2011; Vaz et al., 2010; Grant et al., 2010) and carbon sink strength (Pérez-Ramos et al., 2013; Pereira et al., 2007; Granier et al., 2007; Ciais et al., 2005) of ecosystems in semi-arid regions, and are expected to increase with proceed-ing climate change (Bussotti et al., 2013; Guerreiro et al., 2013).
Species in semi-arid environments have developed vast structural and functional adaptations to regulate carbon as-similation and respiratory water loss (e.g. Tenhunen et al., 1987; Werner et al., 1999). Considerable knowledge has been acquired on leaf-level physiological processes in the last three decades (e.g. Beyschlag et al., 1986; Sala and
Ten-hunen, 1996; Tenhunen et al., 1985, 1990; Werner et al., 2001), emphasising the role of ecophysiological adaptations to seasonality and summer drought under Mediterranean cli-mate conditions. In these environments, lack of precipitation often interacts with excessive irradiance and high tempera-ture, further constraining leaf carbon fixation through pho-toinhibition during drought (Werner et al., 2001, 2002). Cork oaks strongly reduce transpirational water loss by stomatal closure in response to drought to avoid a critical level of de-hydration and hydraulic failure (Oliveira et al., 1992; Ten-hunen et al., 1984, 1987; Werner and Correia, 1996; Kurz-Besson et al., 2006).
To investigate the influence of drought on carbon sink strength at ecosystem level, combined stomatal conductance–photosynthesis models can be used in order to disentangle regulatory processes from effects of micro-climatic variations. Different descriptions of the underlying processes exist in the literature, though. For example, stom-atal conductance can be modelled either as reacting to rela-tive humidity (Ball et al., 1987) or to vapour pressure deficit (Leuning, 1995). Also, the determination of parameters in individual descriptions is different among different authors. The sensitivity of stomatal conductance to vapour pressure, for example, is often taken as a fixed value while deter-mining only the other parameters in the coupled stomatal conductance–photosynthesis model time-variantly, although the sensitivities of stomatal conductance to photosynthesis and to vapour pressure are highly correlated. Recent studies could consequently demonstrate that changes of one single parameter, e.g. maximum carboxylation rate only or stom-atal conductance sensitivity only, do not explain drought-induced reductions in both GPP andT simultaneously (Egea et al., 2011; Reichstein et al., 2003; Zhou et al., 2013). Fur-thermore, different temperature dependencies of e.g. maxi-mum carboxylation or the electron transport rate have been proposed (Medlyn et al., 2002; von Caemmerer, 2000; June et al., 2004).
2 Material and methods
2.1 Site description
The study was conducted at the PT-Cor savannah-type flux observation site (Fig. 1) of the European Integrated Carbon Observation System (ICOS) ca. 100 km north-east of Lisbon, Portugal (latitude 39◦8′20.7′′N, longitude 8◦20′3.0′′W, alti-tude 162 m a.s.l.). The site is planted with evergreenQuercus suber(L.) trees of 209 individuals ha−1in a Luvisol soil (Jon-gen et al., 2011). The tree canopy has a leaf area index LAI of 1.05±0.07 m2leafm−ground2 , a midday gap probability Pgap(0) of 0.76±0.03 and an average tree canopy height of 9.7 m (Piayda et al., 2014). The Q. subertrees likely have deep soil water and groundwater access. Native annual grasses and herbs form the understorey vegetation (Jongen et al., 2013b; Dubbert et al., 2014a), which emerges after the first rains in autumn, has a peak stand height in spring (March–April), and becomes senescent at the beginning of the summer period (late May), with a maximum LAI of 0.70±0.05 m2leafm−2
ground. The understorey vegetation density and LAI are spatially highly variable due to the heterogeneous topography and, hence, differences in soil moisture regime. The whole region is under forest management.
2.2 Climate conditions
The site is characterised by a Mediterranean climate with moist and mild winters and dry and hot summers. The long-term mean annual temperature is about 15.9◦C, and the an-nual sum of precipitation is about 680 mm (Jongen et al., 2013b), with a characteristic annual pattern of high winter precipitation (November to January) and summer drought from June to September (Paredes et al., 2006). The rel-evance of the winter precipitation for the Portuguese hy-drological cycle can be easily explained by the prevailing Mediterranean-type climate that concentrates most of the precipitation during the winter half of the year, with little to no precipitation in summer. Hence, the following data treat-ment is based on the hydrological year beginning with the first autumn precipitation (October to September).
2.3 Overstorey eddy covariance measurements
The overstorey tower (Fig. 1, point 1) is set up with a Gill R3A-50 ultrasonic anemometer (Gill Instruments Ltd., Lymington, UK) in combination with a LI-7000 closed path CO2/H2O analyser (LI-COR, Lincoln, USA). The inlet tube has a length of 8.5 m, is attached to one of the anemome-ter arms, and is operated with an average flow rate of ca. 8 L min−1. The reference cell is flushed with N2. The mea-surement height is about 23.5 m above the ground. Data are continuously acquired and processed live on a field laptop with the eddy covariance data acquisition and the EddyMeas processing software package (meteotools, Jena, Germany; Kolle and Rebmann, 2007).
Figure 1.Satellite image of the study site (©Google Maps, 2013). (1) Position of the overstorey tower. (2) Position of the understorey tower.
At a height of 20 m above the ground, two upward-and downward-facing LI-190 quantum sensors (LI-COR, Lincoln, USA) and an NR-LITE net radiometer (Kipp and Zonen, Delft, the Netherlands) are attached. A radiation-shielded HMP 155 probe measures air temperature Ta and relative humidity rH (Vaisala, Helsinki, Finland). Pre-cipitationP is measured with an ARG100 aerodynamic rain gauge (Environmental Measurements Ltd., North Shields, UK) at the tower top. The meteorological parameters are logged on a CR10X data logger (Campbell Scientific, Logan, USA).
2.4 Understorey eddy covariance measurements
The understorey tower was located about 286 m north-west of the overstorey tower (Fig. 1, point 2). It was equipped with a Gill R3-50 ultrasonic anemometer (Gill Instruments Ltd., Lymington, UK) in combination with a LI-7500A open path CO2/H2O analyser (LI-COR, Lincoln, USA). The gas analyser was tilted 45◦from the vertical, and the sensor sep-aration was about 30 cm. The measurement height of both sensors was 3.15 m above the ground. EddyMeas was used for data acquisition here as well.
A third eddy covariance system consisting of a Gill R3-50 ultrasonic anemometer in combination with a LI-7500A open path CO2/H2O analyser was used to test the comparability of overstorey and understorey tower systems. For a period of 1 week each, it was mounted on the overstorey and under-storey towers and measured in parallel. Both systems showed high Bravais–Pearson correlation coefficients of 0.78 to 0.91 as well as small normalised root mean squared errors of 0.01 to 0.06 for water and carbon fluxes in comparison with the portable eddy system.
2.5 Soil temperature and moisture
Soil temperature Ts and soil moistureθ were measured at open and tree-shaded locations between the two towers. Ts was measured with PT100 PRT temperature probes (Camp-bell Scientific, Logan, USA) at 2, 4, 8, 16, 30, and 60 cm depths, with two replicates at the open location and two repli-cates at the shaded location.θwas measured with 10 hs sen-sors (Decagon Devices, Inc., Washington, USA) at 5, 15, 30 and 60 cm depths, with four replicates at the open location and four replicates at the shaded location. The meteorologi-cal parameters were logged on CR1000 data loggers (Camp-bell Scientific, Logan, USA).
2.6 Data treatment
Eddy flux data were post-processed using EddySoft and Python 2.7. Half-hourly means were calculated by block-averaging the 20 Hz data; time lags between CO2/H2O sig-nals and vertical wind velocity were determined via cross-correlation analysis following Aubinet et al. (1999). When-ever the cross-correlation failed for the closed path analyser signals of the overstorey tower, the dependency on rH was used to determine the lag for the H2O signal according to Ibrom et al. (2007). High-frequency losses were compen-sated for with the use of inductances derived from co-spectral analysis (Eugster and Senn, 1995). The sectorial planar fit method was used for the coordinate rotation of wind vec-tors (Rebmann et al., 2012; Wilczak et al., 2001). For both towers, the moisture and cross-wind correction according to Schotanus et al. (1983) was applied, and the WPL correc-tion for flux density fluctuacorrec-tions was used for the CO2/H2O signals of the open path understorey sensor only (Leuning, 2007; Webb et al., 1980). The storage term of CO2was calcu-lated after Hollinger et al. (1994) and added to the turbulent CO2flux.
For the purposes of quality control, flags were determined for every half-hourly flux value, including the following tests: the 20 Hz data were scanned for exceeded physical lim-its, change rates and variances. The stationary test of Foken and Wichura (1996) was applied to the high-frequency data based upon a 50 % deviation criterion. On a half-hourly ba-sis, the integral turbulence characteristics (ITC) were calcu-lated following Thomas and Foken (2002) with a 30 %
devia-tion criterion. For the understorey tower, the parametrisadevia-tion of the ITC was recalculated according to the observations. A spike detection routine was used on the half-hourly data based on the absolute median deviation (Papale et al., 2006). All quality control tests were summed up in a simplified flag system referring to Mauder and Foken (2011).
The partitioning of the net CO2flux NEE into gross pri-mary productivity GPP and ecosystem respirationReco fol-lowed Lasslop et al. (2010), and the flux-gap filling was made according to Reichstein et al. (2005). Gaps were only filled up to a maximum gap length of 6 days.
The measured wind speed was used to calculate aerody-namic conductancega=u2∗/uwith the measured friction ve-locityu2∗ and horizontal wind speedu. Leaf temperature is estimated using measured air temperatureTaand measured sensible heat fluxH viaTl=Ta+H /(gaρacp), withρa be-ing the density andcpthe heat capacity of the air.
Ts and θ were integrated over the respective depths and the replicates of each site (open and shaded) are averaged. To calculate ecosystem representative Ts and θ, the open and shaded sites were weighted using time-dependentPgap, modelled from the daily course of the Sun inclination angle and the view zenith angle distribution ofPgap(Piayda et al., 2014).
The soil heat fluxGwas calculated from the averagedTs profiles. To estimate the energy balance closure of the tow-ers, the storage terms due to changes inTaand rH were added to the energy balance equation and plotted against the turbu-lent energy fluxes for daytime values with global radiation Rg>20 W m−2 (Mauder et al., 2013; Foken, 2008; Twine et al., 2000). The ratio was used to correct sensible heat H, latent heatλEand evapotranspiration ET flux, with the Bowen ratio being preserved.
2.7 Photosynthesis and stomatal conductance modelling
(no separate modelling of mesophyll conductance), assimi-lation sensitivitiesm, vapour pressure deficit sensitivitiesD0 of stomatal conductancesgsand optimum temperaturesTopt of the maximum electron transport ratesJmax. Three differ-ent Toptdescriptions were used for model comparison. The uncertainty of inferred parameters was estimated using boot-strap. See Appendix A for detailed model equations.
3 Results and discussion
Ecosystem fluxes for the hydrological years 2011 and 2012 (October 2010 to September 2012) are discussed in the fol-lowing. Flux time series are only compared when data avail-ability is given for both hydrological years, but not on an annual sum basis.
The dominant wind direction changes during the sea-son. Absolute values of flux measurements of the overstorey tower are thus not directly comparable to the absolute val-ues of the understorey tower, due to changing footprint area and the heterogeneity of the ecosystem. However, compar-isons of the intra-annual pattern of ecosystem fluxes between both towers and inter-annual changes between both the years 2011 and 2012 are possible, and are conducted in the follow-ing.
3.1 Meteorological and environmental conditions
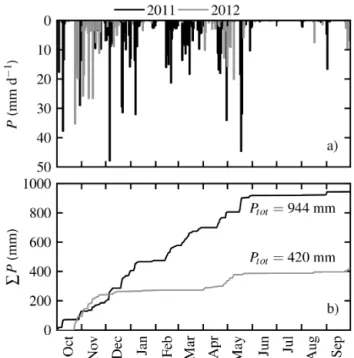
Water scarcity is the most important factor for ecosystem productivity in savannah-type ecosystems (Pereira et al., 2007). Drought severity and impact on vegetation depends on the timing and amount of precipitationP (Peñuelas et al., 2004). The hydrological years 2011 and 2012 mark, there-fore, exceptional years on the Iberian Peninsula. Precipita-tion P was 34 % higher in 2011 and 39 % lower in 2012 compared to the long-term average precipitation of about 680 mm (Jongen et al., 2013a) (Fig. 2a and b). In particu-lar, the winter of 2011/2012 was very dry over south-western Iberia, with only about 20 % of the long-term precipitation (Santos et al., 2013; Trigo et al., 2013). 2012 was the sec-ond driest year since 1950. The last negativeP anomaly of comparable severity occurred in the drought year 2004/2005 (Paredes et al., 2006; Santos et al., 2007).
The intra-annual pattern of precipitation has especially changed in 2012. Total annual reduction to the previous year (2011) was 495 mm, of which 68 % occurred during a long drought event in winter and early spring (December–March). The beginning of autumn precipitation was also delayed by almost a month in 2012. Winter precipitation is the most important for replenishing the soil and groundwater reser-voirs after the summer drought, but the winter precipitation period was shortened and interrupted for about 4 months in the 2012 hydrological year. These phenomena, i.e. reduced annual P, additional winter/spring drought, and prolonged summer drought, are characteristic of observed P extremes
Figure 2. (a)Daily sum of precipitationP for 2011 (black) and 2012 (grey).(b)Cumulative precipitationP for 2011 (black) and 2012 (grey) based on half-hourly data.
in the last decades (e.g. Guerreiro et al., 2013; Paredes et al., 2006).
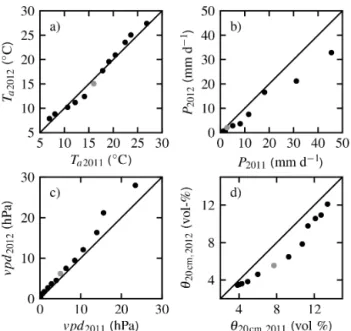
Figure 3.Quantile–quantile plot of important climate and environ-mental parameters for the years 2011 and 2012 based on daily aver-ages. Black dots represent the 0.01, 0.05, 0.1, 0.2, 0.3, 0.4, 0.6, 0.7, 0.8, 0.9, 0.95, and 0.99 quantiles of the respective distribution. Grey dots represent the 0.5 quantile.(a)Air temperatureTa,(b) precipita-tionP, and(c)vapour pressure deficit of the air vpd, each measured at 20 m height above the ground.(d)Soil moisture in the first 20 cm θ20 cm(root zone of understorey vegetation).
explained by a reduced contribution of local ET. This illus-trates the strong influence of ET on local hydrological con-ditions and the reinforcement of plant drought stress due to increased vpd.
The ecosystem, therefore, faced increased transpira-tional demand from higher atmospheric vpd combined with strongly decreased soil water availability, which resulted in high water stress for the trees but also for understorey vege-tation in 2012 compared to 2011. In the following, the effect of decreased water availability on the ecosystem water bud-get is discussed.
3.2 Drought influence on ecosystem water balance
Evapotranspiration ET is the major component of total wa-ter efflux in Mediwa-terranean ecosystems on an annual basis (Huxman et al., 2005). A comparably small amount of pre-cipitation is left for groundwater recharge and runoff. ET usually peaks in May before the onset of drought in the be-ginning of June in Mediterranean ecosystems (Vargas et al., 2013), but ecosystem evapotranspiration measured here at the overstorey tower ETo (Fig. 4b) peaked within the sum-mer drought period in June to July in 2011. This behaviour is typical of montadoecosystems with groundwater access of the trees (Paco et al., 2009; Pereira et al., 2007; David et al., 2007, 2004). EToshowed a slight peak shift towards spring in 2012, and was diminished by 26 % compared to 2011. The
Figure 4. (a)Maximum daily vapour pressure deficit vpdmax,(b)
daily sum of ecosystem evapotranspiration EToand(c)daily sum of understorey transpiration and soil evaporation ETufor 2011 (black) and 2012 (grey). Lines mark kernel regressions.
major decrease occurred in late spring and summer (March to September), although the major reduction in precipitation P occurred in winter and early spring (December to March) (Fig. 2b). When atmospheric demand (Fig. 4a) and energy input into the system increased in the spring of 2012, the Q. subertrees were not able to maintain transpiration T as high as in 2011. This indicates that, most likely, the deep soil and/or groundwater reservoirs were not refilled after the sum-mer of 2011 due to the dry winter as displayed by soil mois-ture observations at 60 cm in depth (Fig. 5b). However, the strongly diminished transpirationT led to a non-significant increase in maximum daily leaf temperatureTl,max of only 1.7◦C during the summer period of 2012. The small influ-ence of the reduced transpirational cooling on leaf temper-ature could be attributed to the high aerodynamic conduc-tancega in this open canopy, enabling comparably high en-ergy transport by sensible heat.
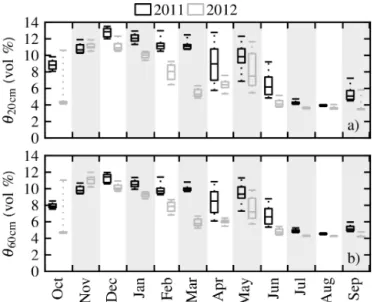
con-Figure 5.Box plot of monthly volumetric soil moisture(a)down to 20 cm depthθ20 cm(root zone of understorey vegetation) and(b)
down to 60 cm depthθ60 cm for the years 2011 (black) and 2012 (grey). The central line marks the median, and the box marks the 0.25 and 0.75 quantiles. Dashed lines mark the 0.05 and 0.95 quan-tiles. Data within a 2 day interval after a rain event were excluded.
ditions in 2012, in contrast to ecosystem ETo. The late onset of autumn precipitationP in October and, additionally, the missing recharge of upper soil moisture in winter (Fig. 5a) had an immediate impact on ETu, inhibiting plant growth and herbaceous transpiration (see Sect. 3.3). ETo, on the other hand, was influenced from March onwards only. The precip-itation events occurring in April and March 2012 (Fig. 2a) were not able to increase ETuup to the level of 2011, even though the atmospheric demand was slightly higher in 2012 (Fig. 3c). This can be explained on the one hand by very low soil moisture up to 20 cm in depth in October and from March onwards (Fig. 5a), which prevented soil evaporation, and, on the other hand, by the strong reduction in plant cover leading to a reduced contribution of herbaceous plant tran-spiration to ETu(see Sect. 3.3).
Precipitation effectiveness ETo/P indicates the amount of total precipitation P used for actual ecosystem evapotran-spiration ETo. ETo/P =86 % in 2011, which is high but comparable to other studies (Sala and Tenhunen, 1996; Piñol et al., 1991). However, the strong reduction in ecosystem evapotranspiration EToof 26 % in 2012 was vastly exceeded by the reduction in precipitation P of 54 %. This confirms recent results from Besson et al. (2014) showing a certain re-silience ofQ. subertree transpiration to annual water short-ages. This led to ETo/P of 122 % in 2012, which is, to our knowledge, the highest value reported for montado ecosys-tems so far. Hence, more water evaporated from the soil and was transpired by the trees than was brought into the ecosys-tem by precipitation. This was possible due to the deep soil or groundwater access of the trees maintaining a relatively
high transpiration rate throughout the summer, but it also left no water for groundwater replenishment or runoff generation (cf. Sala and Tenhunen, 1996).
Ecosytem productivity was markedly changed in 2012 due to the strong alterations in the water balance, which will be discussed in the following.
3.3 Understorey growth inhibition
The local understorey vegetation consists of native annual grasses and herbs (Jongen et al., 2013b; Dubbert et al., 2014a). The species are adapted to regular summer droughts by seed formation in spring before the onset of the summer droughts. They survive the dry periods as seeds and germi-nate again at the onset of autumn precipitation. Species abun-dance during spring thus depends on the amount of previous winter precipitation (Figueroa and Davy, 1991). The timing of the first autumn rains and rewetting of the soils is there-fore of great importance for germination success, the number of individuals and plant productivity (Jongen et al., 2013c; de Dios Miranda et al., 2009).
The understorey showed a typical annual cycle of gross primary productivity GPPu in 2011 (Fig. 6c) for savannah-type understorey vegetation, with the growth onset at the end of October (Ma et al., 2007). Carbon uptake peaked in Febru-ary to March and ended with the complete die back at the end of May. GPPu was strongly reduced, by 53 %, in 2012 compared to 2011. A small GPPupeak occurred along with precipitationP in April and May (Fig. 2). The reduction in GPPucan be explained by the very low soil moistureθ20 cm during October 2011 (Fig. 5a) due to the late onset of au-tumn precipitationP inhibiting seed germination.θ20 cmwas lower during the entire year of 2012 in comparison to 2011, particularly over the main growth period of the understorey vegetation from January to April. It was up to 52 % lower in March 2012, inhibiting further growth during winter/spring, and probably caused higher seedling mortality. Dubbert et al. (2014a) reported a maximum understorey vegetation cover in this ecosystem of about 80 % for 2011 that was reduced to about 25 % during the same period in 2012 (data for 2012 not shown). Similar effects on seedling germination and mor-tality were shown by others (Peco and Espigares, 1994; Es-pigares and Peco, 1995, 1993) under artificial rainfall treat-ments, and could be shown here under natural conditions.
3.4 Ecosystem productivity reduction
Most European Mediterranean savannah-like ecosystems show a severe drop in gross primary productivity during sum-mer (June to August) framed by a major peak in early spring (April to May) and a minor peak at the onset of autumn rain (Baldocchi et al., 2009).
(Fig. 6b). The amount of carbon gained was also higher com-pared to other Mediterranean evergreen woodlands, in partic-ular during the drought period in summer (Baldocchi et al., 2009; Ma et al., 2007). This annual pattern is rather more characteristic of temperate than semi-arid ecosystems. The Q. subertrees must have deep soil water or groundwater ac-cess in “regular” hydrological years, as shown in Sect. 3.2. This enabled them to maintain high productivity during the summer period despite high atmospheric water demand and low topsoil soil moisture.
Gross primary productivity GPPoshowed almost the same seasonal timing in 2012 compared to 2011, but was strongly reduced by 28 % (Fig. 6b). The major reduction took place in spring and summer (April to September) together with the reduction in evapotranspiration ETo (Fig. 4b) when at-mospheric demand was high and the emptied deep soil and groundwater reservoirs were unable to supply sufficient wa-ter (see Sect. 3.2) in 2012 compared to a regular year. This confirms the results of Pereira et al. (2007), who showed that drought effects on sclerophyllous trees became apparent only after the depletion of the deep soil and groundwater reserves. Despite a delayed bud burst in spring, a significant difference in leaf area index LAI could not be observed during the sum-mer period by the long-term leaf area index observations of Costa e Silva et al. (2014). Reductions in GPPoand ETocan hence be attributed solely to the leaf physiological responses discussed in Sect. 3.6.
3.5 Net ecosystem carbon exchange reduction
The net ecosystem carbon flux NEEowas strongly reduced by 38 % in the drought year of 2012 compared to the wet year of 2011 (Fig. 6a). The ecosystem was, however, a carbon sink in both years on an annual basis, even though reductions in precipitationP (Fig. 2) and gross primary productivity GPPo (Fig. 6b) were severe in 2012. Pereira et al. (2007) found similar behaviour in another montado ecosystem in Portu-gal. It still demonstrates here once more that precipitation is the dominant environmental variable for inter-annual change of NEE in semi-arid ecosystems, even in ecosystems with groundwater access. The reduction in carbon sink strength took place mainly in summer (May to September) along with the strongest reduction in gross primary productivity GPPo (Fig. 6b) caused by the lack of water availability for theQ. suber trees (cf. Sect. 3.2). GPPo exhibited a reduction of 28 % in 2012 compared to 2011, whileRecoshowed a reduc-tion of only 16 %.Recois mainly reduced in summer (July to September, data not shown), where soil moisture in the upper soil layerθ20 cmis low in both years due to the regular sum-mer drought (Fig. 5a), and inter-annual differences are small. NEEois therefore much more driven by GPPothan byReco in the ecosystem studied here. Reichstein et al. (2002) hy-pothesised that gross primary productivity GPPo should be less affected by drought than ecosystem respirationRecoin ecosystems with large subsoil water reservoirs, becauseReco
Figure 6. (a)Ecosystem net carbon exchange NEEo, (b) ecosys-tem gross primary productivity GPPo,(c)understorey gross primary productivity GPPu for 2011 (black) and 2012 (grey). Dots mark daily sums, and lines are kernel regressions.
depends on soil moisture and soil temperature, but it is hot and dry almost every summer in the Mediterranean, so that the lack of soil moisture in the upper soil inhibits soil res-piration during summer and largely reduces the contribution ofReco to inter-annual variations (e.g. Unger et al., 2009). This could also be the reason for the controversial finding of Valentini et al. (2000) thatReco becomes less important for variations of NEE with decreasing latitude in the Northern Hemisphere. It is, however, clear that vastly different GPPo andRecocannot be sustained over a long time;Recobase rates have to adapt in the long term.
3.6 Drought impact on tree physiology
1977; Tenhunen et al., 1987; Matthews and Boyer, 1984; Ehleringer and Cook, 1984). The photosynthesis appara-tus can further adapt to altered environmental conditions by changing the rigidity of the membranes, thus altering the temperature optimum of, for example, electron transport rates (Kattge and Knorr, 2007; von Caemmerer, 2000; Berry and Björkman, 1980).
There are different levels of complexity on how to describe photosynthesis in the literature. We focus here on Farquhar-type models of photosynthesis (Farquhar et al., 1980). There are three mechanisms that differ strongly between the differ-ent models of vegetation–atmosphere exchange: (1) the reac-tions to soil water stress, (2) the formulareac-tions used for the description of stomatal conductance, and (3) the reactions to heat stress. How plants react to water stress is probably the least well-described mechanism in photosynthesis mod-els. The different ecosystem and land surface models differ strongly in how they react to soil water stress. The widely used community land model CLM, for example, reduces ap-parent carboxylation efficiencyVc,maxunder drought (Oleson et al., 2010), which then indirectly reduces stomatal conduc-tance as well, while the ORCHIDEE land surface scheme or the BEPS model down-regulate stomatal conductance di-rectly, leaving Vc,max unchanged (Liu et al., 2014; Krinner et al., 2005; Verbeeck et al., 2011).
There is also a great variety of descriptions of stomatal conductance (cf. Damour et al., 2010). Most large-scale mod-els apply the formulation of Ball et al. (1987) though, the so-called Ball–Berry or, sometimes, Ball–Woodrow–Berry model (cf. Eq. A12). Leuning (1995) argued that stomata under controlled conditions react to vapour pressure deficit rather than relative humidity, and proposed an alternative form of the Ball–Berry model (cf. Eq. A11), the so-called Leuning model or, sometimes, Ball–Berry–Leuning formu-lation, but the photosynthesis models also differ in their re-actions to heat stress. The physiological literature is still dis-cussing whether or not heat only changes thylakoid mem-brane properties, limiting electron transport (von Caem-merer, 2000; June et al., 2004), or whether heat also inhibits enzyme activities, i.e. also carboxylation rates (Medlyn et al., 2002; Kattge and Knorr, 2007).
Gross primary productivity GPPo and evapotranspiration ETo were modelled here for the period May to September to investigate drought impact onQ. subertree physiology on the ecosystem scale and further test the different model for-mulations described above. Differences between both years were most prominent from May to September, understorey vegetation had already vanished, and soil evaporation was low compared to tree transpiration (Fig. 4c).
The following discussion includes the question of (1) whether a down-regulation of carboxylation efficiencyVc,max only or stomatal sensitivity monly is sufficient to describe the ecosystem behaviour in both years. (2) It evaluates the performance of the two prominent stomatal conductance for-mulations. (3) It compares different representations of
photo-synthetic temperature dependencies. (4) It discusses possible reasons for down-regulation of stomatal conductancegs and carboxlationVc,max, (5) disentangling the causes of down-regulation of stomatal conductance gs. (6) The unexpected change in optimal temperatureTopt between the 2 years is discussed.
First, GPPo and ETo were modelled by either allowing the model to adapt each day only (Vc,max) or the slopemof the Ball–Berry stomatal conductance formulation only (Ball et al., 1987) (Eq. A12). The model was not able to repro-duce the observations with sufficient performances in both cases, especially in 2012. The goodness of fit to the observed data steadily decreased with ongoing summer drought. GPPo and ETocould be successfully modelled if both,Vc,max and m, were allowed to adapt daily to changing environmental conditions, leading to constantly high Nash–Sutcliffe model efficiencies of εGPPo=0.81 and εETo=0.89 for 2011 and εGPPo =0.80 andεETo=0.76 for 2012.
Second, the same model calibration experiment was per-formed with the Leuning model of stomatal conductance (Le-uning, 1995) (Eq. A11). The Leuning model has, however, an additional model parameterD0which describes the sensitiv-ity of the stomata to changes in vapour pressure deficit vpd. The Leuning model showed comparably high model perfor-mances to the Ball–Berry model in both years. When the uning model was used in earlier studies (e.g. Wang and Le-uning, 1998),D0was fixed to a constant value. This implies that stomatal conductance sensitivity to vpd needs always to change similarly to the sensitivity to assimilation. Model performance decreased considerably if D0 was fixed here. This is becausemandD0are highly correlated in the Leun-ing model (cf. Fig. 7b and d). This strict couplLeun-ing is likely incorrect here, since daily maximum vpd during the sum-mer drought period was not significantly different between both years (only 1.3 hPa increase on average), but a strong decrease in Vc,max could be observed (see below). Conse-quently, a decrease in model performance occurred when D0was set constant. Enabling theQ. subertrees to regulate stomatal response to vpd and assimilationAseparately was necessary for explaining observed GPPoand ETo.
The first two points illustrate that the plants needed to regulate their potency of possible carbon assimilation, but wanted to increase how swift stomata react to changes. The reduction in the maximum carboxylation rateVc,max, though, was about 43 %, while the increase in the slopemwas about 9 % or 29 %, depending on whether the calculation followed Ball et al. (1987) or Leuning (1995), respectively. The in-crease inmis not significant when the bootstrapped uncer-tainty is considered. Still, a significant overall decrease in stomatal conductancegsof about 37 % was observed.
Ru-Figure 7. Daily values for(a)apparent maximum carboxylation rate at 25◦CVc,max25,(b)assimilation sensitivity parametermLof the Leuning model,(c)assimilation sensitivity parametermBBof the Ball–Berry model,(d)vapour pressure deficit sensitivity parameterD0,(e)
fractionmL/(1+(vpd/D0))relating assimilationAand stomatal conductancegs,(f)daily median stomatal conductance for water vapour gs,h during daytime, and(g)optimal temperature of electron transportTopt. The model is fitted to median daily cycles of gross primary productivity GPPoand evapotranspiration EToof theQ. subertrees in a 31 day long moving window for the summer period of 2011 (solid line, dark uncertainty band) and 2012 (dashed, light uncertainty band).
bisco enzyme and the maximum electron transport rateJmax by a peaked function, according to Johnson et al. (1942) (Eq. A7). An increase in enzyme activity with temperature is followed by a decrease above an optimum temperature Topt due to enzyme deactivation (case 1). Von Caemmerer (2000), among others, rather attributed a possible decrease in the activity of the photosynthetic apparatus at high temper-atures to thylakoid membrane properties only, limiting elec-tron transport and thus changing with leaf temperature, so onlyJmaxis down-regulated above an optimum temperature Topt(Eq. A7), butVc,maxincreases monotonically with a typ-ical Arrhenius-type function (Eq. A6, case 2). This was sim-plified by June et al. (2004) using a Gaussian temperature dependency instead of the original formulation (Eq. A9, case 3). Here, all cases showed comparable model performances, and no apparent differences in GPPoand ETocould be no-ticed. Thus, neither case 1 nor case 2 could be falsified here. Case 1 to case 3, however, show a decreasing demand for parametrisation (case 1: six, case 2: four, and case 3: three pa-rameters). Despite the entropy factors of carboxylation1SV
and electron transport1SJ (case 1 and case 2) and optimum
temperatureTopt(case 3), all parameters were fixed to liter-ature values (Table 1). Case 3, although containing only one parameter for optimisation like case 2, showed a more robust computational performance, with the fastest optimisation by
the Nelder–Mead algorithm (Nelder and Mead, 1965) among all cases.
Table 1.Parameters used in the photosynthesis–stomatal conductance model. The offset parameterbwas estimated first with an optimisation on the entire data set and then set constant in following model runs.
Parameter Value Unit Source
α 0.28 – Beerling and Quick (1995) b 4300×10−6 mol(H2O)m−2s−1 Site average
EC 59 356 J mol−1 Farquhar et al. (1980) EJmax 35 870 J mol−1 Medlyn et al. (2002) EO 35 948 J mol−1 Farquhar et al. (1980) ERd 50 967 J mol−1 Collatz et al. (1992) EVc,max 58 520 J mol−1 Farquhar et al. (1980)
HdJ 220 000 J mol−1 von Caemmerer (2000)
HdV 200 000 J mol−1 Medlyn et al. (2002)
KC25 460×10−6 mol(CO
2)mol(air)−1 Farquhar et al. (1980) KO25 0.33 mol(O2)mol(air)−1 Farquhar et al. (1980) Oi 0.21 mol(O2)mol(air)−1 Farquhar et al. (1980) 18 ◦C June et al. (2004)
et al., 2007; Oliveira et al., 1992). Although transpirational cooling of leaves should have been reduced due to limited stomatal conductance, the daily maximum leaf temperature Tl,maxincreased by only 1.7◦C in 2012 compared to 2011 (Sect. 3.2), so that temperature-based damage of enzymes relevant for photosynthesis is unlikely. The CO2influx into the leaves was, however, heavily reduced under the drought conditions in 2012. Energy utilisation is thus limited, while incoming photosynthetically active radiation PAR in 2012 was comparably high to 2011 (see Sect. 3.1). It is there-fore very likely that the main reason for the Q. subertrees down-regulating the maximum carboxylation rateVc,max by 43 % (Fig. 7a) was to avoid over-excitation and photodam-age (Demmig-Adams and Adams, 1992; Long et al., 1994; Werner et al., 2002). However, this effect may have been en-forced by decreased nitrogen availability during the leaf de-velopment phase in late spring caused by reduced soil water and thus nitrogen solubility in 2012 (Fig. 5a and b), poten-tially changing leaf nitrogen status and permanently reduc-ing photosynthetic capacity in 2012 compared to 2011 (Vaz et al., 2010). A possible indication of a permanent reduc-tion inVc,maxis thatgstends to converge to the same value at the end of the drought period in both years (Fig. 7f), so that leaf-internal CO2 availability should have approached comparable values as well.Vc,maxremained, however, down-regulated permanently. A simultaneous reduction in Vc,max by 37 % (Fig. 7a) and an increase inm(9 or 29 %, depending on whethergswas calculated following Ball et al. (1987) or Leuning (1995), Fig. 7b and c) were observed. In the case of a drought spell like 2012, the Q. suber trees responded with both, stomatal limitation as well as down-regulation of assimilation, strongly altering the entire ecosystem function-ing, which was observed in different semi-arid ecosystems before (Reichstein et al., 2003; Egea et al., 2011; Zhou et al., 2013).
Fifth, the use of the Leuning (1995) model with vari-able D0 allowed one to disentangle the different impacts ongs. Intra-annually, stomatal conductance showed a much stronger sensitivity to vpd (Fig. 7d) than to variations in as-similation (Fig. 7e). Between both years,m/(1+(vpd/D0)) increased only slightly, by 10 %, as a consequence of a slightly stronger reduction in Vc,max than in gs (43 and 37 %, respectively). This displays the strong resilience of sclerophyllous tree species likeQ. suberto drought, main-taining a water use efficiency comparable to regular years (Zhou et al., 2013). The impact of vpd ongs was, however, weakened in 2012 (reduction inD0by 37 %; not significant), sincegs was generally reduced at comparable vpd.m com-pensated for fluctuations inD0(Fig. 7b and d) to yield the observed robustness to assimilation. The observed high intra-annual robustness indicates that these Mediterranean species are adapted to maintain a stable operational point (Werner and Máguas, 2010).
In summary, theQ. subertrees responded to the drought year 2012 with a down-regulation of carboxylation efficiency and a decreased optimal temperature of photosynthesis. They counteracted this reduced carbon sequestration with a better responsiveness of the stomata. These plant responses were caused neither by a higher vapour pressure deficit, nor by leaf temperatures, nor by a depletion of upper soil moisture, but they were most probably triggered by a strong deple-tion of deep soil or groundwater due to the addideple-tional winter drought.
The combined model of photosynthesis and stomatal con-ductance was unable to reproduce the observed carbon as-similation and evapotranspiration if only one reaction was considered, i.e. either in the photosynthetic apparatus or in stomatal conductance. It needed to adapt parameters in both sub-modules, i.e. a strong reduction in carboxylation efficiency and a smaller increase in stomatal sensitivity. Earlier model–data approaches had shown that combined photosynthesis–stomatal conductance models need to adapt both parts in times of drought, but they always predicted decreases in carboxylation efficiency and stomatal sensitiv-ity. However, the modelling performed here could not dis-tinguish between different model formulations found in the literature, i.e. the stomatal conductance formulations of Ball– Berry vs. Leuning and the different formulations of optimal photosynthetic temperatures.
3.7 Future development
It is expected that the trend of decreasing total annual precip-itation and alteration of precipprecip-itation patterns on the Iberian Peninsula, namely occurrences of additional winter/spring droughts, will continue with proceeding climate change (Bussotti et al., 2013; Guerreiro et al., 2013; Hulme et al., 1999). Such severe drought periods might occur at a higher frequency (Field et al., 2012; Heimann and Reichstein, 2008; Granier et al., 2007; Miranda et al., 2002), thereby affecting the ecosystem water balance and productivity (Chaves et al., 2002; Fischer et al., 2002). If precipitation patterns similar to 2012 occur more often, then a sustainable depletion of local groundwater reservoirs as well as water storage basins might be expected. This will strongly affect local agriculture that relies on groundwater for the deep-rooted cork-oak trees and otherwise uses irrigation water from storage basins. The soil seed bank of native understorey plants may also deplete in the long term due to a shorter life cycle and reduced seed formation (Jongen et al., 2013c; Peñuelas et al., 2002, 2004; Gordo and Sanz, 2005). A shift in species composition is likely (de Dios Miranda et al., 2009), but could not be ob-served in this ecosystem in a study by Dubbert et al. (2014a, 2012 data not shown) during the drought year 2012 itself. However, some effects such as tree mortality may only be evident in the long term after multiple, consecutive drought years (David et al., 2004; Bussotti et al., 2013).
4 Conclusions
We reported on the ecosystem fluxes of a savannah-type cork-oak woodland under extreme hydrological conditions and altered precipitationP patterns. We analysed the effects of drought in the year 2012 compared to the wet year 2011 on evapotranspiration and gross primary productivity of a mon-tadoecosystem and its overstorey and understorey compo-nents. We additionally analysed physiological reactions of theQ. subertrees.
Appendix A: Photosynthesis–stomatal conductance model
The entire canopy was separated into a sunlit and shaded part with the fraction of sunlit leaves as
fs=1−exp(−KLAI)
KLAI , (A1)
where LAI (m2
leafm−ground2 ) is the leaf area index and K= G (β) /cos(β), withGbeing the angular-dependent leaf pro-jection function and β (◦) being the sun zenith angle. The shaded fraction of the canopy equals(1−fs). Carbon assim-ilation A(mol(CO2)m−2s−1) was modelled for each frac-tion with the Farquhar et al. (1980) model in the form of Knorr (2000) and enhanced by a smooth minimum function smin:
A=smin{JC;JE;η} −Rd (A2)
with the carboxylation-limited rateJC(mol(CO2)m−2s−1), the electron transport-limited rate JE (mol(CO2)m−2s−1) and mitochondrial respiration Rd (mol(CO2)m−2s−1). The smoothing parameterηwas set to 0.9. The Rubisco-limited rateJCwas described by
JC=Vc,max Ci−Ŵ⋆ Ci+KC
1+Oi
KO
, (A3) with maximum carboxylation rate Vc,max (mol(CO2)m−2s−1), CO2 concentration inside the stomatal cavity Ci (mol(CO2)mol(air)−1), CO2 com-pensation point Ŵ⋆ (mol(CO2)mol(air)−1) (set to leaf
temperature Tl×1.7×10⁻⁶), and Michaelis–Menten constants for CO2 KC (mol(CO2)mol(air)−1) and O2 KO (mol(O2)mol(air)−1), respectively.Oi(mol(O2)mol(air)−1) is the stomatal cavity O2concentration taken as 21 %. The RuBP-limited CO2assimilation rateJEwas described by JE=J Ci−Ŵ⋆
4(Ci+2Ŵ⋆)
, (A4)
with the rate of electron transportJ(mol m−2s−1) as J =Jmax
αPAR q
Jmax2 +α2PAR2
, (A5)
with maximum electron transport rate Jmax (mol(CO2)m−2s−1), quantum yield of electron trans-port α and incident photosynthetically active photon flux density PAR (mol(quanta)m−2s−1). The sunlit fraction of leaves fs receives direct as well as diffuse incoming radi-ation, whereas the shaded fraction of leaves (1−fs)only receives diffuse radiation. The temperature dependencies of KC,KOandRdwere modelled using Arrhenius functions: f (Tl)=K25 exp
EK(Tl−25) 298R(Tl+273)
, (A6)
with the base rates KC25 (mol(CO2)mol(air)−1), KO25
(mol(O2)mol(air)−1), Rd25 (mol(CO2)m−2s−1) at 25◦C and activation energiesEC,EO, andERd(J mol−1), respec-tively.Tl(◦C) is leaf temperature andR(J mol−1K−1) is the universal gas constant.
Temperature dependencies ofVc,maxandJmaxwere treated by three test cases with decreasing complexity and computa-tional demand. Case 1, according to Medlyn et al. (2002) and Kattge and Knorr (2007):Vc,max andJmax were both mod-elled using a modification of the Arrhenius function (Eq. A6) showing a peak at optimum temperature followed by a de-cline with increasingTl:
f (Tl)=Kmax25 exp
EK(Tl−25) 298R(Tl+273)
(A7) 1+exp2981SK−HdK
298R
1+exp(Tl+273)1SK−HdK
(Tl+273)R
,
with base rates Vc,max25 andJmax25 at 25◦C, respectively. 1SVand1SJ(J mol−1K−1) are the entropy factors and HdV
and HdJ (J mol−1) are the deactivation energies of Vc,max andJmax, respectively. Case 2, according to von Caemmerer (2000): only the temperature dependency ofJmaxwas mod-elled with the peaked function (Eq. A7), butVc,maxwas mod-elled with the simple Arrhenius function (Eq. A6). Case 3, according to June et al. (2004):Vc,max was modelled with the simple Arrhenius function, butJmaxwas modelled with a simple Gaussian temperature dependency:
Jmax =Jopt exp −
(Tl−Topt)2 2
!
=Jmax25 exp
(25−Topt)2−(Tl−Topt)2 2
!
, (A8)
with optimum temperatureTopt (◦C) and the empirical pa-rameter=18◦C.
Leaf surface CO2 concentration Cs
(mol(CO2)mol(air)−1) and H2O concentration Ws (mol(H2O)mol(air)−1) were calculated via
Cs=Ca−A 1
ga+ 1.3
gb
(A9)
Ws=Wa−ETmod 1
ga+ 1 gb
(A10) with the atmospheric CO2 concentration Ca (mol(CO2)mol(air)−1), aerodynamic conductance ga (mol(air)m−2s−1), leaf boundary layer conductance g
b (mol(air)m−2s−1), atmospheric H2O concentration W
(2002) viagb=200√d/u, whered is the measured leaf size anduis the observed wind speed.
Stomatal conductance for water vapourgs,hwas calculated with the formulation of Leuning (1995):
gs,h=m A
(Cs−Ŵ⋆)
1+Wi−Ws
D0
+b, (A11)
with the slope m (mol(H2O)mol(air)−1), the sensitivity parameter of vapour pressure deficit D0 (mol(H2O)mol(air)−1) and the offset b (mol(H2O)m−2s−1). The description of Ball et al. (1987) was also tested:
gs,h=mArHs Cs +
b (A12)
with relative humidity at the leaf surface rHs(–). Total con-ductances for CO2gc,cand H2Ogc,hwere then derived by
gc,c= 1
1.56
gs,h +
1
ga+
1.3
gb
(A13)
gc,h= 1 1
gs,h+
1
ga+
1
gb
. (A14)
CO2concentration in the stomatal cavity was thus calculated by
Ci=Ca− A gc,c
, (A15)
and modelled transpiration ETmod (mol(H2O)m−2s−1) and gross primary productivity GPPmod(mol(CO2)m−2s−1) for both, the sunlit and shaded fractions of the canopy, could be derived by
ETmod=gc,h(Wi−Wa) (A16)
GPPmod=gc,c(Ca−Ci)+Rd. (A17) The optimum temperature Topt of the maximum electron transport rateJmaxwas calculated in cases 1 and 2 accord-ing to von Caemmerer (2000):
Topt= HdJ
1SJ−Rlog
E Jmax
HdJ−EJmax
−273.15. (A18) The entire calculation was iterated with initial values of ETmod=0,gs,h=1 andCi=0.8Ca, until a conversion ofCi was achieved for every time step. The modelled ETmod and GPPmodof the sunlit and shaded parts of the canopy were av-eraged usingfsand fitted against measured ET and GPP un-der variation ofVc,max25,1SJ,mandD0. Constant
Appendix B: Nomenclature
A (mol m−2s−1) Carbon assimilation
b (mol H2O m−2s−1) Leuning model parameter (offset) D0 (hPa) Leuning model parameter (vpd sensitivity)
ETo (mm d−1) Evapotranspiration measured at the overstorey tower ETu (mm d−1) Evapotranspiration measured at the understorey tower ETo/P (%) Precipitation effectiveness
εGPPo (–) Average Nash–Sutcliffe model efficiency for GPPo εETo (–) Average Nash–Sutcliffe model efficiency for ETo fs (–) Fraction of sunlit leaves
GPP (g C m−2d−1) Gross primary productivity
GPPo (g C m−2d−1) Gross primary productivity measured at the overstorey tower
GPPu (g C m−2d−1) Gross primary productivity measured at the under-storey tower
gs,h (mol H2O m−2s−1) Stomatal conductance for water vapour gs,c (mol CO2m−2s−1) Stomatal conductance for carbon LAI (m2leafm−2
ground) Leaf area index
m (mol H2O mol air−1) Leuning model parameter (slope) NEE (g C m−2d−1) Net ecosystem carbon exchange
NEEo (g C m−2d−1) Net ecosystem carbon exchange measured at the over-storey tower
NEEu (g C m−2d−1) Understorey and soil net carbon exchange P (mm) Precipitation
p (hPa) Atmospheric pressure
PAR (µmol m−2s−1) Photosynthetically active radiation Pgap (–) Tree canopy gap probability Reco (g C m−2d−1) Ecosystem respiration rH (%) Relative air humidity
rHs (%) Relative air humidity at the leaf surface θ (%) Soil moisture
T (mm d−1) Transpiration Ta (◦C) Air temperature Tl (◦C) Leaf temperature
Tl,max (◦C) Maximum daily leaf temperature
Topt (◦C) Optimum temperature of electron transport Ts (◦C) Soil temperature
Vc,max (µmol m−2s−1) Apparent maximum carboxylation rate vpd (hPa) Air vapour pressure deficit
Acknowledgements. We thank the Herdade da Machoqueira do Grou the permission to establish our field site. We thank Tino Rau for providing data processing code and Sebastian Gimper for technical support. We thank Juliane Mai for help with mathematics. We thank Joaquim Pinto for information on meteorology. This study was funded by the Deutsche Forschungsgemeinschaft (WATERFLUX project: WE 2681-61; CU 173/2-1) and kindly supported by the Helmholtz Impulse and Networking Fund through the Helmholtz Interdisciplinary Graduate School for Environmental Research (HIGRADE) (Bissinger and Kolditz, 2008).
The service charges for this open-access publication have been covered by a Research Centre of the Helmholtz Association.
Edited by: J. Xiao
References
Aubinet, M., Grelle, A., Ibrom, A., Rannik, Ü., Moncrieff, J., Fo-ken, T., Kowalski, A., Martin, P., Berbigier, P., Bernhofer, C., Clement, R., Elbers, J., Granier, A., Grünwald, T., Morgen-stern, K., Pilegaard, K., Rebmann, C., Snijders, W., Valentini, R., and Vesala, T.: Estimates of the Annual Net Carbon and Water Exchange of Forests: The EUROFLUX Methodology, vol. 30 of Adv. Ecol. Res., Academic Press, 113–175, doi:10.1016/S0065-2504(08)60018-5, 1999.
Baldocchi, D. D., Ma, S., Rambal, S., Misson, L., Ourcival, J.-M., Limousin, J.-M., Pereira, J., and Papale, D.: On the differential advantages of evergreenness and deciduousness in mediterranean oak woodlands: a flux perspective, Ecol. Appl., 20, 1583–1597, doi:10.1890/08-2047.1, 2009.
Ball, J., Woodrow, L. E., and Beny, J. A.: A model predicting stom-atal conductance and its contribution to the control of photosyn-thesis under different environmental conditions, in: Progress in Photosynthesis Research, edited by: Biggins, J., vol. 4, Nijhoff, Dordrecht, 221–224, 1987.
Beer, C., Reichstein, M., Tomelleri, E., Ciais, P., Jung, M., Car-valhais, N., Rödenbeck, C., Arain, M. A., Baldocchi, D., Bo-nan, G. B., Bondeau, A., Cescatti, A., Lasslop, G., Lindroth, A., Lomas, M., Luyssaert, S., Margolis, H., Oleson, K. W., Roup-sard, O., Veenendaal, E., Viovy, N., Williams, C., Wood-ward, F. I., and Papale, D.: Terrestrial gross carbon dioxide up-take: global distribution and covariation with climate, Science, 329, 834–838, doi:10.1126/science.1184984, 2010.
Beerling, D. and Quick, W.: A new technique for estimating rates of carboxylation and electron transport in leaves of C3plants for use in dynamic global vegetation models, Glob. Change Biol., 1, 289–294, doi:10.1111/j.1365-2486.1995.tb00027.x, 1995. Berry, J. and Björkman, O.: Photosynthetic response and adaptation
to temperature in higher plants, Ann. Rev. Plant Physio., 31, 491– 543, doi:10.1146/annurev.pp.31.060180.002423, 1980.
Besson, C. K., do Vale, R. L., Rodrigues, M. L., Almeida, P., Herd, A., Grant, O. M., David, T. S., Schmidt, M., Otieno, D., Keenan, T. F., Gouveia, C., Mériaux, C., Chaves, M. M., and Pereira, J. S.: Cork oak physiological responses to manipulated water availability in a Mediterranean woodland, Agr. Forest
Meteorol., 184, 230–242, doi:10.1016/j.agrformet.2013.10.004, 2014.
Beyschlag, W., Lange, O., and Tenhunen, J. D.: Photosynthesis and water relations of the mediterranean evergreen sclerophyll Arbu-tus unedoL. throughout the year at a site in Portugal. I. diurnal courses of carbon dioxide gas exchange and transpiration under natural conditions, Flora, 178, 409–444, 1986.
Bissinger, V. and Kolditz, O.: Helmholtz Interdisciplinary Graduate School for Environmental Research (HIGRADE), GAIA, 1, 71– 73, 2008.
Bonan, G. B.: Ecological Climatology: Concepts and Applications, Cambridge University Press, 2002.
Bugalho, M. N., Caldeira, M. C., Pereira, J. S., Aronson, J., and Pausas, J. G.: Mediterranean cork oak savannas require human use to sustain biodiversity and ecosystem services, Front. Ecol. Environ., 9, 278–286, doi:10.1890/100084, 2011.
Bussotti, F., Ferrini, F., Pollastrini, M., and Fini, A.: The chal-lenge of Mediterranean sclerophyllous vegetation under climate change: from acclimation to adaptation, Environ. Exp. Bot., 103, 80–98, doi:10.1016/j.envexpbot.2013.09.013, 2013.
Chaves, M. M., Pereira, J. S., Maroco, J., Rodrigues, M. L., Ri-cardo, C. P. P., Osório, M. L., Catvalho, I., Faria, T., and Pinheiro, C.: How plants cope with water stress in the field? Photosynthesis and growth, Ann. Bot.-London, 89, 907–916, doi:10.1093/aob/mcf105, 2002.
Ciais, P., Reichstein, M., Viovy, N., Granier, A., Ogee, J., Allard, V., Aubinet, M., Buchmann, N., Bernhofer, C., Carrara, A., Cheval-lier, F., De Noblet, N., Friend, A. D., Friedlingstein, P., Grun-wald, T., Heinesch, B., Keronen, P., Knohl, A., Krinner, G., Loustau, D., Manca, G., Matteucci, G., Miglietta, F., Ourci-val, J. M., Papale, D., Pilegaard, K., Rambal, S., Seufert, G., Soussana, J. F., Sanz, M. J., Schulze, E. D., Vesala, T., and Valentini, R.: Europe-wide reduction in primary productivity caused by the heat and drought in 2003, Nature, 437, 529–533, doi:10.1038/nature03972, 2005.
Collatz, G. J., Ribas-Carbo, M., and Berry, J. A.: Cou-pled photosynthesis-stomatal conductance model for leaves of C4 plants, Aust. J. Plant Physiol., 19, 519–538, doi:10.1071/PP9920519, 1992.
Costa, A. C., Santos, J. A., and Pinto, J. G.: Climate change scenar-ios for precipitation extremes in Portugal, Theor. Appl. Climatol., 108, 217–234, doi:10.1007/s00704-011-0528-3, 2012.
Costa e Silva, F., Correia, A. C., Correia, A. V., Piayda, A., Dub-bert, M., Werner, C., David, J. S., and Pereira, J. S.:Quercus suberphenological adjustments to seasonal water availability: in-fluence on net ecosystem exchange, Agr. Forest Meteorol., sub-mitted, 2014.
Cowan, I.: Stomatal Behaviour and Environment, Academic Press, available at: http://books.google.com.au/books?id= GYhvNQAACAAJ (last access: 1 July 2014), 1977.
Damour, G., Simonneau, T., Cochard, H., and Urban, L.: An overview of models of stomatal conductance at the leaf level, Plant Cell Environ., 33, 1419–1438, doi:10.1111/j.1365-3040.2010.02181.x, 2010.
David, T. S., Henriques, M. O., Kurz-Besson, C., Nunes, J., Va-lente, F., Vaz, M., Pereira, J. S., Siegwolf, R., Chaves, M. M., Gazarini, L. C., and David, J. S.: Water-use strategies in two co-occurring Mediterranean evergreen oaks: sur-viving the summer drought, Tree Physiol., 27, 793–803, doi:10.1093/treephys/27.6.793, 2007.
de Dios Miranda, J., Padilla, F. M., and Pugnaire, F. I.: Re-sponse of a Mediterranean semiarid community to changing patterns of water supply, Perspect. Plant Ecol., 11, 255–266, doi:10.1016/j.ppees.2009.05.001, 2009.
Demmig-Adams, B. and Adams, W. W.: Photoprotection and other responses of plants to high light stress, Ann. Rev. Plant Biol., 43, 599–626, 1992.
De Pury, D. G. G. and Farquhar, G. D.: Simple scaling of photo-synthesis from leaves to canopies without the errors of big-leaf models, Plant Cell Environ., 20, 537–557, doi:10.1111/j.1365-3040.1997.00094.x, 1997.
Dubbert, M., Mosena, A., Piayda, A., Cuntz, M., Correia, A., Pereira, J. S., and Werner, C.: Influence of tree cover on herba-ceous layer development and fluxes in a Portuguese cork oak woodland, Acta Oecol., 59, 35–45, 2014a.
Dubbert, M., Piayda, A., Cuntz, M., Correia, A. C., Costa e Silva, F., Pereira, J. S., and Werner, C.: Stable oxygen isotope and flux par-titioning d emonstrates understory of an oak savanna contributes up to half of ecosystem carbon and water exchange, Frontiers in Plant Science, 5, 1–16, doi:10.3389/fpls.2014.00530, 2014b. Duckstein, L.: Multiobjective optimization in structural design: the
model choice problem, in: New Directions in Optimum Struc-tural Design, edited by: Atrek, E., John Wiley, 1981.
Egea, G., Verhoef, A., and Vidale, P. L.: Towards an improved and more flexible representation of water stress in coupled photosynthesis–stomatal conductance models, Agr. Forest Me-teorol., 151, 1370–1384, doi:10.1016/j.agrformet.2011.05.019, 2011.
Ehleringer, J. R. and Cook, C. S.: Photosynthesis in encelia farinosa gray in response to decreasing leaf water potential, Plant Phys-iol., 75, 688–693, doi:10.1104/pp.75.3.688, 1984.
Espigares, T. and Peco, B.: Mediterranean pasture dynamics: the role of germination, J. Veg. Sci., 4, 189–194, 1993.
Espigares, T. and Peco, B.: Mediterranean annual pasture dynamics: impact of autumn drought, J. Ecol., 83, 135–142, 1995. Eugster, W. and Senn, W.: A cospectral correction model for
mea-surement of turbulent NO2flux, Bound.-Lay. Meteorol., 74, 321– 340, doi:10.1007/BF00712375, 1995.
Farquhar, G., Caemmerer, S., and Berry, J.: A biochemical model of photosynthetic CO2assimilation in leaves of C3species, Planta, 149, 78–90, doi:10.1007/BF00386231, 1980.
Farquhar, G. D. and Sharkey, T. D.: Stomatal conductance and photosynthesis, Ann. Rev. Plant Physio., 33, 317–345, doi:10.1146/annurev.pp.33.060182.001533, 1982.
Field, C., Barros, V., Stocker, T., Qin, D., Dokken, D., Ebi, K., Mastrandrea, M., Mach, K., Plattner, G.-K., Allen, S., Tig-nor, M., and Midgley, P. (Eds.): Managing the Risks of Ex-treme Events and Disasters to Advance Climate Change Adapta-tion, IPCC Special Reports, Cambridge University Press, Cam-bridge, available at: https://www.ipcc.ch/pdf/special-reports/ srex/SREX_Full_Report.pdf, 2012.
Figueroa, M. E. and Davy, A. J.: Response of Mediterranean grass-land species to changing rainfall, J. Ecol., 79, 925–941, 1991.
Fischer, G., van Velthuizen, H., Shah, M., and Nachtergaele, F. (Eds.): Global Agro-ecological Assessment for Agriculture in the 21st Century: Methodology and Results, International Institute for Applied Systems Analysis, 2002.
Foken, T.: The energy balance closure problem: an overview, Ecol. Appl., 18, 1351–1367, doi:10.1890/06-0922.1, 2008.
Foken, T. and Wichura, B.: Tools for quality assessment of surface-based flux measurements, Agr. Forest Meteorol., 78, 83–105, doi:10.1016/0168-1923(95)02248-1, 1996.
García-Barrón, L., Morales, J., and Sousa, A.: Characterisation of the intra-annual rainfall and its evolution (1837–2010) in the southwest of the Iberian Peninsula, Theor. Appl. Climatol., 114, 445–457, doi:10.1007/s00704-013-0855-7, 2013.
Gordo, O. and Sanz, J. J.: Phenology and climate change: a long-term study in a Mediterranean locality, Oecologia, 146, 484–495, doi:10.1007/s00442-005-0240-z, 2005.
Grace, J., José, J. S., Meir, P., Miranda, H. S., and Montes, R. A.: Productivity and carbon fluxes of tropical savannas, J. Biogeogr., 33, 387–400, doi:10.1111/j.1365-2699.2005.01448.x, 2006. Granier, A., Reichstein, M., Bréda, N., Janssens, I., Falge, E.,
Ciais, P., Grünwald, T., Aubinet, M., Berbigier, P., Bern-hofer, C., Buchmann, N., Facini, O., Grassi, G., Heinesch, B., Ilvesniemi, H., Keronen, P., Knohl, A., Köstner, B., Lager-gren, F., Lindroth, A., Longdoz, B., Loustau, D., Mateus, J., Montagnani, L., Nys, C., Moors, E., Papale, D., Peiffer, M., Pilegaard, K., Pita, G., Pumpanen, J., Rambal, S., Reb-mann, C., Rodrigues, A., Seufert, G., Tenhunen, J., Vesala, T., and Wang, Q.: Evidence for soil water control on car-bon and water dynamics in European forests during the ex-tremely dry year: 2003, Agr. Forest Meteorol., 143, 123–145, doi:10.1016/j.agrformet.2006.12.004, 2007.
Grant, O. M., Tronina, Ł., Ramalho, J. C., Kurz Besson, C., Lobo-do-Vale, R., Santos Pereira, J., Jones, H. G., and Chaves, M. M.: The impact of drought on leaf physiology of
Quercus suberL. trees: comparison of an extreme drought event with chronic rainfall reduction, J. Exp. Bot., 61, 4361–4371, doi:10.1093/jxb/erq239, 2010.
Guerreiro, S. B., Kilsby, C. G., and Serinaldi, F.: Analysis of time variation of rainfall in transnational basins in Iberia: abrupt changes or trends?, Int. J. Climatol., 34, 114–133, doi:10.1002/joc.3669, 2013.
Heimann, M. and Reichstein, M.: Terrestrial ecosystem car-bon dynamics and climate feedbacks, Nature, 451, 289–292, doi:10.1038/nature06591, 2008.
Hollinger, D. Y., Kelliher, F. M., Byers, J. N., Hunt, J. E., McSev-eny, T. M., and Weir, P. L.: Carbon dioxide exchange between an undisturbed old-growth temperate forest and the atmosphere, Ecology, 75, 134–150, 1994.
Hulme, M., Mitchell, J., Ingram, W., Lowe, J., Johns, T., New, M., and Viner, D.: Climate change scenarios for global impacts stud-ies, Global Environ. Chang., 9, S3–S19, doi:10.1016/S0959-3780(99)00015-1, 1999.