BGD
11, 10365–10417, 2014
Drought impact on Mediterranean
Quercus suber L.
woodland during extreme drought
A. Piayda et al.
Title Page
Abstract Introduction
Conclusions References
Tables Figures
◭ ◮
◭ ◮
Back Close
Full Screen / Esc
Printer-friendly Version
Interactive Discussion
Discussion
P
a
per
|
Discus
sion
P
a
per
|
Discussion
P
a
per
|
Discussion
P
a
per
|
Biogeosciences Discuss., 11, 10365–10417, 2014 www.biogeosciences-discuss.net/11/10365/2014/ doi:10.5194/bgd-11-10365-2014
© Author(s) 2014. CC Attribution 3.0 License.
This discussion paper is/has been under review for the journal Biogeosciences (BG). Please refer to the corresponding final paper in BG if available.
Drought impact on carbon and water
cycling in a Mediterranean
Quercus suber
L. woodland during the extreme drought
event in 2012
A. Piayda1, M. Dubbert2, C. Rebmann1, O. Kolle3, F. Costa e Silva4, A. Correia4, J. S. Pereira4, C. Werner2, and M. Cuntz1
1
Department Computational Hydrosystems, UFZ Helmholtz Centre for Environmental Research, Permoserstr. 15, 04318 Leipzig, Germany
2
Agroecosystem Research, BayCEER, University of Bayreuth, Universitätsstr. 30, 95447 Bayreuth, Germany
3
Field Experiments & Instrumentation, Max Planck Institute for Biogeochemistry, Hans-Knöll-Str. 10, 07745 Jena, Germany
4
BGD
11, 10365–10417, 2014
Drought impact on Mediterranean
Quercus suber L.
woodland during extreme drought
A. Piayda et al.
Title Page
Abstract Introduction
Conclusions References
Tables Figures
◭ ◮
◭ ◮
Back Close
Full Screen / Esc
Printer-friendly Version
Interactive Discussion
Discussion
P
a
per
|
Discus
sion
P
a
per
|
Discussion
P
a
per
|
Discussion
P
a
per
|
Received: 17 June 2014 – Accepted: 18 June 2014 – Published: 3 July 2014 Correspondence to: A. Piayda (arndt.piayda@ufz.de)
BGD
11, 10365–10417, 2014
Drought impact on Mediterranean
Quercus suber L.
woodland during extreme drought
A. Piayda et al.
Title Page
Abstract Introduction
Conclusions References
Tables Figures
◭ ◮
◭ ◮
Back Close
Full Screen / Esc
Printer-friendly Version
Interactive Discussion
Discussion
P
a
per
|
Discus
sion
P
a
per
|
Discussion
P
a
per
|
Discussion
P
a
per
|
Abstract
Savannah-type ecosystems account for 26–30 % of global gross primary productivity GPP with water being one of the major driving factors. In Europe, savannah-type wood-lands cover an area of about 1.5 million ha. Here, the recent past has shown a signifi-cant decrease of precipitationP in winter and spring as well as decrease of total annual
5
precipitation. Strong effects on local water balance and carbon sink strength have thus been reported due to changes in precipitation regime.
The objective of this study is to quantify the impact of the extreme drought event in 2012 on the water balance, gross primary productivity and carbon sink strength of a typical Portuguese cork-oak woodland (montado) compared to the wet year 2011.
10
Physiological responses of the dominant tree speciesQuercus suber (L.) are disen-tangled, employing combined photosynthesis and stomatal conductance modelling.
Precipitation effectiveness ET/P increased from 86 % in 2011 to 122 % in the dry year 2012 due to deep soil or ground water access of theQ. suber trees leaving no water for ground water replenishment. Understorey and overstorey GPP were strongly
15
reduced by 53 % and 28 %, respectively, in 2012 compared to 2011 due to the late onset of the autumn rains in 2011 and an additional severe winter/spring drought. However, the ecosystem was still a carbon sink in both years but with a 38 % re-duced sink strength under extreme drought in 2012 compared to 2011. The combined photosynthesis-stomatal conductance model yielded best results if it was allowed to
20
adjust photosynthetic and stomatal parameters simultaneously. If stomatal response was modelled with the Leuning approach, which allows for a different sensitivity to vapour pressure deficit, the stomatal model parameters were highly coupled. A change in either of the parameters needed to be compensated by the other to guarantee a sta-ble sensitivity of stomatal conductance to assimilation, independently from variations in
25
appar-BGD
11, 10365–10417, 2014
Drought impact on Mediterranean
Quercus suber L.
woodland during extreme drought
A. Piayda et al.
Title Page
Abstract Introduction
Conclusions References
Tables Figures
◭ ◮
◭ ◮
Back Close
Full Screen / Esc
Printer-friendly Version
Interactive Discussion
Discussion
P
a
per
|
Discus
sion
P
a
per
|
Discussion
P
a
per
|
Discussion
P
a
per
|
ent maximum carboxylation rate by 39 % in 2012 compared to 2011. Unexpectedly, the optimum temperature Topt of maximum electron transport rate decreased during the drought period, enhancing the susceptibility of the trees to high temperature stress during the summer.
Our results suggest that, if the trend of decreasing annual precipitation and changed
5
precipitation pattern on the Iberian Peninsula continues, sustained effects on local ground water reservoirs, understorey species composition and tree mortality have to be expected in the long term. To successfully model the effect of drought on the mon-tado ecosystem, variable apparent maximum carboxylation rateVc,max, stomatal con-ductance parametermand vapor pressure deficit sensitivity parameterD0need to be
10
incorporated in photosynthesis-stomatal conductance modelling.
1 Introduction
One of the typical semi-arid ecosystem in Europe is a savannah-type woodland (mon-tado), consisting of a sparse overstorey tree layer and a herbaceous understorey layer. During the biomass peak of the herbaceous plants in spring, the understorey layer
15
can provide a large contribution to the whole ecosystem water and carbon balance and thus, can play a significant role in the annual carbon and water budgets (Unger et al., 2009; Paco et al., 2009; Dubbert et al., 2014b). However, each layer responds differently to changes in precipitation depending on their life form (chamaephyte or therophyte) and access to different water reservoirs throughout the year (Paco et al.,
20
2009) including deep soil or ground water (David et al., 2004).
Montado ecosystems (span.: dehesa) cover an area of about 1.5 million ha in Eu-rope (Bugalho et al., 2011) and contribute together with savannah-type ecosystems on other continents about 30 % to global gross primary productivity GPP (Beer et al., 2010; Grace et al., 2006). The major driving factor of GPP inmontadoecosystems is
25
pre-BGD
11, 10365–10417, 2014
Drought impact on Mediterranean
Quercus suber L.
woodland during extreme drought
A. Piayda et al.
Title Page
Abstract Introduction
Conclusions References
Tables Figures
◭ ◮
◭ ◮
Back Close
Full Screen / Esc
Printer-friendly Version
Interactive Discussion
Discussion
P
a
per
|
Discus
sion
P
a
per
|
Discussion
P
a
per
|
Discussion
P
a
per
|
cipitation patterns show periodical summer droughts and evapotranspiration losses are high (Krishnan et al., 2012; Huxman et al., 2005).
In the recent past, precipitation shows a significant decrease of rain amount in Febru-ary and March as well as a decrease of total annual rainfall on the Iberian Peninsula (Guerreiro et al., 2013; García-Barrón et al., 2013; Mourato et al., 2010; Paredes et al.,
5
2006). A trend towards extreme events in the form of droughts is observed due to a more heterogeneous distribution of precipitation throughout the year (García-Barrón et al., 2013). These type of changes in precipitation regime have been reported to strongly affect local water balance (Rodrigues et al., 2011; Vaz et al., 2010; Grant et al., 2010) and carbon sink strength (Pérez-Ramos et al., 2013; Pereira et al., 2007;
10
Granier et al., 2007; Ciais et al., 2005) of ecosystems in semi-arid regions and are expected to increase with proceeding climate change (Bussotti et al., 2013; Guerreiro et al., 2013).
Species in semi-arid environments have developed vast structural and functional adaptations to regulate carbon assimilation and respiratory water loss (e.g. Tenhunen
15
et al., 1987; Werner et al., 1999). Considerable knowledge has been acquired on leaf-level physiological processes in the last three decades (e.g. Beyschlag et al., 1986; Sala and Tenhunen, 1996; Tenhunen et al., 1985, 1990; Werner et al., 2001), empha-sizing the role of ecophysiological adaptations to seasonality and summer drought in Mediterranean climate conditions. In these environments lack of precipitation often
in-20
teracts with excessive irradiance and high temperature further constraining leaf carbon fixation through photoinhibition during drought (Werner et al., 2001, 2002). Cork oaks strongly reduce transpirational water loss by stomatal closure in response to drought to avoid a critical level of dehydration and hydraulic failure (Oliveira et al., 1992; Tenhunen et al., 1984, 1987; Werner and Correia, 1996; Kurz-Besson et al., 2006).
25
BGD
11, 10365–10417, 2014
Drought impact on Mediterranean
Quercus suber L.
woodland during extreme drought
A. Piayda et al.
Title Page
Abstract Introduction
Conclusions References
Tables Figures
◭ ◮
◭ ◮
Back Close
Full Screen / Esc
Printer-friendly Version
Interactive Discussion
Discussion
P
a
per
|
Discus
sion
P
a
per
|
Discussion
P
a
per
|
Discussion
P
a
per
|
stomatal conductance can be modelled either reacting to relative humidity (Ball et al., 1987) or to vapour pressure deficit (Leuning, 1995). Also the determination of param-eters in individual descriptions is different among different authors. The sensitivity of stomatal conductance to vapor pressure, for example, is often taken as a fixed value while determining only the other parameters in the coupled stomatal
conductance-5
photosynthesis model time-variant, although the sensitivities of stomatal conductance to photosynthesis and to vapour pressure are highly correlated. Recent studies could consequently demonstrate that changes of one single parameter, e.g. only maximum carboxylation rate or only stomatal conductance sensitivity, does not explain drought-induced reductions in both GPP andT simultaneously (Egea et al., 2011; Reichstein
10
et al., 2003; Zhou et al., 2013). Further, different temperature dependencies of e.g. maximum carboxylation or electron transport rate have been proposed (Medlyn et al., 2002; von Caemmerer, 2000; June et al., 2004).
In the present study, we report on drought effects on a Portuguesemontado ecosys-tem using the unique opportunity of two consecutive years of very contrasting
hydro-15
logical conditions. 2011 being a wet year with regular drought pattern occurring in summer, and 2012 being an extremely dry year with strongly reduced precipitation amount. Particularly, 2012 showed a severe additional winter/spring drought charac-teristic for precipitation pattern changes in recent past on the Iberian Peninsula (2nd driest year since 1950, Costa et al., 2012; Santos et al., 2013; Trigo et al., 2013). This
20
study is focussing on: (1) quantifying the effects of drought on the local ecosystem wa-ter balance, overstorey and understorey GPP, as well as differences in net ecosystem carbon exchange NEE between both years. (2) Identifying physiological responses in the drought year 2012 of theQ. suber trees using a combined photosynthesis-stomatal conductance model and testing the model performance with different process
descrip-25
BGD
11, 10365–10417, 2014
Drought impact on Mediterranean
Quercus suber L.
woodland during extreme drought
A. Piayda et al.
Title Page
Abstract Introduction
Conclusions References
Tables Figures
◭ ◮
◭ ◮
Back Close
Full Screen / Esc
Printer-friendly Version
Interactive Discussion
Discussion
P
a
per
|
Discus
sion
P
a
per
|
Discussion
P
a
per
|
Discussion
P
a
per
|
2 Material and methods
2.1 Site description
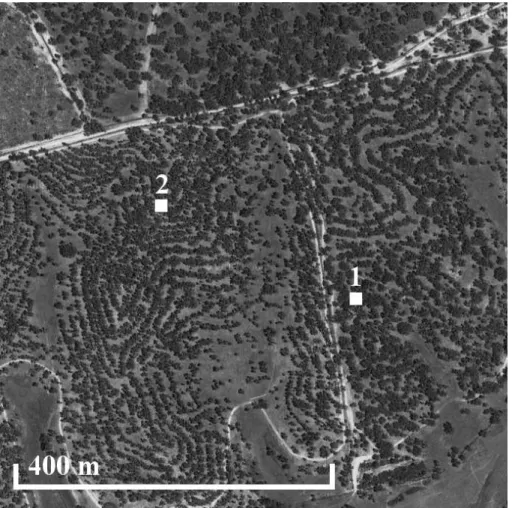
The study was conducted at the savannah-type flux observation site “PT-Cor” (Fig. 1) of the European Integrated Carbon Observation System (ICOS) ca. 100 km north-east of Lisbon, Portugal (latitude: 39◦8′20.7′′N, longitude: 8◦20′3.0′′W, altitude: 162 m a.s.l.).
5
The site is planted with evergreen Quercus suber (L.) trees of 209 individuals ha−1 on a Luvisol soil (Jongen et al., 2011). The tree canopy has a leaf area index LAI of 1.05±0.07 m2leafm−2ground, a midday gap probability Pgap(0) of 0.76±0.03 and an average tree canopy height of 9.7 m (Piayda et al., 2014). TheQ. subertrees likely have deep soil water and ground water access. Native annual grasses and herbs build the
10
understorey vegetation (Jongen et al., 2013b; Dubbert et al., 2014a), which emerges after the first rains in autumn, has a peak stand height in spring (March–April) and becomes senescent at the beginning of the summer period (late May) with a maximum LAI of 0.70±0.05 m2leafm−2ground. The understorey vegetation density and LAI are spatially highly variable due to the heterogeneous topography and hence, differences in soil
15
moisture regime. The whole region is under forest management.
2.2 Climate conditions
The site is characterised by a Mediterranean climate with moist and mild winters and dry and hot summers. The long term mean annual temperature is about 15.9◦C and the annual sum of precipitation is about 680 mm (Jongen et al., 2013b), with a
charac-20
teristic annual pattern of high winter precipitation (November to January) and summer drought during June to September (Paredes et al., 2006). The relevance of the winter precipitation for the Portuguese hydrological cycle can be easily explained by the pre-vailing Mediterranean-type climate that concentrates most of precipitation during the winter half of the year, with little to no precipitation in summer. Hence, the following
BGD
11, 10365–10417, 2014
Drought impact on Mediterranean
Quercus suber L.
woodland during extreme drought
A. Piayda et al.
Title Page
Abstract Introduction
Conclusions References
Tables Figures
◭ ◮
◭ ◮
Back Close
Full Screen / Esc
Printer-friendly Version
Interactive Discussion
Discussion
P
a
per
|
Discus
sion
P
a
per
|
Discussion
P
a
per
|
Discussion
P
a
per
|
data treatment is based on the hydrological year beginning with first autumn precipita-tion (October to September).
2.3 Overstorey eddy covariance measurements
The overstorey tower (Fig. 1, point 1) is set up with a Gill R3A-50 ultrasonic anemome-ter (Gill Instruments Ltd., Lymington, UK) in combination with a LI-7000 closed path
5
CO2/H2O analyzer (LI-COR, Lincoln, USA). The inlet tube has a length of 8.5 m, is attached to one of the anemometer arms and operated with an average flow rate of ca. 8 L min−1. The reference cell is flushed with N2. The measurement height is about 23.5 m above ground. Data is continuously acquired and processed live on a field lap-top with the eddy covariance data acquisition and processing software package
Ed-10
dyMeas (meteotools, Jena, Germany; Kolle and Rebmann, 2007).
At a height of 20 m above ground, two up- and downward facing LI-190 Quantum sen-sors (LI-COR, Lincoln, USA) and a NR-LITE net radiometer (Kipp and Zonen, Delft, the Netherlands) are attached. A radiation shielded HMP 155 probe measures air tempera-tureTaand relative humidity rH (Vaisala, Helsinki, Finland). PrecipitationP is measured
15
with an ARG100 aerodynamic rain gauge (Environmental Measurements Ltd., North Shields, UK) at the tower top. The meteorological parameters are logged on a CR10X datalogger (Campbell Scientific, Logan, USA).
2.4 Understorey eddy covariance measurements
The understorey tower was located about 286 m north-west of the overstorey tower
20
(Fig. 1, point 2). It was equipped with a Gill R3-50 ultrasonic anemometer (Gill In-struments Ltd., Lymington, UK) in combination with a LI-7500A open path CO2/H2O analyzer (LI-COR, Lincoln, USA). The gas analyzer was tilted 45◦from the vertical and the sensor separation was about 30 cm. The measurement height of both sensors was 3.15 m above ground. EddyMeas was used for data acquisition here as well.
BGD
11, 10365–10417, 2014
Drought impact on Mediterranean
Quercus suber L.
woodland during extreme drought
A. Piayda et al.
Title Page
Abstract Introduction
Conclusions References
Tables Figures
◭ ◮
◭ ◮
Back Close
Full Screen / Esc
Printer-friendly Version
Interactive Discussion
Discussion
P
a
per
|
Discus
sion
P
a
per
|
Discussion
P
a
per
|
Discussion
P
a
per
|
At 2 m height above ground, two PAR LITE quantum sensors facing up- and down-ward were attached to a CNR1 net radiometer (Kipp and Zonen, Delft, the Nether-lands). Air temperatureTa and relative humidity rH were measured with a HMP 155 probe covered by a radiation shield and atmospheric pressurep was measured with a PTB 110 barometer at 1.5 m above ground (Vaisala, Helsinki, Finland). The
meteoro-5
logical parameters were logged on a CR1000 datalogger (Campbell Scientific, Logan, USA).
A third eddy covariance system consisting of an Gill R3-50 ultrasonic anemometer in combination with a LI-7500A open path CO2/H2O analyzer was used to test compa-rability of over- and understorey tower systems. For a period of one week each it was
10
mounted on the overstorey and the understorey tower and measured in parallel. Both systems showed high Bravais–Pearson correlation coefficients of 0.78 to 0.91 as well as small normalized root mean squared errors of 0.01 to 0.06 for water and carbon fluxes in comparison with the portable eddy system.
2.5 Soil temperature and moisture
15
Soil temperatureTsand soil moistureθwere measured at open and tree-shaded loca-tions between the two towers.Ts was measured with PT100 PRT temperature probes (Campbell Scientific, Logan, USA) in 2, 4, 8, 16, 30, and 60 cm depth, two replicates each.θwas measured with 10hs sensors (Decagon Devices, Inc., Washington, USA) at 5, 15, 30 and 60 cm depth, four replicates each. The meteorological parameters
20
were logged on CR1000 dataloggers (Campbell Scientific, Logan, USA).
2.6 Data treatment
Eddy flux data were post-processed using EddySoft and Python 2.7. Half-hourly means were calculated by block-averaging the 20 Hz data, time lags between CO2/H2O sig-nals and vertical wind velocity were determined via cross correlation analysis following
25
BGD
11, 10365–10417, 2014
Drought impact on Mediterranean
Quercus suber L.
woodland during extreme drought
A. Piayda et al.
Title Page
Abstract Introduction
Conclusions References
Tables Figures
◭ ◮
◭ ◮
Back Close
Full Screen / Esc
Printer-friendly Version
Interactive Discussion
Discussion
P
a
per
|
Discus
sion
P
a
per
|
Discussion
P
a
per
|
Discussion
P
a
per
|
signals of the overstorey tower, the dependency on rH was used to determine the lag for the H2O signal according to Ibrom et al. (2007). High frequency losses were com-pensated with the use of inductances derived from co-spectral analysis (Eugster and Senn, 1995). The sectorial planar fit method was used for the coordinate rotation of wind vectors (Rebmann et al., 2012; Wilczak et al., 2001). For both towers, the
mois-5
ture and cross wind correction according to Schotanus et al. (1983) was applied and the WPL correction for flux density fluctuations was used for the CO2/H2O signals of the open path understorey sensor only (Leuning, 2007; Webb et al., 1980). The storage term of CO2was calculated after Hollinger et al. (1994) and added to the turbulent CO2 flux.
10
For the purpose of quality control, flags were determined for every half-hourly flux value including the following tests: the 20 Hz data were scanned for exceeded physical limits, change rates and variances. The stationary test of Foken and Wichura (1996) was applied to the high frequency data based upon a 50 % deviation criterion. On a half-hourly basis, the integral turbulence characteristics (ITC) were calculated
fol-15
lowing Thomas and Foken (2002) with a 30 % deviation criterion. For the understorey tower, the parametrisation of the ITC was recalculated according to the observations. A spike detection routine was used on the half-hourly data based on the absolute median deviation (Papale et al., 2006). All quality control tests were summed up in a simplified flag system referring to Mauder and Foken (2011).
20
The partitioning of the net CO2 fluxes NEE into gross primary productivity GPP and ecosystem respirationReco followed Lasslop et al. (2010) and the flux gap-filling was made according to Reichstein et al. (2005). Gaps were only filled up to a maximum gap length of 6 days.
Ts andθ were integrated over the respective depths and the replicates of each site
25
BGD
11, 10365–10417, 2014
Drought impact on Mediterranean
Quercus suber L.
woodland during extreme drought
A. Piayda et al.
Title Page
Abstract Introduction
Conclusions References
Tables Figures
◭ ◮
◭ ◮
Back Close
Full Screen / Esc
Printer-friendly Version
Interactive Discussion
Discussion
P
a
per
|
Discus
sion
P
a
per
|
Discussion
P
a
per
|
Discussion
P
a
per
|
The soil heat flux G was calculated from the averaged Ts profiles. To estimate the energy balance closure of the towers, the storage terms due to changes inTa and rH were added to the energy balance equation and plotted against the turbulent energy fluxes for daytime values with global radiation Rg>20 W m
−2
(Mauder et al., 2013; Foken, 2008; Twine et al., 2000). The ratio was used to correct sensible heatH, latent
5
heatλE and evapotranspiration ET flux with the bowen ratio being preserved.
2.7 Photosynthesis and stomatal conductance modelling
The Farquhar model for photosynthesis (Farquhar et al., 1980) combined with the Leun-ing model for stomatal conductance (LeunLeun-ing, 1995) was used to model gross primary productivity and evapotranspiration GPPo and ETo measured at the overstorey tower
10
for the summer months May to September of 2011 and 2012. For model comparison, stomatal conductance was modelled as well with the approach of Ball et al. (1987). The model was fitted to a 31 day long moving window of GPPoand EToto gain stable median daily cycles. These were cropped to the time from sunrise to 15:00. Model fit-ting was done using a Nelder–Mead simplex algorithm (Nelder and Mead, 1965) with
15
a higher order multi objective cost function for GPPo and EToaccording to Duckstein (1981) under varying apparent maximum carboxylation rateVc,max (no separate mod-elling of mesophyll conductance), assimilation sensitivity m, vapour pressure deficit sensitivityD0of stomatal conductancegs and optimum temperature Topt of maximum electron transport rateJmax. Three differentToptdescriptions were used for model
com-20
parison. See Appendix A for detailed model equations.
3 Results and discussion
Ecosystem fluxes for the hydrological years 2011 and 2012 (October 2010 to Septem-ber 2012) are discussed in the following. Flux time series are only compared when data availability is given for both hydrological years, but not on an annual sum basis.
BGD
11, 10365–10417, 2014
Drought impact on Mediterranean
Quercus suber L.
woodland during extreme drought
A. Piayda et al.
Title Page
Abstract Introduction
Conclusions References
Tables Figures
◭ ◮
◭ ◮
Back Close
Full Screen / Esc
Printer-friendly Version
Interactive Discussion
Discussion
P
a
per
|
Discus
sion
P
a
per
|
Discussion
P
a
per
|
Discussion
P
a
per
|
The dominant wind direction changes during the season. Absolute values of flux measurements of the overstorey tower are thus not directly comparable to the absolute values of the understorey tower due to changing footprint area and the heterogeneity of the ecosystem. However, comparisons of the intra-annual pattern of ecosystem fluxes between both towers and inter-annual changes between both years 2011 and 2012 are
5
possible and conducted in the following.
3.1 Meteorological and environmental conditions
Water scarcity is the most important factor for ecosystem productivity in savannah-type ecosystems (Pereira et al., 2007). Drought severity and impact on vegetation depends on timing and amount of precipitationP (Peñuelas et al., 2004). The hydrological years
10
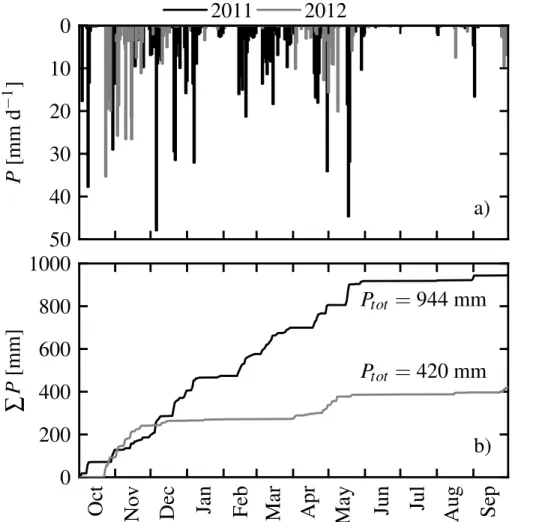
2011 and 2012 mark, therefore, exceptional years on the Iberian Peninsula. Precipi-tationP was 34 % higher in 2011 and 39 % lower in 2012 compared to the long term average precipitation of about 680 mm (Jongen et al., 2013a) (Fig. 2a and b). In partic-ular, the winter 2011/2012 was very dry over Soutwestern Iberia, with only about 20 % of the long term precipitation (Santos et al., 2013; Trigo et al., 2013). 2012 was the
15
second driest year since 1950. The last negative P anomaly of comparable severity occurred in the drought year 2004/2005 (Paredes et al., 2006; Santos et al., 2007).
The intra-annual pattern of precipitation has especially changed in 2012. Total annual reduction to the previous year 2011 was 495 mm of which 68 % occurred during a long drought event in winter and early spring (December–March). The beginning of autumn
20
precipitation was also delayed by almost a month in 2012. Winter precipitation is the most important for replenishing the soil and ground water reservoirs after the summer drought. But the winter precipitation period was shortened and interrupted for about four months in the hydrological year 2012. These phenomena, i.e. reduced annualP, additional winter/spring drought, and prolonged summer drought, are characteristic for
25
BGD
11, 10365–10417, 2014
Drought impact on Mediterranean
Quercus suber L.
woodland during extreme drought
A. Piayda et al.
Title Page
Abstract Introduction
Conclusions References
Tables Figures
◭ ◮
◭ ◮
Back Close
Full Screen / Esc
Printer-friendly Version
Interactive Discussion
Discussion
P
a
per
|
Discus
sion
P
a
per
|
Discussion
P
a
per
|
Discussion
P
a
per
|
We address first the question of changes in environmental and climatic components between both years, which may have caused significant changes in ecosystem func-tioning. The distributions of most relevant climatic and environmental variables for plant functioning are therefore analysed in quantile-quantile (Q-Q) plots in Fig. 3. Air tem-perature Ta (Fig. 3a) and incoming photosynthetically active radiation PAR (data not
5
shown) showed only minor changes between the two years so that plant available en-ergy in both years was comparably high. In contrast, moisture related variables showed large deviations from the on-to-one line in the Q-Q plots (Fig. 3b–d). All precipitation
P intensities of 2012 stayed well below the ones in 2011 (Fig. 3b). Air vapour pres-sure deficit vpd was considerably increased at high deficits in 2012 compared to 2011
10
(Fig. 3c). This comes from lower absolute humidity because air temperatureTadid not change substantially. Possible reasons are either diminished local ecosystem evopo-transpiration ET due to diminished soil moisture (Fig. 3d) and plant evopo-transpiration or less air moisture input by incoming air masses from the ocean. Soil moisture was signifi-cantly decreased in 2012 compared to 2011 (Fig. 3d), which is exhibited especially in
15
the missing medium soil moisture amounts. The contribution of local ET to the observed reduction in vpd was estimated by approximating the average contribution of local ET to absolute humidity of the atmospheric boundary layer. 50 % of absolute humidity re-duction in 2012 compared to 2011 could be explained by a reduced contribution of local ET. This illustrates the strong influence of ET on local hydrological conditions and the
20
reinforcement of plant drought stress due to increased vpd.
The ecosystem, therefore, faced increased transpirational demand from higher at-mospheric vpd combined with strongly decreased soil water availability, which resulted in high water stress for the trees but also for understorey vegetation in 2012 compared to 2011. In the following, the effect of decreased water availability on the ecosystem
25
BGD
11, 10365–10417, 2014
Drought impact on Mediterranean
Quercus suber L.
woodland during extreme drought
A. Piayda et al.
Title Page
Abstract Introduction
Conclusions References
Tables Figures
◭ ◮
◭ ◮
Back Close
Full Screen / Esc
Printer-friendly Version
Interactive Discussion
Discussion
P
a
per
|
Discus
sion
P
a
per
|
Discussion
P
a
per
|
Discussion
P
a
per
|
3.2 Drought influence on ecosystem water balance
Evapotranspiration ET is the major component of total water efflux in Mediterranean ecosystems on annual basis (Huxman et al., 2005). A comparably small amount of pre-cipitation is left for ground water recharge and runoff. ET usually peaks in May before the onset of drought in the beginning of June in Mediterranean ecosystems (Vargas
5
et al., 2013). But ecosystem evapotranspiration measured here at the overstorey tower ETo (Fig. 4b) peaked within the summer drought period in June to July in 2011. This behaviour is typical for montado ecosystems with ground water access of the trees (Paco et al., 2009; Pereira et al., 2007; David et al., 2007, 2004). EToshowed a slight peak shift towards spring in 2012 and was diminished by 26 % compared to 2011. The
10
major decrease occurred in late spring and summer (March to September) although the major reduction in precipitationP occurred in winter and early spring (December to March) (Fig. 2b). When atmospheric demand (Fig. 4a) and energy input into the system increased in spring 2012, theQ. suber trees were not able to maintain transpirationT
as high as in 2011. This indicates, that most likely the deep soil and/or ground water
15
reservoirs were not refilled after summer 2011 due to the dry winter as displayed by soil moisture observations in 60 cm depth (Fig. 5b). However, the strongly diminished tran-spirationT led to a non-significant increase in maximum daily leaf temperatureTl,max of only 1.7◦C during the summer period of 2012. The small influence of the reduced transpirational cooling on leaf temperature could be attributed to the high aerodynamic
20
conductancegain this open canopy, enabling a comparably high energy transport by sensible heat.
Evapotranspiration measured at the understorey tower ETu peaked in March to April 2011 before the beginning of the summer die back of the understorey vegeta-tion, which is rather typical in savannah-type ecosystems (e.g. Paco et al., 2009). ETo
25
BGD
11, 10365–10417, 2014
Drought impact on Mediterranean
Quercus suber L.
woodland during extreme drought
A. Piayda et al.
Title Page
Abstract Introduction
Conclusions References
Tables Figures
◭ ◮
◭ ◮
Back Close
Full Screen / Esc
Printer-friendly Version
Interactive Discussion
Discussion
P
a
per
|
Discus
sion
P
a
per
|
Discussion
P
a
per
|
Discussion
P
a
per
|
soil moisture in winter (Fig. 5a) had an immediate impact on ETuinhibiting plant growth and herbaceous transpiration (see Sect. 3.3). ETo, on the other hand, was influenced from March onwards only. The precipitation events occurring in April and March 2012 (Fig. 2a) were not able to increase ETu up to the level of 2011 even though the atmo-spheric demand was slightly higher in 2012 (Fig. 3c). This can be explained on the one
5
hand by very low soil moistures up to 20 cm depth in October and from March onwards (Fig. 5a), which prevented soil evaporation, and on the other hand, by the strong reduc-tion in plant cover leading to a reduced contribureduc-tion of herbaceous plant transpirareduc-tion to ETu(see Sect. 3.3).
Precipitation effectiveness ETo/P indicates the amount of total precipitationP used
10
for actual ecosystem evapotranspiration ETo. ETo/P =86 % in 2011, which is high but comparable to other studies (Sala and Tenhunen, 1996; Piñol et al., 1991). However, the strong reduction of ecosystem evapotranspiration EToof 26 % in 2012 was vastly exceeded by the reduction in precipitationP of 54 %. This confirms recent results from Besson et al. (2014) showing a certain resilience ofQ. suber tree transpiration to
an-15
nual water shortages. This led to ETo/P of 122 % in 2012, which is to our knowledge, the highest value reported formontadoecosystems so far. Hence more water evapo-rated from the soil and was transpired by the trees than was brought into the ecosystem by precipitation. This was possible due to the deep soil or ground water access of the trees maintaining a relatively high transpiration rate throughout the summer. But it left
20
also no water for ground water replenishment or runoff generation (cf. Sala and Ten-hunen, 1996).
Ecosytem productivity was markedly changed in 2012 due to the strong alterations in the water balance, which will be discussed in the following.
3.3 Understorey growth inhibition
25
BGD
11, 10365–10417, 2014
Drought impact on Mediterranean
Quercus suber L.
woodland during extreme drought
A. Piayda et al.
Title Page
Abstract Introduction
Conclusions References
Tables Figures
◭ ◮
◭ ◮
Back Close
Full Screen / Esc
Printer-friendly Version
Interactive Discussion
Discussion
P
a
per
|
Discus
sion
P
a
per
|
Discussion
P
a
per
|
Discussion
P
a
per
|
survive the dry periods as seeds and germinate again at the onset of autumn pre-cipitation. Species abundance during spring depends thus on the amount of previous winter precipitation (Figueroa and Davy, 1991). The timing of the first autumn rains and rewetting of the soils is thereby of great importance for germination success, number of individuals and plant productivity (Jongen et al., 2013c; de Dios Miranda et al., 2009).
5
The understorey showed a typical annual cycle of gross primary productivity GPPu in 2011 (Fig. 6c) for savannah-type understorey vegetation with the growth onset at the end of October (Ma et al., 2007). Carbon uptake peaked in February to March and ended with the complete die back at the end of May. GPPu was strongly reduced by 53 % in 2012 compared to 2011. A small GPPupeak occurred along with precipitation
10
P in April and May (Fig. 2). The reduction of GPPu can be explained by the very low soil moistureθ20 cmduring October 2011 (Fig. 5a) due to the late onset of autumn pre-cipitationP inhibiting seed germination.θ20 cmwas lower during the entire year 2012 in comparison to 2011, particularly over the main growth period of the understorey veg-etation from January to April. It was up to 52 % lower in March 2012, inhibiting further
15
growth during winter/spring and probably caused higher seedling mortality. Dubbert et al. (2014a) reported a maximum understorey vegetation cover in this ecosystem of about 80 % for 2011 that was reduced to about 25 % during the same period in 2012 (data for 2012 not shown). Similar effects on seedling germination and mortality were shown by others (Peco and Espigares, 1994; Espigares and Peco, 1995, 1993) under
20
artificial rainfall treatments and could be shown here under natural conditions.
3.4 Ecosystem productivity reduction
Most European, Mediterranean savannah-like ecosystems show a severe drop in gross primary productivity during summer (June to August) framed by a major peak in early spring (April to May) and a minor peak at the onset of autumn rain (Baldocchi et al.,
25
2009).
BGD
11, 10365–10417, 2014
Drought impact on Mediterranean
Quercus suber L.
woodland during extreme drought
A. Piayda et al.
Title Page
Abstract Introduction
Conclusions References
Tables Figures
◭ ◮
◭ ◮
Back Close
Full Screen / Esc
Printer-friendly Version
Interactive Discussion
Discussion
P
a
per
|
Discus
sion
P
a
per
|
Discussion
P
a
per
|
Discussion
P
a
per
|
June–July (Fig. 6b). The amount of carbon gained was also higher compared to other Mediterranean evergreen woodlands in particular during the drought period in summer (Baldocchi et al., 2009; Ma et al., 2007). This annual pattern is rather characteristic for temperate than semi-arid ecosystems. The Q. suber trees must have deep soil water or ground water access in “regular” hydrological years, as shown in Sect. 3.2.
5
This enabled them to maintain high productivity during the summer period despite high atmospheric water demand and low topsoil soil moisture.
Gross primary productivity GPPo showed almost the same seasonal timing in 2012 compared to 2011 but was strongly reduced by 28 % (Fig. 6b). The major reduction took place in spring and summer (April to September) together with the reduction in
10
evapotranspiration ETo (Fig. 4b) when atmospheric demand was high and the emp-tied deep soil and ground water reservoirs were unable to supply sufficient water (see Sect. 3.2) in 2012 compared to a regular year. This confirms the results of Pereira et al. (2007) who showed that drought effects on sclerophyllous trees became apparent only after the depletion of the deep soil and ground water reserves. Despite a delayed bud
15
burst in spring, a significant difference in leaf area index LAI could not be observed during the summer period by long-term leaf area index observations of Costa e Silva et al. (2014). Reductions in GPPoand ETocan hence be attributed solely to leaf phys-iological responses discussed in Sect. 3.6.
3.5 Net ecosystem carbon exchange reduction
20
The net ecosystem carbon flux NEEowas strongly reduced by 38 % in the drought year 2012 compared to the wet year 2011 (Fig. 6a). The ecosystem was, however, a carbon sink in both years on annual basis even though reductions in precipitationP (Fig. 2) and gross primary productivity GPPo(Fig. 6b) were severe in 2012. Pereira et al. (2007) found a similar behaviour in another montado ecosystems in Portugal. It still
demon-25
BGD
11, 10365–10417, 2014
Drought impact on Mediterranean
Quercus suber L.
woodland during extreme drought
A. Piayda et al.
Title Page
Abstract Introduction
Conclusions References
Tables Figures
◭ ◮
◭ ◮
Back Close
Full Screen / Esc
Printer-friendly Version
Interactive Discussion
Discussion
P
a
per
|
Discus
sion
P
a
per
|
Discussion
P
a
per
|
Discussion
P
a
per
|
to September) along with the strongest reduction in gross primary productivity GPPo (Fig. 6b) caused by the lack of water availability for theQ. suber trees (cf. Sect. 3.2). GPPoexhibited a reduction of 28 % in 2012 compared to 2011 whileReco showed only a reduction of 16 %.Reco is mainly reduced in summer (July to September, data not shown) where soil moisture in the upper soil layerθ20 cm is low in both years due to
5
the regular summer drought (Fig. 5a) and inter-annual differences are small. NEEois therefore much more driven by GPPothan byReco in the ecosystem studied here. Re-ichstein et al. (2002) hypothesized that gross primary productivity GPPoshould be less affected by drought than ecosystem respirationReco in ecosystems with large subsoil water reservoirs becauseRecodepends on soil moisture and soil temperature. But it is
10
hot and dry almost every summer in the Mediterranean so that the lack of soil moisture in the upper soil inhibits soil respiration during summer and reduces largely the contri-bution ofRecoto inter-annual variations (e.g. Unger et al., 2009). This could also be the reason for the controversial findings of Valentini et al. (2000) thatReco becomes less important for variations of NEE with decreasing latitude on the Northern Hemisphere.
15
It is, however, clear that vastly different GPPo andReco cannot be sustained over long time;Recobase rates have to adapt in the long-term.
3.6 Drought impact on tree physiology
Multiple physiological mechanisms of plant responses to drought, excessive irradi-ance and high temperatures have been recognized on the leaf-level such as reduction
20
of exposed leaf area or leaf shedding (Beyschlag et al., 1986; Sala and Tenhunen, 1996; Tenhunen et al., 1985, 1990; Werner et al., 2001). To avoid hydraulic failure or photodamage, carboxylation efficiency Vc,max and/or stomatal conductance gs can be down-regulated restricting water loss and carbon assimilation and hence increasing photorespiration as a protective electron sink (Farquhar and Sharkey, 1982; Cowan,
25
BGD
11, 10365–10417, 2014
Drought impact on Mediterranean
Quercus suber L.
woodland during extreme drought
A. Piayda et al.
Title Page
Abstract Introduction
Conclusions References
Tables Figures
◭ ◮
◭ ◮
Back Close
Full Screen / Esc
Printer-friendly Version
Interactive Discussion
Discussion
P
a
per
|
Discus
sion
P
a
per
|
Discussion
P
a
per
|
Discussion
P
a
per
|
for example, electron transport rates (Kattge and Knorr, 2007; von Caemmerer, 2000; Berry and Björkman, 1980).
There are different levels of complexity on how to describe photosynthesis in the literature. We focus here on Farquhar-type models of photosynthesis (Farquhar et al., 1980). There are three mechanisms that differ strongly between the different
mod-5
els of vegetation-atmosphere exchange: (1) the reactions to soil water stress, (2) the formulations used for the description of stomatal conductance and (3) the reactions to heat stress. How plants react to water stress is probably the least well-described mechanism in photosynthesis models. The different ecosystem and land surface mod-els differ strongly on how they react to soil water stress. The widely used community
10
land model CLM, for example, reduces apparent carboxylation efficiency Vc,maxunder drought (Oleson et al., 2010), which then indirectly reduces stomatal conductance as well, while the land surface scheme ORCHIDEE down-regulates stomatal conductance directly leavingVc,maxunchanged (Krinner et al., 2005; Verbeeck et al., 2011).
There is also a great variety of descriptions of stomatal conductance (cf. Damour
15
et al., 2010). Most large-scale models apply the formulation of Ball et al. (1987) though, the so called Ball–Berry or sometimes Ball–Woodrow–Berry model (cf. Eq. A11). Le-uning (1995) argued that stomata under controlled conditions react to vapour pressure deficit rather then relative humidity and proposed and alternate form of the Ball–Berry model (cf. Eq. A10), the so-called Leuning model or sometimes Ball–Berry–Leuning
20
formulation. But the photosynthesis models also differ in their reactions to heat stress. It is still discussed in the physiological literature if heat is only changing thylakoid mem-brane properties limiting electron transport (von Caemmerer, 2000; June et al., 2004) or if heat is also inhibiting enzyme activities, i.e. also carboxylation rates (Medlyn et al., 2002; Kattge and Knorr, 2007).
25
un-BGD
11, 10365–10417, 2014
Drought impact on Mediterranean
Quercus suber L.
woodland during extreme drought
A. Piayda et al.
Title Page
Abstract Introduction
Conclusions References
Tables Figures
◭ ◮
◭ ◮
Back Close
Full Screen / Esc
Printer-friendly Version
Interactive Discussion
Discussion
P
a
per
|
Discus
sion
P
a
per
|
Discussion
P
a
per
|
Discussion
P
a
per
|
derstorey vegetation had already vanished and soil evaporation was low compared to tree transpiration (Fig. 4c).
The following discussion includes (1) whether a down-regulation of only carboxyla-tion efficiency Vc,max or only stomatal sensitivitymis sufficient to describe the ecosys-tem behaviour in both years. (2) It evaluates the performance of the two prominent
5
stomatal conductance formulations. (3) It compares different representations of pho-tosynthetic temperature dependencies. (4) It discusses possible reasons for down-regulation of stomatal conductance gs and carboxlation Vc,max, (5) disentangling the causes for down-regulation of stomatal conductancegs. (6) The unexpected change in optimal temperatureToptbetween the two years is discussed.
10
First, GPPo and ETo were modelled with either allowing the model to adapt each day onlyVc,maxor only the slopemof the Ball–Berry stomatal conductance formulation (Ball et al., 1987) (Eq. A11). The model was not able to reproduce the observations with sufficient performance in both cases, especially in 2012. The goodness of fit to the observed data steadily decreased with ongoing summer drought. GPPoand ETocould
15
be successfully modelled if both,Vc,maxandmwere allowed to adapt daily to changing environmental conditions, leading to constantly high Nash–Sutcliffe model efficiencies ofεGPPo =0.88 andεETo=0.95 for 2011 andεGPPo=0.84 andεETo =0.90 for 2012.
Second, the same model calibration experiment was performed with the Leuning model of stomatal conductance (Leuning, 1995) (Eq. A10). The Leuning model has,
20
however, an additional model parameterD0which describes the sensitivity of the stom-ata to changes in vapour pressure deficit vpd. The Leuning model showed comparable high model performances to the Ball–Berry model in both years. When the Leuning model was used in earlier studies (e.g. Wang and Leuning, 1998), D0 was fixed to a constant value. This implies that stomatal conductance sensitivity to vpd needs to
25
BGD
11, 10365–10417, 2014
Drought impact on Mediterranean
Quercus suber L.
woodland during extreme drought
A. Piayda et al.
Title Page
Abstract Introduction
Conclusions References
Tables Figures
◭ ◮
◭ ◮
Back Close
Full Screen / Esc
Printer-friendly Version
Interactive Discussion
Discussion
P
a
per
|
Discus
sion
P
a
per
|
Discussion
P
a
per
|
Discussion
P
a
per
|
between both years (only 1.3 hPa increase on average) but a strong decrease inVc,max could be observed (see below). Consequently, a decrease in model performance oc-curred, whenD0 was set constant. Enabling the Q. suber trees to regulate stomatal response to vpd and assimilation A separately was necessary to explain observed GPPoand ETo.
5
The two first points illustrate that the plants needed to regulate their potency of pos-sible carbon assimilation but wanted to increase how swift stomata react to changes. The reduction in maximum carboxylation rate Vc,max, though, was about 37 % while the increase in the slopemwas about 13 % or 30 % whether calculation followed Ball et al. (1987) or Leuning (1995), respectively. This led to an overall decrease in stomatal
10
conductancegsof about 31 %.
Third, the temperature dependency of photosynthetic activity has generally been at-tributed to two different processes in previous publications. Medlyn et al. (2002) and Kattge and Knorr (2007) described the temperature dependency of both, maximum carboxylation rateVc,max of the Rubisco enzyme and maximum electron transport rate
15
Jmaxby a peaked function, according to Johnson et al. (1942) (Eq. A6). An increase in enzyme activity with temperature is followed by a decrease above an optimum temper-atureToptdue to enzyme deactivation (Case 1). Von Caemmerer (2000), among others, attributed possible decrease of activity of the photosynthetic apparatus at high temper-atures rather to thylakoid membrane properties only, limiting electron transport, thus
20
changing with leaf temperature. So onlyJmaxis down-regulated above an optimum tem-peratureTopt(Eq. A6), butVc,maxincreases monotonically with a typical Arrhenius-type function (Eq. A5, Case 2). This was simplified by June et al. (2004) using a gaussian temperature dependency instead of the original formulation (Eq. A8, Case 3). Here all cases showed comparable model performances and no apparent differences in GPPo
25
BGD
11, 10365–10417, 2014
Drought impact on Mediterranean
Quercus suber L.
woodland during extreme drought
A. Piayda et al.
Title Page
Abstract Introduction
Conclusions References
Tables Figures
◭ ◮
◭ ◮
Back Close
Full Screen / Esc
Printer-friendly Version
Interactive Discussion
Discussion
P
a
per
|
Discus
sion
P
a
per
|
Discussion
P
a
per
|
Discussion
P
a
per
|
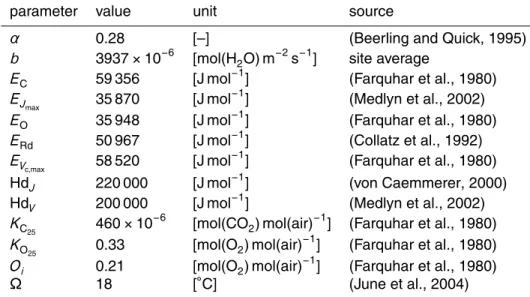
Topt(Case 3), all parameters were fixed to literature values (Table 1). Case 3, although containing only one parameter for optimization like Case 2, showed a more robust com-putational performance with fastest optimization by the Nelder–Mead algorithm (Nelder and Mead, 1965) among all cases.
Fourth, multiple reasons for down-regulation of photosynthesis under drought
con-5
ditions are known, ranging from damage of involved enzymes due to high leaf tem-peratures, inhibition of the photosynthetic apparatus to avoid excess energy in the leaves, to insufficient availability of nitrogen inside the leaves (Tenhunen et al., 1987; Werner et al., 1999). But protection of the photosynthetic apparatus during environ-mental stress comes at the cost of reduced carbon sequestration (Tenhunen et al.,
10
1990; Werner et al., 1999; Werner and Correia, 1996). Excessive radiation and high temperatures provide the risk of photoinhibition and photodamage under reduced CO2 supply due to stomatal closure and low water potentials (Werner et al., 2002). Stom-atal conductancegswas strongly reduced by 31 % in 2012 compared to 2011 (Fig. 7e) although differences in daily maximum vpd during the summer drought period were not
15
significant (only 1.3 hPa increase on average) between both years (Fig. 4a). It is thus very likely that the trees suffered from depleted deep soil or groundwater reservoirs due to the missing recharge by winter precipitation, since upper soil water content values were comparable during summer (Fig. 5a and b). This is an evidence that plant wa-ter status ofQ. suber trees is strongly influenced by access to groundwater here and
20
a down-regulation of transpiration occurred to avoid hydraulic failure (David et al., 2007; Oliveira et al., 1992). Although transpirational cooling of leaves should have been re-duced due to limited stomatal conductance, the daily maximum leaf temperatureTl,max increased by only 1.7◦C in 2012 compared to 2011 (Sect. 3.2) so that a temperature-based damage of enzymes relevant for photosynthesis is unlikely. The CO2 influx into
25
BGD
11, 10365–10417, 2014
Drought impact on Mediterranean
Quercus suber L.
woodland during extreme drought
A. Piayda et al.
Title Page
Abstract Introduction
Conclusions References
Tables Figures
◭ ◮
◭ ◮
Back Close
Full Screen / Esc
Printer-friendly Version
Interactive Discussion
Discussion
P
a
per
|
Discus
sion
P
a
per
|
Discussion
P
a
per
|
Discussion
P
a
per
|
by 37 % (Fig. 7a) was to avoid over-excitation and photodamage (Demmig-Adams and Adams, 1992; Long et al., 1994; Werner et al., 2002). However, this effect may have been enforced by a decreased nitrogen availability during the leaf development phase in late spring caused by reduced soil water, and thus nitrogen solubility in 2012 (Fig. 5a and b) potentially changing leaf nitrogen status and permanently reducing
photosyn-5
thetic capacity in 2012 compared to 2011 (Vaz et al., 2010). A possible indication for a permanent reduction ofVc,max is that gstends to converge to the same value at the end of the drought period in both years (Fig. 7e) so that leaf internal CO2 availability should have approached comparable values as well.Vc,maxremained, however, down-regulated permanently. A simultaneous reduction ofVc,max by 37 % (Fig. 7a) and an
10
increase of m (13 % or 30 % whether gs was calculated following Ball et al. (1987) or Leuning (1995), Fig. 7b) was observed. In case of a drought spell like 2012, the Q. suber trees responded with both, stomatal limitation as well as down-regulation of assimilation strongly altering entire ecosystem functioning, which was observed in dif-ferent semi-arid ecosystems before (Reichstein et al., 2003; Egea et al., 2011; Zhou
15
et al., 2013).
Fifth, the use of the Leuning (1995) model with variableD0allowed to disentangle the different impacts ongs. Intra-annually, stomatal conductance showed a much stronger sensitivity to vpd (Fig. 7c) than to variations in assimilation (Fig. 7d). Between both years,m/(1+(vpd/D0)) increased only slightly by 6 % as a consequence of a slightly
20
stronger reduction inVc,maxthan ings (37 % and 31 %, respectively). This displays the strong resilience of sclerophyllous tree species like Q. suber to drought, maintaining a water use efficiency comparable to regular years (Zhou et al., 2013). The impact of vpd ongswas, however, weakened in 2012 (reduction ofD0by 14 %) sincegswas gen-erally reduced at comparable vpd.mcompensated fluctuations inD0(Fig. 7b) to yield
25
BGD
11, 10365–10417, 2014
Drought impact on Mediterranean
Quercus suber L.
woodland during extreme drought
A. Piayda et al.
Title Page
Abstract Introduction
Conclusions References
Tables Figures
◭ ◮
◭ ◮
Back Close
Full Screen / Esc
Printer-friendly Version
Interactive Discussion
Discussion
P
a
per
|
Discus
sion
P
a
per
|
Discussion
P
a
per
|
Discussion
P
a
per
|
Sixth, all three model descriptions (Case 1–3) showed a decrease in the optimum temperature of photosynthesis Topt by 4–8
◦
C from 2011 to 2012 (Fig. 7f). Leaf re-newal in 2012 occurred under strong drought conditions due to the additional winter drought and under increased temperatures due to the bud burst occurring more than one month later than in 2011 Costa e Silva et al. (2014). So carbon uptake in 2012 was
5
further weakened due to a higher susceptibility of the photosynthesis apparatus to high temperatures in addition to the already discussed reduction of carboxylation efficiency
Vc,max by 37 %. Kattge and Knorr (2007) and von Caemmerer (2000), among others, showed for different plant species the opposite trend of increasing Topt with increas-ing growth temperature. A possible explanation is that not only growth temperature but
10
also nutrient availability and plant water status have changed strongly here affecting thylakoid membrane properties more than growth temperature.
In summary, theQ. suber trees responded to the drought year 2012 with a down-regulation of carboxylation efficiency and a decreased optimal temperature of pho-tosynthesis. They counteracted this reduced carbon sequestration with a better
re-15
sponsiveness of the stomata. These plant responses were caused neither by a higher vapour pressure deficit nor by leaf temperatures nor by a depletion of upper soil mois-ture. But they were most probably triggered by a strong depletion of deep soil or ground water due to the additional winter drought.
The combined model of photosynthesis and stomatal conductance was unable to
re-20
produce the observed carbon assimilation and evapotranspiration if only one reaction was considered, i.e. either in the photosynthetic apparatus or in stomatal conductance. It needed to adapt parameters in both sub-modules, i.e. a strong reduction in car-boxylation efficiency and a smaller increase in stomatal sensitivity. Earlier model-data approaches had shown that combined photosynthesis-stomatal conductance models
25
BGD
11, 10365–10417, 2014
Drought impact on Mediterranean
Quercus suber L.
woodland during extreme drought
A. Piayda et al.
Title Page
Abstract Introduction
Conclusions References
Tables Figures
◭ ◮
◭ ◮
Back Close
Full Screen / Esc
Printer-friendly Version
Interactive Discussion
Discussion
P
a
per
|
Discus
sion
P
a
per
|
Discussion
P
a
per
|
Discussion
P
a
per
|
the stomatal conductance formulations of Ball–Berry vs. Leuning and the different for-mulations of optimal photosynthetic temperatures.
3.7 Future development
It is expected that the trend of decreasing total annual precipitation and alteration of precipitation patterns on the Iberian Peninsula, namely occurrences of additional
win-5
ter/spring droughts, will continue with proceeding climate change (Bussotti et al., 2013; Guerreiro et al., 2013; Hulme et al., 1999). Such severe drought periods might occur at higher frequency (Field et al., 2012; Heimann and Reichstein, 2008; Granier et al., 2007; Miranda et al., 2002) thereby affecting the ecosystem water balance and produc-tivity (Chaves et al., 2002; Fischer et al., 2002). If precipitation patterns similar to 2012
10
will occur more often then a sustainable depletion of local ground water reservoirs as well as water storage basins might be expected. This will affect strongly local agricul-ture that relies on ground water for the deep-rooted cork-oak trees and otherwise uses irrigation water from storage basins. The soil seed bank of native understorey plants may also deplete on the long term due to a shorter life cycle and reduced seed
for-15
mation (Jongen et al., 2013c; Peñuelas et al., 2002, 2004; Gordo and Sanz, 2005). A shift of species composition is likely de Dios Miranda et al. (2009) but could not be observed in this ecosystem in a study by Dubbert et al. (2014a, 2012 data not shown) during the drought year 2012 itself. However, some effects such as tree mortality may only be evident in the long term after multiple, consecutive drought years (David et al.,
20
2004; Bussotti et al., 2013).
4 Conclusions
We reported on the ecosystem fluxes of a savannah-type cork oak woodland under extreme hydrological conditions and altered precipitationP pattern. We analysed the effects of drought in the year 2012 compared to the wet year 2011 on
BGD
11, 10365–10417, 2014
Drought impact on Mediterranean
Quercus suber L.
woodland during extreme drought
A. Piayda et al.
Title Page
Abstract Introduction
Conclusions References
Tables Figures
◭ ◮
◭ ◮
Back Close
Full Screen / Esc
Printer-friendly Version
Interactive Discussion
Discussion
P
a
per
|
Discus
sion
P
a
per
|
Discussion
P
a
per
|
Discussion
P
a
per
|
ration and gross primary productivity of amontado ecosystem and its overstorey and understorey components. We additionally analyzed physiological reactions of the Q. suber trees.
We conclude the following results: (1) the precipitation effectiveness ETo/P in-creased up to 122 % in the dry year 2012 possible due to the ground water access
5
ofQ. suber trees leaving no water for ground water replenishing and runoffgeneration. If trends of decreasing annualP continue, sustainable effects on local ground water reservoirs and storage basins may be expected. (2) The understorey gross primary productivity GPPu and the overstorey gross primary productivity GPPo were reduced by 53 % and 28 %, respectively, in 2012 compared to 2011 due to a late onset of 2011
10
autumn rains and an additional severe winter/spring drought. Long term changes in understorey species composition and tree productivity are likely if prolonged summer droughts and additional winter/spring droughts become more frequent. (3) A combined photosynthesis and stomatal conductance model worked best if it was able to adapt the apparent maximum carboxylation rateVc,maxand the stomatal conductance
param-15
eters simultaneously. The slopem of the stomatal conductance model had to be in-creased to compensate partly for the strong decrease in carboxylation rate. The model adjusted also the sensitivity of the stomata D0 to vapour pressure deficit vpd in the Leuning model because both stomatal parameters,mandD0 are strongly correlated. The model performance was similar to the Ball–Berry approach. (4) The combined
20
photosynthesis and stomatal conductance model also adjusted the optimum temper-ature of electron transport Topt to lower values. This decreases carbon sequestration under higher temperatures but makes the photosynthetic apparatus also more vulnera-ble to heat stress in dry years. (5) The ecosystem was a carbon sink in both years with a 38 % reduced sink strength in the dry year 2012 compared to 2011. Gross primary
25
BGD
11, 10365–10417, 2014
Drought impact on Mediterranean
Quercus suber L.
woodland during extreme drought
A. Piayda et al.
Title Page
Abstract Introduction
Conclusions References
Tables Figures
◭ ◮
◭ ◮
Back Close
Full Screen / Esc
Printer-friendly Version
Interactive Discussion
Discussion
P
a
per
|
Discus
sion
P
a
per
|
Discussion
P
a
per
|
Discussion
P
a
per
|
Appendix A: Photosynthesis-stomatal conductance model
Carbon assimilationA[mol(CO2) m−2s−1] was modelled with the Farquhar et al. (1980) model in the form of Knorr (2000) and enhanced by a smooth minimum function smin:
A=smin{JC;JE;η} −Rd (A1)
5
with the carboxylation-limited rateJC[mol(CO2) m −2
s−1], the electron transport-limited rateJE [mol(CO2) m−2s−1] and mitochondrial respiration Rd [mol(CO2) m−2s−1]. The smoothing parameterηwas set to 0.9. The Rubisco-limited rateJCwas described by:
JC=Vc,max
Ci−Γ⋆
Ci+KC1+Oi
KO
(A2)
10
with maximum carboxylation rate Vc,max [mol(CO2) m−2s−1], CO2 concentration in-side the stomatal cavity Ci [mol(CO2) mol(air)−1], CO2 compensation point Γ⋆
[mol(CO2) mol(air)−1] (set to leaf temperature Tl×1.7×10⁻⁶), Michaelis–Menten con-stants for CO2KC[mol(CO2) mol(air)−1] and O2KO[mol(O2) mol(air)−1], respectively.Oi
[mol(O2) mol(air)−1] is the stomatal cavity O2concentration taken as 21 %. The
RuBP-15
limited CO2assimilation rateJEwas described by:
JE=J Ci−Γ⋆
4 (Ci+2Γ⋆)
(A3)
with the rate of electron transportJ[mol m−2s−1] as:
J=Jmax
αPAR
q
Jmax2 +α2PAR2
(A4)