Effects of Dietary Pantothenic Acid on
Growth, Intestinal Function, Anti-Oxidative
Status and Fatty Acids Synthesis of Juvenile
Blunt Snout Bream
Megalobrama
amblycephala
Yu Qian, Xiang-Fei Li, Ding-Dong Zhang, Dong-Sen Cai, Hong-Yan Tian, Wen-Bin Liu*
College of Animal Science and Technology, Nanjing Agricultural University, Nanjing, Jiangsu Province, People’s Republic of China
Abstract
Four groups of juvenileMegalobrama amblycephalawere fed three times daily with six semi-purified diets containing 3.39 (PA unsupplied diet), 10.54, 19.28, 31.04, 48.38 and 59.72 mg kg-1calcium D-pantothenate. The results showed that survival rate, final weight, specific growth rate, protein efficiency ratio and nitrogen retention efficiency all increased significantly (P<0.01) as dietary PA levels increased from 3.39 to 19.28 mg kg-1, whereas the opposite was true for feed conversion ratio. Whole-body crude protein increased as die-tary PA levels increased, while the opposite pattern was found for the crude lipid content. Intestinalα-amylase, lipase, protease, Na+-K+-ATPase, alkaline phosphatase and gamma-glutamyl transferase activities were all elevated in fish fed PA-supplemented diets. Hepatic catalase activities improved with increases in dietary PA, while the opposite was true for malondialdehyde contents. The liver PA concentration and coenzyme A content rose signifi-cantly (P<0.01), up to 31.04 mg kg-1, with increasing dietary PA levels and then plateaued. The percentage of hepatic saturated fatty acids increased significantly (P<0.01) as dietary PA levels increased, while the percentages of monounsaturated fatty acids and polyunsatu-rated fatty acid (PUFA) decreased as dietary PA increased. Fish fed diets containing 19.28 and 31.04 mg kg-1PA exhibited higher (P<0.01) docosahexaenoic acid and PUFA percent-ages in muscle than those fed with other diets. The expression of the gene encoding panto-thenate kinase was significantly up-regulated (P<0.01) in fish fed PA-supplemented diets. Hepatic Acetyl-CoA carboxylaseα, fatty acid synthetase, stearoyl regulatory element-binding protein 1 and X receptorαgenes all increased significantly (P<0.01) as dietary PA levels increased from 3.39 to 31.04 mg kg-1. Based on broken-line regression analyses of weight gain, liver CoA concentrations and PA contents against dietary PA levels, the optimal dietary PA requirements of juvenile blunt snout bream were estimated to be 24.08 mg kg-1.
a11111
OPEN ACCESS
Citation:Qian Y, Li X-F, Zhang D-D, Cai D-S, Tian H-Y, Liu W-B (2015) Effects of Dietary Pantothenic Acid on Growth, Intestinal Function, Anti-Oxidative Status and Fatty Acids Synthesis of Juvenile Blunt Snout
BreamMegalobrama amblycephala. PLoS ONE
10(3): e0119518. doi:10.1371/journal.pone.0119518
Academic Editor:Fanis Missirlis, CINVESTAV-IPN, MEXICO
Received:June 7, 2014
Accepted:January 28, 2015
Published:March 17, 2015
Copyright:© 2015 Qian et al. This is an open access article distributed under the terms of the
Creative Commons Attribution License, which permits unrestricted use, distribution, and reproduction in any medium, provided the original author and source are credited.
Data Availability Statement:All relevant data are within the paper and its Supporting Information files.
Funding:Funding provided by Special Fund for Agro-scientific Research in the Public Interest of Ministry (201003020); the funds of the National Technology System for Conventional Freshwater Fish Industries of China (CARS-46-20). The funders had no role in study design, data collection and analysis, decision to publish, or preparation of the manuscript.
Introduction
Pantothenic acid (PA) is an essential water-soluble vitamin for fish. It participates in numerous intermediary metabolic reactions as a component of coenzyme A (CoA), which plays a crucial role in reactions which glucose, fatty acids and amino acids enter into energy-yielding tricar-boxylic acid cycle, acetylation of choline to from the neurotransmitter acetylcholine and bio-synthesis of fatty acids [1–3]. Considering its significant role in intermediary metabolism, the optimal dietary PA requirement has been determined for several fish species during the past few decades, including common carp (Cyprinus carpioL.), blue tilapia (Oreochromis aureus), channel catfish (Ictalurus punctatus), rainbow trout (Oncorhynchus mykiss), grouper (Epine-phelus malabaricus), Jian carp (Cyprinus carpio var. Jian) and yellowtail (Seriola
quinquera-diata) [2–12]. However, the aforementioned studies have mainly focused on carnivorous and
omnivorous fish, the optimal dietary PA requirement of herbivorous species has while received little attention. In addition, the optimal PA requirement for fish has generally been determined based on growth performance. The potential mechanisms underlying these progresses are still unknown. The growth of fish has been reported to be positively correlated with feed utilization, which depends greatly on the digestive and absorptive capacities [13]. It is generally acknowl-edged that the intestinal enzymes activities are reliable indicators of intestinal functions [14,15]. Accordingly, the investigations of intestinal enzymes activities might partly shed light on the growth retardation and poor feed efficiency of fish fed PA deficient diets. Unfortunately, the correlation between dietary PA levels and the digestive and absorptive capacities of fish still remains poorly understood.
So far, the effects of nutritional factors on the anti-oxidative defenses of fish have been ex-tensively investigated. However, whether or not dietary PA supplementation could affect the oxidative status of fish is still unknown. Recently, PA and its related compounds have been re-ported to protect the cell membrane against damage caused by lipid peroxidation in an in vitro study using tumor cells [16], indicating the potential correlation between dietary PA levels and body anti-oxidative capability. In addition, it has been shown that oxidative stresses might ren-der fish susceptible to different diseases [17]. This might suggest a close connection between oxidative status and health status of fish, as is still poorly understood. Therefore, oxidative sta-tus should also be considered when evaluating the optimal PA requirement for fish under farming conditions to assess its welfare state.
Bearing these in mind, the present study was conducted to estimate the optimal dietary PA requirement of juvenile blunt snout bream (Megalobrama amblycephala), an economically im-portant herbivorous freshwater fish widely cultured in China. In addition, the potential regula-tory effects of dietary PA on the intestinal enzymes activities, anti-oxidative status and fatty acid synthesis of fish were also investigated.
Materials and Methods
Ethic statement
Animal care and use were conducted in accordance with the Animal Research Institute Commit-tee guidelines of Nanjing Agriculture University, China. This study was specifically approved by the Committee of the Animal Research Institute of Nanjing Agriculture University, China.
Diets
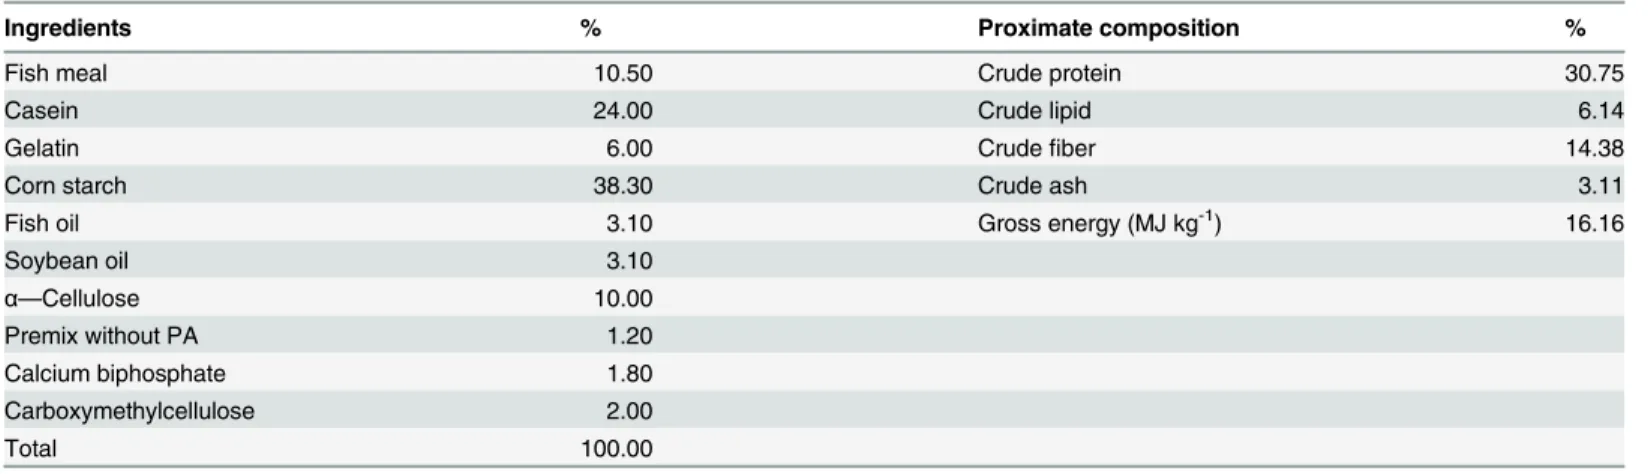
The formulation and proximate composition of the basal diet are presented inTable 1, which contained 30.75% crude protein and 6.14% crude lipid [23]. Six semi-purified diets were for-mulated to contain 0, 8, 16, 32, 48 and 64 mg kg-1calcium D-pantothenate. Fish meal, casein and gluten were adopted as protein sources. Equal proportions of fish oil and soybean oil were supplemented as lipid sources. Corn starch served as the single carbohydrate source. The PA concentrations of the experimental diets were determined to be 3.39, 10.54, 19.28, 31.04, 48.38 and 59.72 mg kg-1, respectively, via high-performance liquid chromatography (HPLC) [24].
All diets were prepared in the laboratory as detailed by Liet al. and Jianget al. [25,26]. The ingredients were ground into fine powder and mixed thoroughly with soybean oil and fish oil until they were homogenous. Then, an appropriate amount of water was added to produce a stiff dough. The dough was subsequently pelleted using a laboratory pellet machine and dried in a ventilated oven at room temperature. The prepared feed was stored at -20°C in plastic-lined bags until use.
Fish and feeding trial
Blunt snout bream juveniles were obtained from the Fish Hatchery of Yangzhou (Jiangsu, China). The feeding trial was performed in an indoor recirculating aquaculture system. Prior to the experiment, the fish were reared in several plastic tanks (3×0.8×0.8m, L:W:H) for 2 weeks to acclimate to the experimental conditions by feeding a commercial diet containing 320 g kg-1crude protein and 60 g kg-1crude lipid. After the conditioning period, fish of similar sizes (average initial weight of 6.04±0.02 g) were randomly distributed into 24 plastic tanks (3×0.8×0.8m, L:W:H) at a rate of 30 fish per tank. The fish in each aquarium were randomly as-signed to one of six experimental diets. Each diet was tested in four replicates. The fish were fed to apparent satiation three times daily (8:00, 12:00 and 16:00 h) for 8 weeks. At each feeding time, we checked all of the tanks. If a dead fish was found, it would be weighed, recorded and stored at -20°C. No humane endpoints were used during the survival study. A 12:12 h light: dark regime (07:30–19:30 h, light period) was maintained with timed fluorescent lighting. The water temperature ranged from 25 to 30°C; pH fluctuated between 7.2 and 7.4; dissolved oxy-gen was maintained above 5.0 mg L-1; and total ammonia nitrogen and nitrite were kept below 0.2 and 0.005 mg L-1, respectively, during the feeding trial.
Sample collection
The total number and weight of the fish in each aquarium were subsequently determined. Sam-ples of 20 fish at the beginning and 6 fish per tank at the end of the feeding trial were collected and stored at -20°C for body composition analysis. A total of 8 fish per tank were sacrificed for collection of liver and intestinal samples. Livers were quickly removed and stored at -20°C for subsequent analysis. Four of the livers were used for the measurement of anti-oxidative status and the concentrations of CoA and PA, while the others were analyzed for lipid and fatty acids contents. The intestine was also separated and scoured with physiological saline, then stored at -20°C for analysis of intestinal enzyme activities. The remaining fish were all sampled for the analysis of biometric parameters.
Proximate composition analysis
The diets and fish were analyzed to determine their proximate composition according to the procedures detailed by the AOAC (1990) [27]. Moisture contents were determined by drying to a constant weight at 105°C. Crude protein (nitrogen×6.25) was measured using a Kjeltec An-alyzer Unit. Crude lipid was determined via ether extraction using a Soxtec Auto Extraction Unit. Ash contents were measured through combustion at 550°C for 4 h. Liver PA contents were determined as described by Woollardet al. [24].
Measurement of intestinal enzyme activities
Intestinal samples were carefully homogenized on ice in 10 volumes (w:v) of ice-cold physio-logical saline (0.85% (w:v)) and then centrifuged at 3, 000 rmp min-1for 10 min at 4°C. The su-pernatant was subsequently analyzed to determine the activities of intestinal enzymes. Protein concentrations were determined with Folin-phenol reagent, using BSA as standard to enable the calculation of enzyme-specific activities [25,28]. Protease activity was assayed with 10 g kg-1casein as substrate at the optimal pH for intestine (o.1 M Tris-HCl buffer, pH 8.0), 28°C for 45 min, stopped with 15% trichloroacetic acid (TCA), and the optical density of the supernatant was read at 280 nm against tyrosine as standard. A substrat-free control and an en-zyme-free control were both run with the experimental samples. Specific activity was expressed
Table 1. Formulation and proximate composition (% air-dry basis) of the basal diet.
Ingredients % Proximate composition %
Fish meal 10.50 Crude protein 30.75
Casein 24.00 Crude lipid 6.14
Gelatin 6.00 Crudefiber 14.38
Corn starch 38.30 Crude ash 3.11
Fish oil 3.10 Gross energy (MJ kg-1) 16.16
Soybean oil 3.10
α—Cellulose 10.00
Premix without PA 1.20
Calcium biphosphate 1.80
Carboxymethylcellulose 2.00
Total 100.00
Premix provided the following minerals and/or vitamins (per kg premix): CuSO45H2O 2.00 g, FeSO47H2O 25.00 g, ZnSO47H2O 22.00 g, MnSO44H2O
7.00 g, Na2SeO30.04 g, KI 0.026 g, CoCl26H2O 0.10 g, Vitamin A 900,000.00 IU, Vitamin D 200,000.00 IU, Vitamin E 4500.00 mg, Vitamin K3 220.00
mg, Vitamin B1 320.00 mg, Vitamin B2 1090.00 mg, Vitamin B6 500.00 mg, Vitamin B12 1.60 mg, Vitamin C 10,000.00 mg, Folic acid 165.00 mg, Choline 120,000.00 mg, Niacin 2500.00 mg, Biotin 100.00 mg, Myoinositol 15,000.00 mg.
as micromoles of hydrolyzed substrate min-1g-1tissue protein (U g-1tissue protein) [29]. The activities ofα-amylase, lipase,Na+,K+-ATPase, alkline phosphatase (AKP) and gamma-glutamyl transferase (γ-GT) were measured by the commercial kits [14,30–33].
Analysis of the hepatic anti-oxidative status
For determination of the hepatic anti-oxidative status, liver samples were prepared as described by Lygrenet al. [34]. Briefly, the liver samples were homogenized on ice in 5 volumes (w:v) of ice-cold physiological saline 0.85% (w:v), followed by centrifugation at 3000 rmp min-1for 10 min at 4°C. The supernatant was used for subsequent analysis. The liver malondialdehyde (MDA) content was determined using the thiobarbituric acid test according to Satho [35]. Liver superoxide dismutase (SOD), catalase (CAT) and glutathione peroxidase (GPX) activities as well as glutathione (GSH) concentrations were all determined following the methods de-scribed by Lygrenet al. [34]. All these measurement was operated by the commercial kits.
Tissue lipid concentration and fatty acid composition
The total lipid concentration in the liver was determined as described by Folchet al. using chlo-roform:methanol (2:1, v:v) to extract total lipids [36]. The fatty acids of the lipids were then methylated using 0.5 mol L-1NaOH in methanol for 30 min at 60°C and esterified in 25% boron trifluoride (BF3) in methanol. FA methyl esters were subsequently analyzed and quanti-fied using a Shimadzu GC-201 gas chromatograph in a cross-linked 5% phenyl methyl silicone gum phase column (length, 30 m; internal diameter, 0.32 mm; film thickness, 0.25 mm; N2 as the carrier gas), equipped with flame ionization detection. The injector and detector tempera-tures were both 250°C. The oven temperature was kept at 100°C for 3 min, then raised to 180° C at a rate of 10°C min-1and to 240°C at a rate of 3°C min-1. The relative quantity of each FA was determined by measuring the area under the chromatograph peak.
Total RNA extraction, reverse transcription and real-time PCR
Total RNA was extracted from the livers of juvenile blunt snout bream using the TRIzol re-agent according to the manufacturer’s instructions and treated with RQ1 RNase-free DNase to eliminate genomic DNA contamination. The quantity and purity of the RNA was determined based on absorbance measurements (A260/280), and its integrity was tested via electrophoresis in 1.0% formaldehyde denaturing agarose gels. cDNA was generated from 500 ng of DNase-treated RNA using the ExScript RT-PCR kit. The mixture consisted of 500 ng of RNA, 2μl of
buffer (5×), 0.5μl of a dNTP mixture (10 mM each), 0.25μl of RNase inhibitor (40 Uμl-1), 0.5 μl of a dT-AP primer (50 mM), 0.25μl ExScript RTase (200 Uμl-1) and 6.5μl of DEPC H2O, in
a total volume of 10μl. The reaction conditions were as follows: 42°C for 40 min, 90°C for
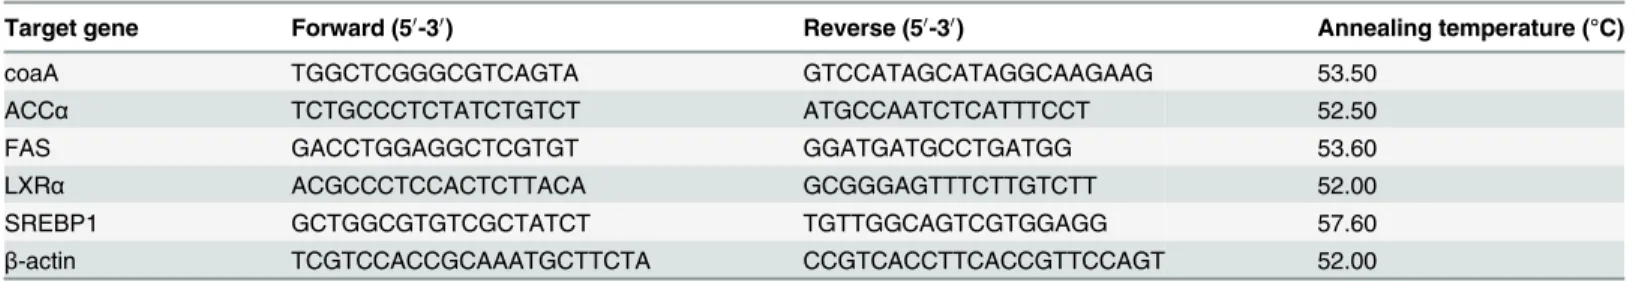
2 min and 4°C thereafter. The resulting first-strand cDNA from each tissue was then diluted and used as a template for PCR. The set of primers for the PANKα, LXRα, ACCα, FAS and SREBP1 genes were designed with Primer 5 according to the codifying sequences obtained in our laboratory (Table 2). RT-PCR was conducted in a Mini Option real-time detector. The final volume of the amplification reactions was 25μL, which contained 2μL of a cDNA sample,
12.5μL of 2×SYBR Green I Master Mix, 0.5μL of each primer (Table 2) and 9.5μL of dH2O.
Calculations
Surival rate (%) = final number of fish × 100 / initial fish number. Specific growth rate (SGR, % day-1) = (Ln Wt—Ln W0) × 100 / T.
Feed conversion ratio (FCR) = Feed consumption (g) / fish weight gain (g). Protein efficiency ratio (PER) = Fish weight gain (g) / protein intake (g).
Dressout percentage (DP, %) = Carcass (with head and viscera removed) weight (g) × 100 / body weight (g).
Condition factor (CF, %) = Body weight (g) × 100 / body length (cm)3. Hepatosomatic index (HSI, %) = Liver weight (g) × 100 / body weight (g). Viscera / body ratio (VBR, %) = Viscera weight (g) × 100 / body weight (g).
Nitrogen retention efficiency (NRE, %) = [(Wt× Ct)—(W0× C0)] × 100 / (Cdiet× feed in-take (g)), where W0and Wtare the initial and final body weight; T is the culture period in days; C0and Ctare the initial and final nitrogen contents in whole body, respectively; and Cdietis the nitrogen content in the diets.
Statistical analysis
The data were subjected to one-way analysis of variance (ANOVA) to test the effects of dietary PA levels on the performance of fish after testing the homogeneity of variances with the Levene test. When significant (P<0.05) differences were found, Duncan’s multiple range test was used to rank the means. Percentage data were arc-sine transformed prior to ANOVA and reversed afterward [38]. The analyses were performed using the SPSS program, version 16.0 for Win-dows. All data are presented as the means ± SD (standard deviation) of four replicates. In addi-tion, broken-line regression analysis was performed to determine the regression of weight gain, liver PA contents and the hepatic CoA concentration on dietary PA levels to establish the opti-mum PA requirements [39].
Results
Growth performance and feed utilization
In the 6thweek of the feeding trail, the blunt snout bream juveniles fed the control diet began to show signs of deficiency, such as anorexia, abnormal swimming activity, growth retardation and hemorrhage of the body surface and fins.
The growth performance and feed utilization of the juvenile blunt snout bream are pre-sented inTable 3. The survival rate, final weight, SGR, PER and NRE of the juvenile blunt snout bream all increased significantly (P<0.01) as dietary PA levels increased from 3.39 to
Table 2. Nucleotide sequences of the primers used to assay gene expression by real-time PCR.
Target gene Forward (50-30) Reverse (50-30) Annealing temperature (°C)
coaA TGGCTCGGGCGTCAGTA GTCCATAGCATAGGCAAGAAG 53.50
ACCα TCTGCCCTCTATCTGTCT ATGCCAATCTCATTTCCT 52.50
FAS GACCTGGAGGCTCGTGT GGATGATGCCTGATGG 53.60
LXRα ACGCCCTCCACTCTTACA GCGGGAGTTTCTTGTCTT 52.00
SREBP1 GCTGGCGTGTCGCTATCT TGTTGGCAGTCGTGGAGG 57.60
β-actin TCGTCCACCGCAAATGCTTCTA CCGTCACCTTCACCGTTCCAGT 52.00
coaA, pantothenate kinase gene; ACCα, acetyl-CoA carboxylaseαgene; FAS, fatty acid synthase gene; LXRα, liver X receptorα; SREBP1, sterol regulatory element-binding protein-1
31.04 mg kg-1, whereas the opposite was true for the FCR. However, these parameters all showed no additional significant changes (P>0.05) with further increases in PA levels. Based on the broken-line regression analysis of weight gain against dietary PA levels, the optimal die-tary PA level for juvenile blunt snout bream was estimated to be 23.91 mg kg-1(Fig. 1).
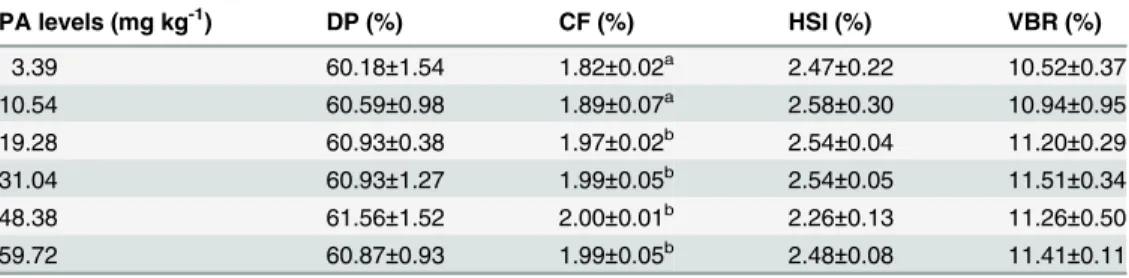
As can be seen fromTable 4, CF increased significantly (P<0.01) as dietary PA levels in-creased from 3.39 to 19.28 mg kg-1, though no additional significant differences (P>0.05) were found in the groups with further increases in PA levels. However, DP, HSI and VBR displayed no significant differences (P>0.05) among all of the treatments.
Body composition and liver lipid content
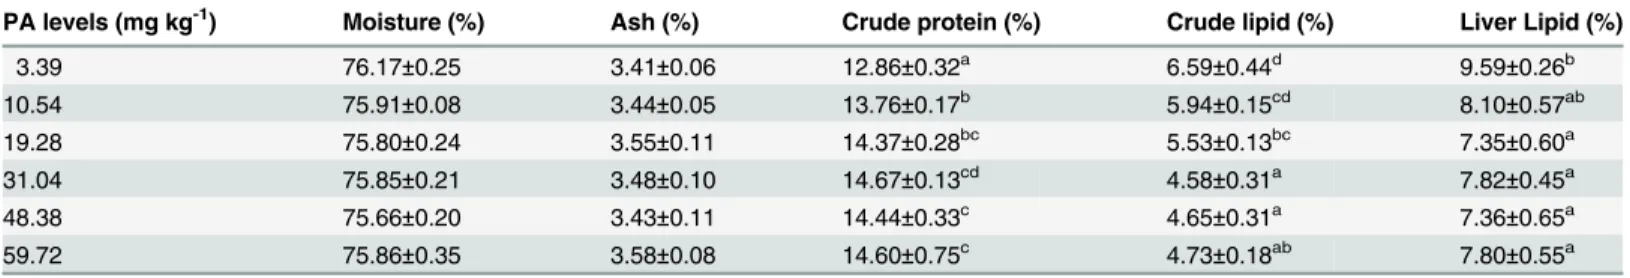
The details presented inTable 5show that the graded dietary PA levels had no significant (P>0.05) effects on body ash and moisture contents. The body lipid content decreased signifi-cantly (P<0.01) as dietary PA levels increased from 3.39 to 31.04 mg kg-1, though no additional significant differences were found (P>0.05) with further increases in dietary PA levels, whereas the crude protein content exhibited an opposite trend. The liver lipid contents of fish fed 3.39 and 10.54 mg kg-1PA were significantly (P<0.01) higher than those of the other groups.
Liver CoA and PA contents
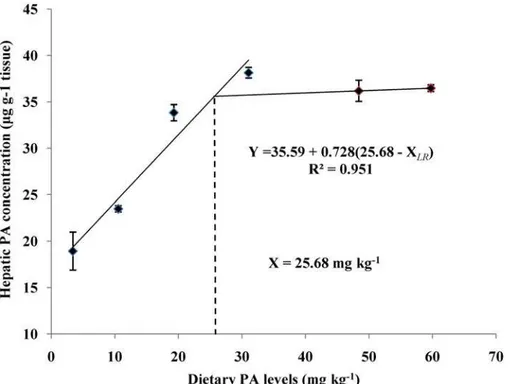
The liver CoA and PA contents of juvenile blunt snout bream fed different dietary PA levels was shown inFig. 2andFig. 3. The liver CoA concentration increased significantly (P<0.01) as dietary PA levels increased from 3.39 to 19.28 mg kg-1but showed no additional significant dif-ferences (P>0.05) with further increases in dietary PA levels. The liver PA concentration also rose significantly as dietary PA levels increased from 3.39 to 19.28 mg kg-1, then displayed a plateau up to 59.72 mg kg-1. Based on the broken-line regression analysis of liver CoA and PA concentrations against dietary PA levels, the optimal dietary PA levels for juvenile blunt snout bream were estimated to be 24.08 and 25.68 mg kg-1, respectively.
Intestinal absorptive and digestive enzyme activities
The intestinal enzyme activities determined in the juvenile blunt snout bream fed different die-tary PA levels are shown inTable 6. The activities of intestinalα-amylase, lipase, protease, Na+-K+-ATPase, AKP andγ-GT all increased significantly (P<0.01) as dietary PA levels in-creased from 3.39 to 10.54 mg kg-1. However, these parameters all showed no additional signif-icant differences (P>0.05) with further increases in dietary PA levels.
Hepatic anti-oxidative status
As can be seen inTable 7, liver SOD and GPX activities as well as GSH contents showed little difference (P>0.05) among all of the treatments. The liver CAT activities of fish fed 31.04 and 48.38 mg kg-1PA were significantly (P<0.01) higher than those of fish fed the control diet, but they exhibited no significant differences (P>0.05) from those of the other groups. In addition, liver MDA in fish fed the control diet was significantly (P<0.01) higher than those in the other groups.
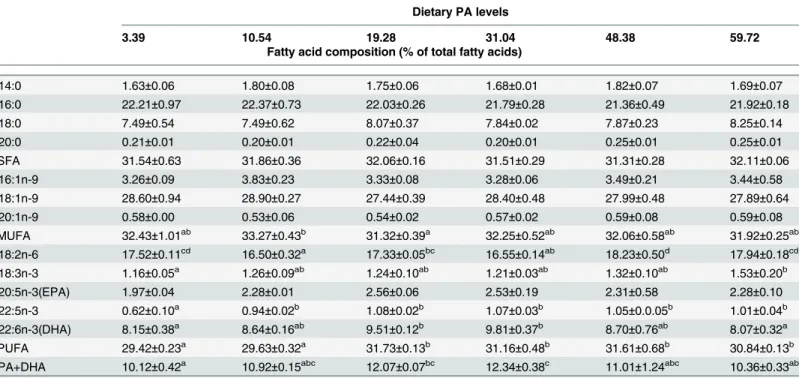
Fatty acid composition
Effects of graded dietary PA levels on the FA composition of the liver and muscle are shown in
of monounsaturated fatty acids (MUFA), docosahexaenoic acid (DHA) and polyunsaturated fatty acids (PUFA).
No significant (P>0.05) difference was observed in SFA levels among all the treatments in muscle. The DHA levels increased markedly as dietary PA levels increased from 3.39 to 19.28 mg kg-1, but showed a slight decreasing trend with further increases in dietary PA levels. In ad-dition, the muscle PUFA levels in fish fed 3.39 and 10.54 mg kg-1PA were significantly lower (P<0.01) than those of the other groups. However, the levels of n-3 highly unsaturated fatty acids (DHA+EPA) increased significantly (P<0.01) with increasing dietary PA levels.
Expression of the hepatic coaA, LXR
α
, ACC, FAS and SREBP1genes
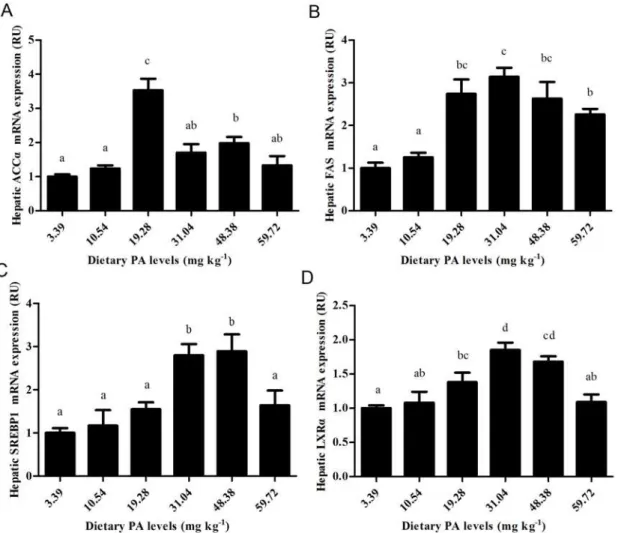
The details presented inFig. 4andFig. 5show that graded dietary PA levels had significant (P<0.01) effects on the relative mRNA expression of the coaA, LXRα, ACCα, FAS and
Table 3. Effects of dietary PA levels on growth performance and feed utilization of juvenile blunt snout bream.
PA levels (mg kg-1) Survival rate (%) Initial weight (g) Final weight (g) SGR (%) FCR PER NRE (%)
3.39 78.33±3.19a 6.04±0.03 16.74±0.51a 1.82±0.05a 3.52±0.11c 1.18±0.07a 17.95±1.17a
10.54 93.33±2.72b 6.04±0.04 19.74±0.28b 2.11±0.02b 2.81±0.25b 1.26±0.09ab 19.13±1.26ab
19.28 95.00±3.19b 6.06±0.02 22.01±0.25c 2.30±0.02c 2.76±0.25ab 1.26±0.09ab 21.22±1.99abc 31.04 96.67±1.92b 6.04±0.04 23.62±1.01c 2.43±0.08c 2.21±0.17a 1.53±0.09c 23.74±1.00c
48.38 95.00±1.67b 6.05±0.05 23.48±0.76c 2.42±0.05c 2.27±0.09ab 1.50±0.04bc 22.96±1.03bc
59.72 96.67±1.92b 6.04±0.05 23.39±0.84c 2.42±0.06c 2.49±0.13ab 1.36±0.10abc 20.69±1.41abc
Values are presented as mean±SD of four replications (n = 4). Means in the same column with different superscripts are significantly different (P<0.05).
SGR, specific growth rate; FCR, feed conversion ratio; PER, protein efficiency ratio; NRE, nitrogen retention efficiency.
doi:10.1371/journal.pone.0119518.t003
Fig 1. Relationship between dietary PA levels and weight gain (%) of juvenile blunt snout bream.
SREBP1genes in the liver of juvenile blunt snout bream. The expression of the coaA gene in fish fed the control diet was significantly (P<0.01) lower than in the other groups. The expres-sion of LXRα, ACCα, FAS and SREBP1 all increased significantly (P<0.01) as dietary PA levels increased from 3.39 to 31.04 mg kg-1, then decreased slightly with further increases in dietary PA levels (P>0.05).
Discussion
Dietary PA deficiency usually results in several deficiency syndromes in fish, including growth retardation and poor feed efficiency [3–11]. The results of this study clearly demonstrated that PA is essential for the normal growth of juvenile blunt snout bream, as was supported by the high mortality and poor growth performance observed both in fish fed the control diet. In ad-dition, final weight and SGR both increased significantly with increasing dietary PA levels, while the opposite was true for FCR. According to previous studies, this growth improvement may be ascribed to the following factors. Firstly, dietary PA supplementation enhanced the tis-sue CoA concentration of juvenile blunt snout bream, as consequently promoted its growth performance. This is supported by the fact that CoA is generally recognized as the most impor-tant metabolic component of the intermediary metabolism [4], and a positive correlation be-tween tissue CoA contents and body growth is generally observed in animals [40]. In fact, liver CoA content in this study increased significantly as dietary PA levels increased from 3.39 to 31.04 mg kg-1and then plateaued, further confirming this assumption. Secondly, dietary PA supplementation improved the body protein deposition of juvenile blunt snout bream, as con-sequently benefited its growth performance. This is supported by the fact that protein deposi-tion usually makes the greatest contribudeposi-tion to fish body growth [41]. In fact, in this study, weight gain, PER, NRE and whole-body protein content of fish all increased significantly as di-etary PA levels increased from 3.39 to 31.04 mg kg-1, indicating that the ability of fish to utilize and deposit protein might be strengthened by dietary PA supplementation. Thirdly, dietary PA supplementation enhanced the intestinal digestive and absorptive enzymes activities of juvenile blunt snout bream, leading to the improved feed utilization and growth. This was supported by the fact that the growth of fish is often positively correlated with feed utilization, which de-pends greatly on the digestive and absorptive functions of intestine [15,42,43]. In fact, it has been reported in terrestrial animals that PA can maintain the integrity and the normal function of intestine [44]. In the present study, the lowest intestinal absorptive and digestive enzyme ac-tivities were all observed in the fish fed the control diet, indicating that PA deficiency may lead to the hampered intestinal function of blunt snout bream, as consequently resulting in growth
Table 4. Effects of dietary PA levels on body parameters of juvenile blunt snout bream.
PA levels (mg kg-1) DP (%) CF (%) HSI (%) VBR (%)
3.39 60.18±1.54 1.82±0.02a 2.47±0.22 10.52±0.37
10.54 60.59±0.98 1.89±0.07a 2.58±0.30 10.94±0.95
19.28 60.93±0.38 1.97±0.02b 2.54±0.04 11.20±0.29
31.04 60.93±1.27 1.99±0.05b 2.54±0.05 11.51±0.34
48.38 61.56±1.52 2.00±0.01b 2.26±0.13 11.26±0.50
59.72 60.87±0.93 1.99±0.05b 2.48±0.08 11.41±0.11
Values are presented as mean±SD of four replications (n = 4). Means in the same column with different superscripts are significantly different (P<0.05). DP, dressout percentage; CF, condition factor; HSI,
hepatosomatic index.
retardation. Based on the broken-line regression analysis of weight gain against dietary PA lev-els, the optimal dietary PA level for juvenile blunt snout bream was estimated to be 23.91 mg kg-1. However, higher requirements were obtained by the regression analysis between dietary PA levels and hepatic PA and CoA concentrations, as was in line with the results observed in common carp, yellowtail and grouper [2,3,12]. Nevertheless, to achieve the rapid growth and maintain normal physiological functions, the optimal PA requirement of juvenile blunt snout bream may be 24.08 mg kg-1, which was based on the broken-line regression analysis of liver CoA content.
To date, the role of dietary PA on intestinal function has been widely investigated in mam-mals [45], and a consensus has been reached that intestinal function is positively correlated with tissue CoA content [46]. For example, the morphological changes and low transporting
Table 5. Effects of dietary PA levels on whole-body composition (% wet weight) and liver lipid content (% wet liver weight) of juvenile blunt snout bream.
PA levels (mg kg-1) Moisture (%) Ash (%) Crude protein (%) Crude lipid (%) Liver Lipid (%)
3.39 76.17±0.25 3.41±0.06 12.86±0.32a 6.59±0.44d 9.59±0.26b
10.54 75.91±0.08 3.44±0.05 13.76±0.17b 5.94±0.15cd 8.10±0.57ab
19.28 75.80±0.24 3.55±0.11 14.37±0.28bc 5.53±0.13bc 7.35±0.60a
31.04 75.85±0.21 3.48±0.10 14.67±0.13cd 4.58±0.31a 7.82±0.45a
48.38 75.66±0.20 3.43±0.11 14.44±0.33c 4.65±0.31a 7.36±0.65a
59.72 75.86±0.35 3.58±0.08 14.60±0.75c 4.73±0.18ab 7.80±0.55a
Values are presented as mean±SD of four replications (n = 4). Means in the same column with different superscripts are significantly different (P<0.05).
doi:10.1371/journal.pone.0119518.t005
Fig 2. Relationship between dietary PA levels and hepatic PA concentration (μg g-1tissue) of juvenile blunt snout bream.
ability of intestine observed in pigs fed PA deficient diet have been ascribed to low tissue CoA content [44]. However, there is quite limited information concerning the effects of dietary PA levels on the intestinal functions of fish. In the present study, fish fed control diet obtained the lowest intestinal activities of Na+-K+-ATPase,γ-GT, AKP, protease, amylase and lipase, indi-cating that dietary PA deficiency might result in the hampered intestinal functions of blunt snout bream. This was supported by the fact that nutrient digestion and absorption at the intes-tinal epithelium is an ATP-bound process catalyzed by both intesintes-tinal brush border enzymes (such as Na+-K+-ATPase,γ-GT and AKP) and digestive enzymes (protease, amylase and li-pase), whose activities can directly reveal the digestive and absorptive capacities of fish [15]. In fact, intestinal enzymes generally play a key role in the nutrient utilization of stomachless fish
Fig 3. Relationship between dietary PA levels and hepatic CoA concentration (μg g-1tissue) of juvenile blunt snout bream.
doi:10.1371/journal.pone.0119518.g003
Table 6. Effects of dietary PA levels on intestinal absorptive enzyme and digestive enzyme activities of juvenile blunt snout bream.
Dietary PA levels (mg kg-1)
Na+-K+-ATPase (U g-1 prot)
γ-GT (U g-1 prot)
AKP (U mg-1 prot)
Lipase (U g-1 prot)
α-Amylase (U g-1 prot)
Protease (U mg-1 prot)
3.39 5.33±0.59a 9.90±1.09a 35.34±3.06a 8.18±0.21a 713.38±28.80a 77.65±3.25a 10.54 9.35±0.97b 14.96±0.71b 48.36±0.79b 12.77±1.01a 824.39±15.36b 92.49±3.12b
19.28 11.26±0.78bc 16.82±0.44bc 87.31±1.19d 19.42±1.22c 819.41±6.18b 104.83±4.83b
31.04 11.48±0.83bc 16.50±0.24bc 72.83±1.12c 21.19±1.23c 857.61±16.36b 102.34±3.58b
48.38 12.74±1.24c 18.58±0.55c 82.07±4.27d 19.60±1.06c 832.94±6.91b 106.24±6.41b 59.72 11.96±0.84bc 17.71±0.60c 88.02±2.17d 20.91±2.77c 852.48±13.08b 105.27±6.99b
Values are presented as mean±SD of four replications (n = 4). Means in the same row with different superscripts are significantly different (P<0.05).
γ-GT, gamma-glutamyl transferase; AKP, alkline phosphatase.
such as blunt snout bream. According to previous studies, this hypofunction might be ascribed to the abnormal energy metabolism since CoA is a crucial participant in the tricarboxylic acid cycle [47]. In addition, the activities of these intestinal enzymes all increased significantly as di-etary PA increased from 3.39 to 10.54 mg kg-1and then plateaued, indicating that dietary PA is essential for the maintenance of the normal intestinal functions of fish. The same trend was also observed in liver CoA content, as further confirmed the speculation that intestinal func-tion is positively correlated with tissue CoA content.
In the present study, the lowest liver CAT activity was obtained in fish fed the control diet. Similar results were also found in liver SOD and GPX activities as well as GSH contents al-though no significant difference was observed. This indicated that dietary PA deficiency might cause oxidative stress of juvenile blunt snout bream, as was supported by the fact that the
SOD-Table 7. Effects of dietary PA levels on hepatic ant-oxidative status of juvenile blunt snout bream.
Dietary PA levels (mg kg-1) MDA (nmol mg-1prot) CAT (U g-1prot) GSH (mg g-1prot) GPX (U mg-1prot) SOD (U g-1prot)
3.39 12.40±0.32b 10.07±0.62a 4.36±0.51 41.44±8.99 64.85±4.75
10.54 8.57±0.33a 11.21±0.69ab 4.17±0.66 46.96±5.21 70.46±10.57
19.28 9.37±0.50a 10.67±0.85a 5.18±0.61 39.73±9.66 74.38±9.45
31.04 8.20±0.79a 14.80±1.23b 4.97±0.43 31.35±4.73 69.45±7.34
48.38 9.45±0.83a 14.67±1.43b 4.79±0.18 36.87±3.75 73.99±11.43
59.72 8.64±0.93a 13.94±1.90ab 4.96±0.22 33.87±3.39 68.09±3.34
Values are presented as mean±SD of four replications (n = 4). Means in the same row with different superscripts are significantly different (P<0.05).
MDA, Malondialdehyde; CAT, catalase; GSH, glutathione; GPX, glutathione peroxidase; SOD, superoxide dismutase.
doi:10.1371/journal.pone.0119518.t007
Table 8. Effects of dietary PA levels on liver fatty acids composition of juvenile blunt snout bream.
Dietary PA levels
3.39 10.54 19.28 31.04 48.38 59.72
Fatty acid composition (% of total fatty acids)
C14:0 1.66±0.02bc 1.76±0.03c 1.64±0.01b 1.38±0.01a 1.42±0.00a 1.36±0.08a
C16:0 19.82±0.75a 20.51±0.52a 23.97±0.77b 24.20±0.72b 24.15±0.41b 24.07±0.70b
C18:0 13.89±0.68 13.53±0.80 13.00±0.05 13.30±0.01 13.19±0.03 13.43±0.06
C20:0 0.13±0.00b 0.12±0.01b 0.13±0.01b 0.10±0.01a 0.13±0.01b 0.11±0.01a
ΣSFA 35.49±0.47a 35.93±1.27a 38.74±0.72b 38.98±0.71b 38.89±0.40b 38.98±0.62b
C16:1n-9 3.23±0.26bc 3.38±0.52c 3.26±0.06bc 3.38±0.03c 2.530±10a 2.78±0.08ab
C18:1n-9 31.34±0.50 31.41±0.76 30.92±0.16 30.03±0.30 30.70±1.71 30.02±0.69
C20:1n-9 0.88±0.03b 0.82±0.04ab 0.73±0.05a 0.75±0.05a 0.73±0.05a 0.78±0.02ab
ΣMUFA 35.44±0.34 35.61±0.96 34.91±0.24 34.15±0.30 33.96±0.99 33.57±0.78
C18:2n-6 13.17±0.04 13.15±0.64 12.10±0.60 13.13±0.30 13.50±0.54 13.19±0.34
C18:3n-3 0.89±0.11 0.88±0.13 0.82±0.02 0.77±0.03 0.94±0.03 0.83±0.20
C20:5n-3(EPA) 0.93±0.06 0.81±0.08 0.71±0.10 0.75±0.03 0.77±0.08 0.77±0.06
C22:5n-3 0.53±0.12 0.54±0.15 0.52±0.12 0.58±0.00 0.58±0.11 0.57±0.03
C22:6n-3(DHA) 6.34±0.82b 5.64±0.58ab 4.98±0.22ab 4.00±0.25a 3.97±0.50a 4.70±0.58ab
ΣPUFA 21.87±0.69c 21.02±0.51bc 19.14±0.46a 19.98±0.30ab 20.51±0.65abc 20.55±0.14abc EPA+DHA 7.27±0.81b 6.45±0.62ab 5.69±0.28ab 5.50±0.28a 5.48±0.26a 5.96±0.53ab
Values are presented as mean±SD of four replications (n = 4). Means in the same row with different superscripts are significantly different (P<0.05).
Table 9. Effects of dietary PA levels on muscle fatty acids composition of juvenile blunt snout bream.
Dietary PA levels
3.39 10.54 19.28 31.04 48.38 59.72
Fatty acid composition (% of total fatty acids)
C14:0 1.63±0.06 1.80±0.08 1.75±0.06 1.68±0.01 1.82±0.07 1.69±0.07
C16:0 22.21±0.97 22.37±0.73 22.03±0.26 21.79±0.28 21.36±0.49 21.92±0.18
C18:0 7.49±0.54 7.49±0.62 8.07±0.37 7.84±0.02 7.87±0.23 8.25±0.14
C20:0 0.21±0.01 0.20±0.01 0.22±0.04 0.20±0.01 0.25±0.01 0.25±0.01
ΣSFA 31.54±0.63 31.86±0.36 32.06±0.16 31.51±0.29 31.31±0.28 32.11±0.06
C16:1n-9 3.26±0.09 3.83±0.23 3.33±0.08 3.28±0.06 3.49±0.21 3.44±0.58
C18:1n-9 28.60±0.94 28.90±0.27 27.44±0.39 28.40±0.48 27.99±0.48 27.89±0.64
C20:1n-9 0.58±0.00 0.53±0.06 0.54±0.02 0.57±0.02 0.59±0.08 0.59±0.08
ΣMUFA 32.43±1.01ab 33.27±0.43b 31.32±0.39a 32.25±0.52ab 32.06±0.58ab 31.92±0.25ab C18:2n-6 17.52±0.11cd 16.50±0.32a 17.33±0.05bc 16.55±0.14ab 18.23±0.50d 17.94±0.18cd
C18:3n-3 1.16±0.05a 1.26±0.09ab 1.24±0.10ab 1.21±0.03ab 1.32±0.10ab 1.53±0.20b
C20:5n-3(EPA) 1.97±0.04 2.28±0.01 2.56±0.06 2.53±0.19 2.31±0.58 2.28±0.10
C22:5n-3 0.62±0.10a 0.94±0.02b 1.08±0.02b 1.07±0.03b 1.05±0.0.05b 1.01±0.04b C22:6n-3(DHA) 8.15±0.38a 8.64±0.16ab 9.51±0.12b 9.81±0.37b 8.70±0.76ab 8.07±0.32a
ΣPUFA 29.42±0.23a 29.63±0.32a 31.73±0.13b 31.16±0.48b 31.61±0.68b 30.84±0.13b
EPA+DHA 10.12±0.42a 10.92±0.15abc 12.07±0.07bc 12.34±0.38c 11.01±1.24abc 10.36±0.33ab
Values are presented as mean±SD of four replications (n = 4). Means in the same row with different superscripts are significantly different (P<0.05).
doi:10.1371/journal.pone.0119518.t009
Fig 4. Relative mRNA expression ofcoaAgene in liver of juvenile blunt snout bream affected by dietary PA levels.
CAT system represents the first line of defense against oxidative stress and augmented activities of these free radical-scavenging enzymes (also include GPX and glutathione-S-transferase) usually indicate an enhanced anti-oxidative capability [48]. In addition, the highest liver MDA content was observed in fish fed PA-deficient diet, indicating again that dietary PA deficiency might cause oxidative stress of juvenile blunt snout bream. According to previous studies, tis-sue MDA levels provide a direct evidence of lipid peroxidation caused by free radicals or disor-dered lipid metabolism [49]. Furthermore, liver CAT activities increased while hepatic MDA contents decreased with increasing dietary PA levels, suggesting that optimal PA level could al-leviate the cellular and/or molecular damages caused by oxidative stress [48,49]. The exact mechanisms underlying this progress are still unknown, since limited information is available concerning the correlations between dietary PA levels and the anti-oxidative status of fish. However, it might be related to the lipid dysmetabolism of fish. In this study, dietary PA defi-ciency results in both high liver lipid content and FUFA of juvenile blunt snout bream. And previous studies indicated that excess PUFA in liver are more likely to cause lipid peroxidation of blunt snout bream [50,51]. In addition, the protective effects of CoA might not be neglected
Fig 5. Relative expressions of fatty acid synthesis-related genes.(A) Relative ACCαgene expression affected by dietary PA levels. (B) Relative FAS gene expression affected by dietary PA levels. (C) Relative SREBP1gene expression affected by dietary PA levels. (D) Relative LXRαgene expression
affected by dietary PA levels.
since it not only prevents cell damage from lipid peroxidation, but also promotes cellular repair mechanisms through the potentiating synthesis of membrane phospholipids [16].
In the present study, hepatic CoA contents increased markedly as dietary PA levels in-creased from 3.39 to 19.28 mg kg-1. This might be ascribed to the enhanced expression of the pantothenate kinase gene (coaA). This was supported by the fact that coaA is a very important determinant of the CoA biosynthetic rate, since pantothenate kinase catalyzes the rate-controlling step in CoA biosynthesis [52]. In addition, compared to those fed control diet, fish fed PA-supplemented diets obtained relative high liver CoA content but a stable level of coaA expression in this study. This result was out of expectations since CoA biosynthesis is governed by the feedback inhibition of pantothenate kinase, which is further mediated by the concentra-tion of intracellular nonesterified CoA [4,52,53]. This suggested that the regulation of coaA ex-pression in blunt snout bream showed no direct relationship with the feedback inhibition of pantothenate kinase activities by CoA. Furthermore, in this study, the whole-body and liver lipid contents of juvenile blunt snout bream both decreased with increasing dietary PA supple-mentation, in line with the results observed in Jian carp, grouper and grass shrimp [3,11,54]. According to previous studies, the high body lipid content of fish fed the control diet might be ascribed to the low liver CoA content, as hepatic CoA concentration is generally positively cor-related with body lipid transport [50,51]. In fact, fatty acids must first be activated by CoA be-fore they can be synthesized into triglycerides [3]. Therefore, a low liver CoA content may inhibit the synthesis of triglycerides, as might consequently block lipid transport [51]. In addi-tion, previous studies have found that both DHA and EPA can attenuate the synthesis and se-cretion of triglycerides in mammals [55]. In a recent study, triglycerides secretion was found to be inhibited by elevated percentages of DHA and EPA in the liver of blunt snout bream [51]. Therefore, the increased liver PUFA content of the fish fed the control diet in this study may be another cause of high body lipid accumulation.
In the present study, hepatic palmitic acid content and the SFA content both increased sig-nificantly as dietary PA levels increased from 3.39 to 19.28 mg kg-1, suggesting an enhanced synthesis of hepatic long-chain SFA by dietary PA supplementation. This is supported by the fact that palmitic acid (C16:0) is the major product of liver de novo fatty acid synthesis [20]. This increased palmitic acid content might be partially ascribed to the up-regulation of ACCα
In summary, juvenile blunt snout bream requires exogenous PA to maintain normal growth and physiological functions. Based on the regression analyses between dietary PA levels and weight gain, liver CoA and PA contents, the optimal dietary PA requirements of this species were estimated to be 24.08 mg kg-1. In addition, PA deficiency caused oxidative stress and in-testinal hypofunction which could be remitted by dietary PA supplementation. Furthermore, the expressions of various genes (including coaA, ACCα, LXRαand SREBP1) involved in liver fatty acid synthesis increased with increasing dietary PA levels, resulting in the enhanced liver SFA synthesis and increased muscle PUFA percentage.
Supporting Information
S1 Checklist. The ARRIVE Guidelines Checklist-Animal Research: Reporting In Vivo Ex-periments.
(PDF)
S1 Dataset. Segment sequences ofcoaA, ACCα, FAS, SREBP1and LXRαgenes. (XLSX)
S1 Editorial Certificate. The editorial certificate of the manuscript. (PDF)
Acknowledgments
This research was supported by Special Fund for Agro-scientific Research in the Public Interest of Ministry (201003020), and by the funds of the National Technology System for Convention-al Freshwater Fish Industries of China (CARS-46–20).
Author Contributions
Conceived and designed the experiments: YQ FL W-BL. Performed the experiments: YQ X-FL D-SC H-YT. Analyzed the data: YQ D-DZ. Contributed reagents/materials/analysis tools: YQ D-SC H-YT. Wrote the paper: YQ X-FL. Fish diets preparation: YQ D-SC. Fish feeding trial: YQ. Samples collection: YQ SC H-YT. Biochemical parameters determination: YQ D-SC. PCR primers design: YQ D-DZ. RT-PCR performance: YQ D-SC H-YT. Analysis software operating: YQ.
References
1. National Research Council (NRC) Nutrient Requirement of Fish and Shrimp. National Academic Press, Washington, DC. 376 pp; 2011.
2. Ogino C. B vitamin requirements of carp-II. Requirements for riboflavin and pantothenic acid. Bulletin of Japanese Society of Scientific Fisheries. 1967; 33: 351–354.
3. Lin YH, Lin HY, Shiau SY. Estimation of dietary pantothenic acid requirement of grouper,Epinephelus malabaricusaccording to physiological and biochemical parameters. Aquaculture. 2012;324–325: 92–96.
4. Song WJ, Jackowski S. Cloning, Sequencing and Expression of the pantothenate Kinase (coaA) Gene ofEscherichia coli. Journal of Bacteriology. 1992; 174: 6411–6417. PMID:1328157
5. Roem AJ, Stickney RP, Kohler CC. Dietary pantothenic acid requirement of the blue tilapia. Progres-sive Fish-Culturist. 1991; 53: 216–219.
6. Soliman AK, Wilson RP. Water-soluble vitamin requirements of tilapia. I. Pantothenic acid requirement of blue tilapia,Oreochromis aureus. Aquaculture. 1992; 104: 121–126.
7. Murai T, Andrews JW. Pantothenic acid requirement of channel catfish fingerlings. Journal of Nutrition. 1979; 109: 1140–1142. PMID:448458
9. Karges RG, Woodward B. Development of lamellar epithelial hyperplasia in gills of pantothenic acid-de-ficient rainbow trout, Salmo gairdneri Richardson. Journal of Fish Biology. 1984; 25: 57–62.
10. Cho CY, Woodward B. Dietary pantothenic acid requirements of young rainbow trout (Oncorhynchus mykiss). The FASEB Journal. 1990; 4: 3747.
11. Wen ZP, Zhou XQ, Feng L, Jiang J, Liu Y. Effect of dietary pantothenic acid supplement on growth, body composition and intestinal enzyme activities of juvenile Jian carp (Cyprinus carpiovar. Jian). Aquaculture Nutrition. 2009; 15: 470–476.
12. Shimeno S. Yellowtail, Seriola quinqueradiata. In: Wilson R.P. (Ed.), Handbook of Nutrient Require-ments of Finfish. CRC Press, Boca Raton, FL., pp. 181–191; 1991.
13. Lazo JP, Davis DA, Arnold CR. The effects of dietary protein level on growth, feed efficiency and surviv-al of juvenile Florida pompano (Trachinotus carolinus). Aquaculture. 1998; 169: 225–232.
14. Furne M, Hidalgo MC, Lopez A, Garcia-Gallego M, Morales AE, Domezain A, et al. Digestive enzyme activities in Adriatic sturgeon Acipenser naccarii and rainbow troutOncorhynchus mykiss. A compara-tive study. Aquaculture. 2005; 250: 391–398.
15. Feng L, Peng Y, Wu P, Hu K, Jiang WD, Liu Y, et al. Threonine Affects Intestinal Function, Protein Syn-thesis and Gene Expression of TOR in Jian Carp (Cyprinus carpio var. Jian) PloS one. 2013; 8: e69974. doi:10.1371/journal.pone.0069974PMID:23922879
16. Slyshenkov VS, Rakowska M, Moiseenok AG, Wojtczak L. Pantothenic acid and its derivatives protect Ehrlich ascites tumor cells against lipid peroxidation. Free Radical Biology and Medicine. 1995; 19: 767–772. PMID:8582649
17. Sheikhzadeh N, Tayefi-Nasrabadi H, Oushani AK, Enferadi MHN. Effects of Haematococcus pluvialis supplementation on antioxidant system and metabolism in rainbow trout (Oncorhynchus mykiss). Fish Physiology Biochemistry. 2012; 38: 413–419. doi:10.1007/s10695-011-9519-7PMID:21695482
18. Magnuson K, Jackowski S, Rock CO, Cronan JE. Regulation of fatty acid biosynthesis inEscherichia coli. Microbiology and Molecular Biology Reviews. 1993; 57: 522–542. PMID:8246839
19. Cheng HL, Ji NJ, Peng YX, Shen X, Xu JH, Dong ZG, et al. Molecular characterization and tissue-spe-cific expression of the acetyl-CoA carboxylaseαgene from Grass carp, Ctenopharyngodon idella. Gene. 2011; 487: 46–51. doi:10.1016/j.gene.2011.07.027PMID:21839155
20. Hsu RY, Wasson G, Porter JW. The purification and properties of the fatty acid synthetase of pigeon liver. Journal of Biological Chemistry. 1965; 240: 3736–3746. PMID:4378857
21. Clarke SD. Regulation of fatty acid synthase gene expression: An approach for reducing fat accumula-tion. Journal of Animal Science. 1993; 71: 1957–1965. PMID:8349524
22. Horton JD, Goldstein JL, Brown MS. SREBPs: activators of the complete program of cholesterol and fatty acid synthesis in the liver. Journal of Clinical Investigation. 2002; 109: 1125–1131. PMID:11994399
23. Li XF, Liu WB, Jiang YY, Zhu H, Ge XP. Effects of dietary protein and lipid levels in practical diets on growth performance and body composition of blunt snout bream (Megalobrama amblycephala) finger-lings. Aquaculture. 2010; 303: 65–70.
24. Woollard DC, Indyk HE, Christiansen SK. The analysis of pantothenic acid in milk and infant formulas by HPLC. Food Chemistry. 2000; 69: 201–208.
25. Li XF, Jiang YY, Liu WB, Ge XP. Protein-sparing effect of dietary lipid in practical diets for blunt snout bream (Megalobrama amblycephala) fingerlings: effects on digestive and metabolic responses. Fish Physiology and Biochemistry. 2012; 38: 529–541. doi:10.1007/s10695-011-9533-9PMID:21698471
26. Jiang GZ, Wang M, Liu WB, Li GF, Qian Y. Dietary choline requirement of juvenile blunt snout bream,
Megalobrama amblycephala. Aquaculture Nutrition. 2013; 19: 499–505.
27. A.O.A.C. Official Methods of Analysis of Official Analytical Chemists International, 16th edn. Associa-tion of Official Analytical Chemists, Arlington, VA; 1995.
28. Lowry OH, Rosebrough NJ, Farr AL. Protein measurement with the Folin-phenol reagent. Journal of Bi-ological Chemistry. 1951; 193:265–275. PMID:14907713
29. Moro GV, Camilo RY, Fracalossi DM. Dietary non-protein energy sources: growth, digestive enzyme activities and nutrient utilization by the catfish jundia, Rhamdia quelen. Aquaculture Research. 2010; 41: 394–400. 30. Hummel BCW. A modified spectrophotometric determination of chymotrypsin, trypsin, and thrombin.
Canadian Journal of Biochemistry Physiology. 1959; 37: 1393–1399. PMID:14405350
31. McCormick SD. Method, for nonlethal gill biopsy and measurement of Na+, K+-ATPase activity.
Canadi-an Journal of Fisheries Canadi-and Aquatic Sciences. 1993; 50: 656–658.
32. Bessey OA, Lowry OH, Brock MJ. A method for the rapid determination of alkaline phosphatase with five cubic millimeters of serum. Journal of Biological Chemistry. 1946; 164: 321–329. PMID:20989492
34. Lygren B, Hamre K, WaagbøR. Effects of dietary pro- and antioxidants on some protective mecha-nisms and health parameters in Atlantic salmon. Journal of Aquatic Animal Health. 1999; 11: 211–221. 35. Satho K. Serum lipid peroxidation in cerebrovascular disorders determined by a new colorimetric
meth-od. Clinica Chimica Acta. 1978; 190: 37–43.
36. Folch J, Lees M, Solane Stanley GH. A simple method for the isolation and purification of total lipids from animal tissues. Journal of Biological Chemistry. 1957; 226: 497–509. PMID:13428781
37. Livak KJ, Schmittgen TD. Analysis of relative gene expression data using realtime quantitative PCR and the 2−ΔΔCT method. Methods. 2001; 25: 402–408. PMID:11846609
38. Zar JH. Biostatistical Analysis. Prentice-Hall Inc., Englewood Cliffs, NJ. pp. 236–243; 1984. 39. Robbins KR, Norton HW, Baker DH. Estimation of nutrient requirements from growth data. Journal of
Nutrition. 1979; 109: 1710–1714. PMID:490209
40. Reibel DK, Wyse BW, Berkich DA, Neely JR. Coenzyme A metabolism in pantothenic acid-deficient rats. Journal of Nutrition. 1982; 112: 1149–1150.
41. Mommsen TP. Paradigms of growth in fish. Comparative Biochemistry and Physiology, Part B. 2001; 129: 207–219. PMID:11399452
42. Hakim Y, Uni Z, Hulata G. Relationship between intestinal brush border enzymatic activity and growth rate in tilapias fed diets containing 30% or 48% protein. Aquaculture. 2006; 257: 420–428.
43. Zhao S, Feng L, Liu Y, Kuang SY, Tang L, Jiang J, et al. Effects of dietary biotin supplement on growth, body composition, intestinal enzyme activities and microbiota of juvenilw Jian carp (Cyprinus carpio
var. Jian). Aquaculture Nutrition. 2011; 18: 400–410.
44. Nelson RA. Intestinal transport, coenzyme A, and colitis in pantothenic acid deficiency. The American Journal of Clinical Nutrition. 1968; 21: 495–501. PMID:5649470
45. Seronde J. The pathogenesis of duodenal ulcer disease in the pantothenate deficient rat. The Yale Journal of Biology and Medicine. 1963; 36: 141. PMID:14067371
46. Swank R, Adams RD. Pyridoxine and pantothenic acid deficiency in swine. Journal of Neuropathology and Experimental Neurology. 1948; 7: 274–286. PMID:18872391
47. Krebs HA. Rate control of the tricarboxylic acid cycle. Advances in enzyme regulation. 1970; 8: 335–353. PMID:4920378
48. Winston GW, Di Giulio RT. Prooxidant and antioxidant mechanisms in aquatic organisms. Aquatic Toxi-cology. 1991; 19: 137–161.
49. Parvez S, Raisuddin S. Protein carbonyls: novel biomarkers of exposure to oxidative stress-inducing pesticides in freshwater fish Channa punctata (Bloch). Environmental Toxicology and Pharmacology. 2005; 1: 112–117. doi:10.1016/j.etap.2004.11.002PMID:21783577
50. Lu KL, Xu WN, Wang LN, Zhang DD, Zhang CN, Liu WB. Hepaticβ-oxidation and regulation of carnitine palmitoyltransferase I in blunt snout bream Megalobrama amblycephala fed a high-fat diet. PloS one. 2014; 9: e93135. doi:10.1371/journal.pone.0093135PMID:24676148
51. Lu KL, Xu WN, Li XF, Liu WB, Wang LN, Zhang CN. Hepatic triacylglycerol secretion, lipid transport and tissue lipid uptake in blunt snout bream (Megalobrama amblycephala) fed high-fat diet. Aquacul-ture. 2013; 408: 160–168.
52. Vallari DS, Jackowski S, Rock CO. Regulation of pantothenate kinase by coenzyme A and Regulation of pantothenate kinase by coenzyme A and its thioesters. Journal of Biological Chemistry. 1987; 262: 2468–2471. PMID:3029083
53. Vallari DS, Jackowski S. Biosynthesis and degradation both contribute to the regulation of coenzyme A content in Escherichia coli. Journal of Bacteriology. 1988; 170: 3961–3966. PMID:2842294
54. Shiau SY, Hsu CW. Dietary pantothenic acid requirement of juvenile grass shrimp, Penaeus monodon. The Journal of nutrition. 1990; 129: 718–721.
55. Kjær MA, Vegusdal A, Gjoen T, Rustan AC, Todorcevic M, Ruyter B. Effect of rapeseed oil and dietary n−3 fatty acids on triacylglycerol synthesis and secretion in Atlantic salmon hepatocytes. Biochimica et
Biophysica Acta. 2008; 1781: 112–122. doi:10.1016/j.bbalip.2007.12.004PMID:18222184
56. Wakil SJ. Mechanism of fatty acid synthesis. Journal of Lipid Research. 1961; 2: 1–24.
57. Heath RJ, Rock CO. Regulation of fatty acid elongation and initiation by acyl-acyl carrier protein in Escherichia coli. Journal of Biological Chemistry. 1996; 271: 1833–1836. PMID:8567624
58. Xu J, Nakamura MT, Cho HP, Clarke SD. Sterol regulatory element binding protein-1 expression is sup-pressed by dietary polyunsaturated fatty acids. Journal of Biological Chemistry. 1996; 274: 23577–23583. 59. Birge C. Acyl carrier protein X V II. Purification and properties ofβ-hydroxydecanoyl-ACP dehydrase.