http://dx.doi.org/10.1590/1516-635x1701103-108
Chickens from Seven to Twelve Weeks of Age
Author(s)
Liu SKI
Niu ZYI
Min YNI
Wang ZPI
Zhang JI
He ZFI
Li HLI
Sun TTI
Liu FZI
I College of Animal Science & Technology,
Northwest A&F University, Yangling, Shaanxi, 712100, China
Mail Address
Corresponding author e-mail address Prof. F.Z. Liu, College of Animal Science and
Technology, Northwest A &F University, Yangling, Shaanxi, 712100 China E-mail: [email protected]
Keywords
Crude protein; Growth performance; Indigenous fowl; Lueyang black-boned chicken.
Submitted: March/2014 Approved: November/2014
ABSTRACT
This study was undertaken to assess dietary crude protein (CP) concentration for optimum growth performance and carcass characteristics of Lueyang black-boned chicken. In total, six hundred 42-day-old Lueyang black-boned chicks were randomly assigned to five treatments, each with six replicate pens with ten males and ten females. The birds fed experimental diets with different levels of protein concentration of 120, 140, 160, 180 and 200 g kg-1 from seven to twelve
weeks of age respectively. On day of 84, weight gain, feed intake, and feed:gain ratio were measured, and two chickens (one male and one female) close to the average weight of all birds in each treatment were selected from each pen and sacrificed to evaluate carcass traits and selected serum biochemical indexes. Dietary CP concentration did not have any significant influence on feed intake (p>0.05). The birds fed the diet with 180 or 160 g kg-1 CP concentration exhibited greater (p<0.05)
growth rate, better feed conversion ratio, relative breast weight and albumin concentration in serum than that of those fed other dietary CP concentrations. According to the results of regression analysis, the CP requirements of Lueyang black-boned chicken from seven to twelve weeks of age for optimal weight gain and feed:gain ratio were 174 and 170 g kg-1, respectively.
INTRODUCTION
Black-boned chicken, called “Wuguji’’ in Chinese, is a kind of unique in indigenous fowl breeds in China. They can be easily distinguished from other chickens. The meat products of the original black-boned chicken are well known in the East and for thousands of years have been credited with famous medicinal and health-promoting effects. So far, more than ten such indigenous breeds have been discovered and characterized in different ecological regions of China. The origin of Lueyang black-boned chickens is the Shaanxi province of China. This breed is characterized by black-colored comb, beak, tongue, legs, toes, and skin. To their higher income and focused on healthy foods, more and more people have accepted and enjoyed this bird’s meat in China. So, such preference of consumers has strongly promoted the production of Chinese black-boned chickens. Because it is an indigenous fowl breed, research on the Lueyang black-boned chicken is very limited. Our previous work mainly focused on the genetic characteristics of this breed, including reproductive performance, meat production, etc. (Liu
Protein is one of the most important dietary macronutrients for animals, and as the key component of cells, plays an important role in the process of life. Growth rate and feed efficiency of broilers improves with the increase in dietary protein, and there is a wealth of information about the effects of CP on the performance and body composition of chickens (Jackson et al., 1982; MacLeod, 1990; Buyse et al., 1992; Collin et al., 2003; Swennen et al., 2005; Niu
et al., 2009; Min et al., 2012). Next to exogenous factors such as environmental conditions, particularly nutrition, genetic factors strongly influence the performance and body composition of chickens (Malone et al., 1979; Jackson et al., 1982; Barbato
et al., 1992; Hulan et al., 1980). Relationships between genotype and dietary protein levels were also reported (Leclercq, 1983; Marks & Pesti, 1984; Cahaner et al., 1987 and Smith & Pesti, 1998). Therefore, previous research has mainly focused on modern broiler chickens, but these results may be not true for indigenous fowl breeds, such as the Lueyang black-bone chicken because of significant differences in their physiology and genetics.
In the present study, the effect of different con-centrations of dietary CP on the growth performance, carcass traits and selected blood biochemical indexes were evaluated in Lueyang black-boned chickens from seven to twelve weeks of age in order to determine their optimal protein requirement.
MATERIALS AND METHODS
Experimental design and birds
This experiment was conducted according to the regulations for the administration of affairs concerning experimental animals approved by State Scientific and Technological Commission (1988). Six hundred 42-day-old birds were selected and randomly allotted to thirty pens with ten male and ten female birds each. Experimental diets were based on corn and soybean meal (Table 1), five dietary treatments were formulated to contain equal metabolizable energy (ME) levels (12.34 MJ kg-1), but protein levels of 120, 140, 160,
180, and 200 g kg-1.
During experimental period, water and feed were provided ad libitum. The temperature was kept at 18-21ºC. The lighting program was gradually reduced from 16-18h to natural illumination (half an hour per week) during experimental period. At 42 d of age, birds were weighed. All of birds were reared under the similar conditions.
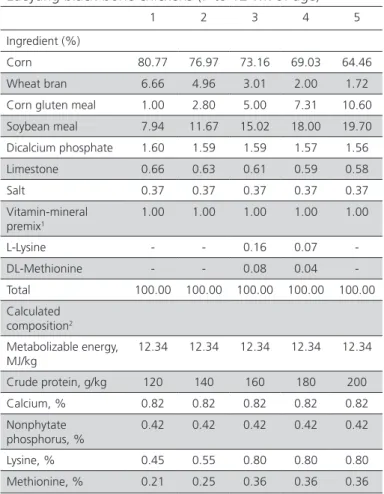
Table 1 – Composition of experimental diets fed to Lueyang black-bone chickens (7 to 12 wk of age)
1 2 3 4 5 Ingredient (%)
Corn 80.77 76.97 73.16 69.03 64.46 Wheat bran 6.66 4.96 3.01 2.00 1.72 Corn gluten meal 1.00 2.80 5.00 7.31 10.60 Soybean meal 7.94 11.67 15.02 18.00 19.70 Dicalcium phosphate 1.60 1.59 1.59 1.57 1.56 Limestone 0.66 0.63 0.61 0.59 0.58 Salt 0.37 0.37 0.37 0.37 0.37 Vitamin-mineral
premix1
1.00 1.00 1.00 1.00 1.00
L-Lysine - - 0.16 0.07 -DL-Methionine - - 0.08 0.04 -Total 100.00 100.00 100.00 100.00 100.00 Calculated
composition2
Metabolizable energy, MJ/kg
12.34 12.34 12.34 12.34 12.34
Crude protein, g/kg 120 140 160 180 200 Calcium, % 0.82 0.82 0.82 0.82 0.82 Nonphytate
phosphorus, %
0.42 0.42 0.42 0.42 0.42
Lysine, % 0.45 0.55 0.80 0.80 0.80 Methionine, % 0.21 0.25 0.36 0.36 0.36
1 Supplied the following per kilogram of total diet: vitamin A (retinyl acetate), 10,000
IU; vitamin D3 (cholecalciferol), 3,000 IU; vitamin E (DL-α-tocopheryl acetate), 20 IU; vitamin K3 (menadione sodium bisulfate), 6 mg; thiamin, 6 mg; riboflavin, 12.85 mg;
pyridoxine hydrochloride, 6 mg; cobalamin, 5 mg; folic acid, 6 mg; calcium-D-panto-thenate, 12 mg; nicotinic acid, 40 mg; biotin, 5 mg; Cu (CuSO4·5H2O), 7.68mg; Fe (FeSO4·7H2O), 74 mg; Zn (ZnO), 76mg; Mn (MnSO4·H2O), 80 mg; Se (NaSeO3), 0.0685 mg; I (KI), 0.2 mg; Ethoxycarbonyl quinoline, 2.8 mg; Limestone, 4.5g.
2 The values are calculated according to feed composition and nutritive values in China
(Ministry of Agriculture of China, 2011).
Measurements and sampling
Birds were weighed by pen at the beginning (42 d) and end (84 d) of the experiment after fasting for 12h (with free access to water). Feed intake per pen was recorded weekly. Body weight gain was measured at 84 d of age. Feed:gain ratio per pen was calculated for the overall experimental period.
After feed deprivation for 12h at 84 d of age, two chickens (one male and one female ) close to the average weight of all birds in each treatment were selected from each pen, slaughtered, and the right
Serum biochemical indicatorswere determined with an automatic biochemical analyzer (HATICHI 7180, Japan) by using commercial kits: Total protein (TP) and albumin (ALB) concentrations were measured using TP kit and Alb kit (Biosino Bio-technology and Science INC, China). Blood urea nitrogen (BUN) and uric acid (UA) concentrations were determined using Urea kit and Uric acid kit (Shanghai Kehua Bio-engineering CO., LTD., China). Serum concentrations of triiodothyronine (T3), thyroxine (T4), and insulin (INS) were measured using an RIA kit (Beijing North Immunological Institute, China) and a gamma-counter (Packard 8500, USA).
Statistical analysis
All data were analyzed by one-way analysis of variance (SAS Version 9.1.3, 2004). When dietary treatment was significant (p<0.05), the test of Duncan for multiple comparisons was used to test the significance of the differences between treatment means (SAS Version 9.1.3, 2004). Linear regression analysis was applied to estimate the protein requirement of growing Lueyang black-bone chicken using the NLIN procedure of SAS software, according to the following quadratic model:
y = ax2 + bx + c
where y=growth rate or feed:gain ratio; a and b are the coefficients of the quadratic equation; c is intercept; x is dietary protein level (g/kg) and -b/2a is x value for optimal response.
RESULTS
Growth performance and carcass traits
Body weight results obtained at 42 d and 84 of age are shown in Table 2. There was no significant difference in initial body weight (42 d) among treatments (p>0.05). Data on feed intake, weight
gain, feed:gain ratio, and relative carcass part weights collected at 84 d of age are summarized in Table 3 and Table 4. It was clear that dietary CP did not have any significant influence on feed intake (p>0.05). The body weight of chickens fed the diet with 180 g kg-1 CP was
significantly higher (p<0.05) than those of chickens fed the 120, 140, and 200 g kg-1 CP diets, but was not
different from those fed the 160 g kg-1 CP diet.
Table 3 – Effect of dietary CP on weight gain, feed intake, and feed:gain of Lueyang black-boned chickens from 42 to 84 d of age
Dietary CP (g/kg)
Daily weight gain (g/bird per day)
Daily feed intake (g/bird per day)
Feed:gain (g:g) 120 15.24c 65.82 4.32a
140 17.31b 67.90 3.92b
160 17.58b 65.52 3.73c
180 18.84a 69.38 3.68c
200 17.40b 68.38 3.94b
SEM 0.48 10.76 0.02
a–c Means with different superscripts within the same column differ significantly
(p<0.05).
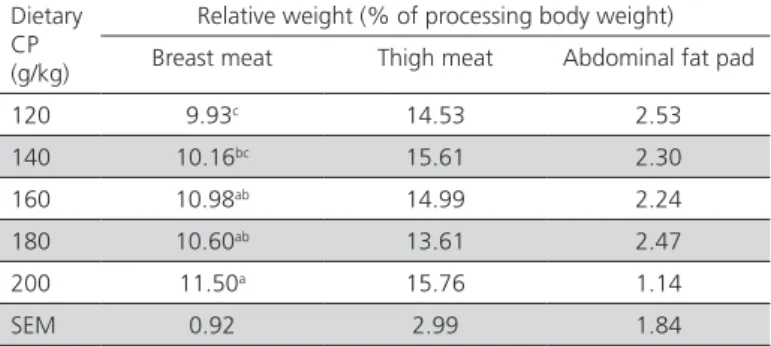
The lower body weights of the low CP-fed (120 and 140 g kg-1 CP) chickens were also associated with
significantly lower (p<0.05) relative breast muscle weight; however, relative breast muscle weights were not different between chickens fed the diets with 160 g kg-1, 180 g kg-1, and 200 g kg-1 CP. Dietary CP level
did not influence thigh and abdominal fat pad weights (p>0.05).
Table 4 – Effect of dietary CP on breast meat, thigh meat, and abdominal fat pad of 84-d-old Lueyang black-boned chickens
Dietary CP (g/kg)
Relative weight (% of processing body weight) Breast meat Thigh meat Abdominal fat pad
120 9.93c 14.53 2.53
140 10.16bc 15.61 2.30
160 10.98ab 14.99 2.24
180 10.60ab 13.61 2.47
200 11.50a 15.76 1.14
SEM 0.92 2.99 1.84
a–c Means with different superscripts within the same column differ significantly
(p<0.05).
The effect of CP level on the growth rate was significant (p<0.05). As with the body weight, the growth rate was significantly higher in the birds fed the diet with 180 g kg-1 CP compared with the other
four diets. Over the entire experimental period, the effect of dietary protein level on feed:gain ratio was significant (p<0.05). The efficiency of feed utilization
Table 2 – Body weight of Lueyang black-boned chickens at 42 and 84 d of age
Dietary CP (g/kg)
Body weight 42d (kg/pen)
Body weight 84d (kg/pen)
120 7.10 19.46d
140 7.14 21.43bc
160 7.08 21.85ab
180 7.10 22.66a
200 7.12 20.89c
SEM 0.01 0.57
a–d Means with different superscripts within the same column differ significantly
was higher (p<0.05) in chickens fed the diet having 180 g kg-1 CP, but there was no difference between
this group and those fed with 20 g kg-1 less protein.
Moreover, regression analysis showed a highly significant (p<0.0001) correlation (R2 = 0.6930)
between growth rate (y) and protein level (x), as described by the following equation:
y = -0.00108x2 + 0.37494x - 14.19616
The regression analysis of feed:gain ratio against protein level showed a highly significant relationship, and the following prediction equation:
y = 0.00025989x2 - 0.08821x + 11.16961
(p<0.0001; R2 =0.7075).
Serum biochemical parameters
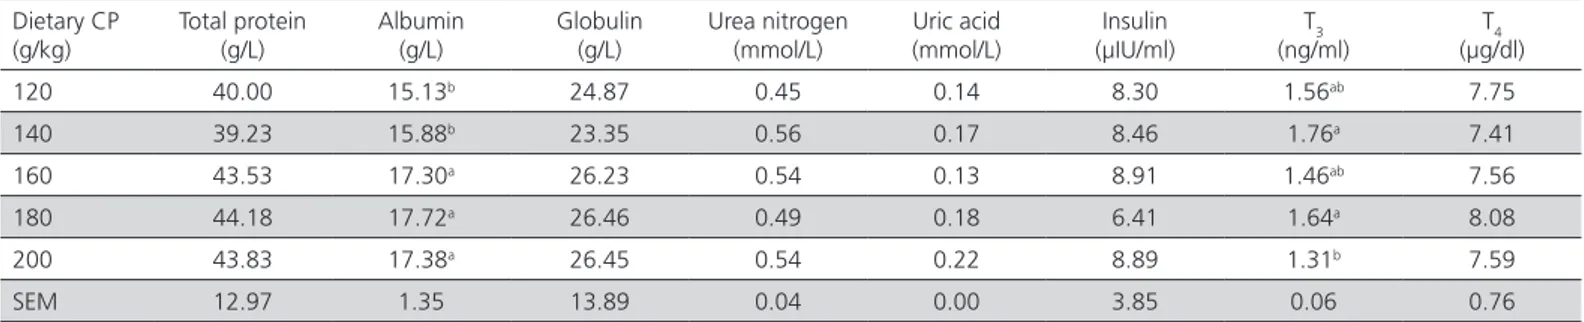
Table 5 presents data on the obtained serum concentration of TP, ALB, globulin (GLO), BUN, UA, INS, T3 and T4. The concentrations of TP, GLO, BUN and UA were not affected by the treatments. However, TP and UA levels tended to reduce (though not significantly) when chickens were fed low CP diets. Conversely, increasing dietary CP level from 120 g kg-1 to 180 g
kg-1 significantly (p<0.05) enhanced ALB concentration
from 15.13 g L-1 to 17.72 g L-1, but decreased to
17.38 g L-1 when dietary CP level was 200 g kg-1. The
concentration of T3 was significantly (p<0.05) affected by dietary CP level. The concentrations of INS and T4 were not affected by the treatments.
DISCUSSION
Several studies with poultry have investigated the effect of different dietary protein concentration in the diet on feed intake. The results of the present study suggest that feed intake may not be affected by increased dietary protein levels, and it corroborates with the findings of Rosebrough & Steele (1985), Fancher &
Jensen (1989) & Bregendahl et al. (2002), who reported that chickens fed iso-energy diets with different protein concentrations had a similar feed intake. However, Smith & Pesti (1998) showed that feed intake of 18- to 53-day-old broiler chickens increased when dietary protein concentration decreased from 24 to 16% (at a constant energy level). Similar results were also observed by Parsons & Baker (1982), Pesti & Fletcher (1984), Suthama et al. (1991), Noy & Sklan (2002), Sklan & Plavnik (2002) and Swennen et al. (2004).
The growth rate of the chickens increased as the level of protein increased from 120 g kg-1 to 180 g kg-1
of the diet. This is consistent with the results reported by many other investigators (Yeh and Leveille, 1969; Jackson et al., 1982; Buyse et al., 1992; Smith and Pesti, 1998; Collin et al., 2003; Swennen et al., 2004). It is most likely the consequence of their increased cumulative protein consumption (Suthama et al., 1991; Malheiros et al., 2003).
During the overall experimental period, a linear reduction in feed:gain ratio was observed as growth rate increased when the level of protein increased from 120 g kg-1 to 180 g kg-1 of the diet. However,
growth rate decreased when dietary protein level was increased to 200 g kg-1, consequently increasing
feed:gain ratio. This is likely due to the fact that the efficiency of dietary protein utilization decreased with each increment in dietary protein (Summers et al., 1964; Jackson et al., 1982; Swennen et al., 2004).
An isoenergetic diet with varying CP levels, increasing dietary protein had no effect on relative abdominal fat pad weight. This supports earlier research carried out by Nawaz et al. (2006). However, other studies showed that broilers fed a low protein diet significantly increased abdominal fat pad weight compared with chickens fed a normal protein diet (Collin et al., 2003; Swennen et al., 2004, 2006). These differences may
Table 5 – Effect of dietary CP on biochemical indicators and hormone concentrations in the serum of 84-d-old Lueyang
black-boned chickens1
Dietary CP (g/kg)
Total protein (g/L)
Albumin (g/L)
Globulin (g/L)
Urea nitrogen (mmol/L)
Uric acid (mmol/L)
Insulin (μIU/ml)
T3
(ng/ml)
T4
(μg/dl) 120 40.00 15.13b 24.87 0.45 0.14 8.30 1.56ab 7.75
140 39.23 15.88b 23.35 0.56 0.17 8.46 1.76a 7.41
160 43.53 17.30a 26.23 0.54 0.13 8.91 1.46ab 7.56
180 44.18 17.72a 26.46 0.49 0.18 6.41 1.64a 8.08
200 43.83 17.38a 26.45 0.54 0.22 8.89 1.31b 7.59
SEM 12.97 1.35 13.89 0.04 0.00 3.85 0.06 0.76
a, b Means with different superscripts within the same column differ significantly (p<0.05).
be due to by genotype or genotype × diet interactions (Leenstra, 1989; Marks, 1990).
Serum UA and TP concentrations tended to decrease (though not significantly) when chickens were fed the low protein diet. The level of ALB in the serum significantly decreased as dietary protein concentration was reduced. These results might be related with a deficit of amino acids intake by the animals (Corzo et al., 2009). In other cases, broiler chickens reared on a low CP diet had significantly higher T3 concentration and lower T4 concentration compared with chickens fed a high CP diet (Keagy et al., 1987; Rosebrough
et al., 1999; Malheiros et al., 2003; Swennen et al., 2005, 2006). In the present study, T3 concentration was significantly affected by dietary CP level; however, T3 concentration did not linearly increase with the increase in dietary CP level. Serum T4 concentration was not affected by the treatments.
In conclusion, a diet with 180 or 160 g kg-1 CP
concentration may improve growth rate and feed conversion ratio of growing Lueyang black-bone chickens, as well as increase their relative breast weight and serum albumin concentration. The regression analysis showed the CP requirements of Lueyang black-bone chickens from 42 to 84 of age for optimal weight gain and feed:gain ratio were 174 and 170 g kg-1, respectively, when dietary metabolizable energy
was 12.34 MJ kg-1.
ACKNOWLEDGEMENTS
Financial support provided by the Research Fund of Northwest A &F University (Project No.: Z109021127) is gratefully acknowledged.
REFERENCES
Barbato GF. Genetic architecture of carcass composition in chickens. Poultry Science 1992;71;789-798.
Bregendahl K, Sell JL, Zimmerman DR. Effect of low-protein diets on growth performance and body composition of broiler chicks. Poultry Science 2002;81:1156-1167.
Buyse J, Decuypere E, Berghman L, Kuhn ER, Vandesande F. Effect of dietary protein content on episodic growth hormone secretion and on heat production of male broiler chickens. British Poultry Science 1992;33:1101-1109.
Cahaner A, Dunnington EA, Jones DE, Cherry JA, Siegel PB. Evaluation of two commercial broiler male lines differing in efficiency of feed utilization. Poultry Science 1987;66:1101-1110.
Collin A, Malheiros RD, Moraes VMB, Van As P, Darras VM, Taouis M, Decuypere E, Buyse J. Effects of dietary macronutrient content on energy metabolism and uncoupling protein mRNA expression in broiler chickens. British Journal Nutrition 2003;90:261-270.
Corzo A, Loar RE, Kidd MT. Limitations of dietary isoleucine and valine in broiler chick diets1. Poultry Science 2009;88:1934-1938.
Fancher BI, Jensen LS. Dietary protein level and essential amino acid content: Influence upon female broiler performance during the grower period. Poultry Science 1989;68:897-908.
Hulan HW, Proudfoot FG, Ramey D, McRae KB. Influence of genotype and diet on general performance and incidence of leg abnormalities of commercial broilers reared to roaster weight. Poultry Science 1980;59:748-757.
Jackson S, Summers JD, Leeson S. Effect of dietary protein and energy on broiler carcass composition and efficiency of nutrient utilization. Poultry Science 1982;61:2224-2231.
Keagy EM, Carew LB, Alster FA, Tyzbir RS. Thyroid function, energy balance, body composition and organ growth in protein-deficient chicks. Journal Nutrition 1987; 117:1532.
Leclercq B. The influence of dietary protein content on the performance of genetically lean or fat growing chickens. British Poultry Science1983;24:581-587.
Leenstra FR. Influence of diet and genotype on carcass quality in poultry, and their consequences for selection. Recent developments in poultry nutrition. London: Butterworths; 1989. p.131-144.
Liu FZ, Huang YK, Niu ZY, Quan SA. A comparison of carcass fat variables when Lueyang fowl and broilers achieved a common physiological body weight. Journal of Northwest Atlantic Fishery 2001;29:15-18.
Liu FZ, Liu JX, Wei ZY. Studies on meat performance and carcass quality in Lueyang chickens and their crosses. Journal of Northwest Atlantic Fishery 1990;18:66-70.
Liu FZ, Niu ZY. Carcass characteristics of a common body weight in meat-type chickens and their heterotic effects. Journal Northwest Atlantic Fishery 1996;24:90-94.
Liu FZ, Wei ZY, Liu JX. Determination for egg laying and reproductive performance in Lueyang black-boned chicken. Journal of Agricultural Science 1992;2:23-24.
MacLeod MG. Energy and nitrogen intake, expenditure and retention at 20 in growing fowl given diets with a wide range of energy and protein contents. British Journal Nutrition 1990;64:625-637.
Malheiros RD, Moraes V, Collin A, Janssens GPJ, Decuypere E, Buyse J. Dietary macronutrients, endocrine functioning and intermediary metabolism in broiler chickens: Pair wise substitutions between protein, fat and carbohydrate. Nutrition Research 2003;23:567-578.
Malone GW, Chaloupka GW, Merkley JW, Littlefield LH. Evaluation of five commercial broiler crosses 1. Grow-out performance. Poultry Science 1979;58:509-515.
Marks HL. Genotype by diet interactions in body and abdominal fat weight in broilers. Poultry Science 1990;69:879-886.
Marks HL, Pesti GM. The roles of protein level and diet form in water consumption and abdominal fat pad deposition of broilers. Poultry Science 1984;63:1617-1625.
Min YN, Shi JS, Wei FX, Wang HY, Hou XF, Niu ZY, Liu FZ. Effects of dietary energy and protein on growth performance and carcass quality of broilers during finishing phase. Journal of Animal and Veterinary Advances 2012;11:3652-3657.
Niu ZY, Shi JS, Liu FZ, Wang XH, Gao CQ, Yao LK. Effects of dietary energy and protein on growth performance and carcass quality of broilers during starter phase. International Journal of Poultry Science 2009;8:508-511.
Noy Y, Sklan D. Nutrient use in chicks during the first week posthatch. Poultry Science 2002;81:391-399.
Parsons CM, Baker DH. Effect of dietary protein level and monensin on performance of chicks. Poultry Science1982;61:2083-2088.
Pesti GM, Fletcher DL. The response of male broiler chickens to diets with various protein contents during the grower and finisher phases. British Poultry Science 1984;25:415-423.
Rosebrough RW, McMurtry JP, Vasilatos-Younken. R Dietary fat and protein interactions in the broiler. Poultry Science 1999;78:992-998.
Rosebrough RW, Steele NC. Energy and protein relationships in the broiler. 1. Effect of protein levels and feeding regimens on growth, body composition, and in vitro lipogenesis of broiler chicks. Poultry Science 1985;64:119-126.
Sklan D, Plavnik I. Interactions between dietary crude protein and essential amino acid intake on performance in broilers. British Poultry Science 2002;43:442-449.
Smith ER, Pesti GM. Influence of broiler strain cross and dietary protein on the performance of broilers. Poultry Science 1998;77:276-281.
Summers JD, Slinger SJ, Sibbald IR, Pepper WF. Influence of protein and energy and growth and protein utilization in the growing chicken. Journal of Nutrition 1964;82:463-468.
Suthama N, Hayashi K, Toyomizu M, Tomita Y. Interactions of exogenous thyroxine and dietary protein levels on growth and muscle protein metabolism in broiler chickens. Japanese Poultry Science 1991;28:1-10.
Swennen Q, Janssens GP, Collin A, Bihan-Duval E Le, Verbeke K, Decuypere E, Buyse J. Diet-induced thermogenesis and glucose oxidation in broiler chickens: influence of genotype and diet composition. Poultry Science 2006;85:731-742.
Swennen Q, Janssens GP, Decuypere E, Buyse J. Effects of substitution between fat and protein on feed intake and its regulatory mechanisms in broiler chickens: energy and protein metabolism and diet-induced thermogenesis. Poultry Science 2004; 83:1997-2004.
Swennen Q, Janssens GP, Millet S, Vansant G, Decuypere E, Buyse J. Effects of substitution between fat and protein on feed intake and its regulatory mechanisms in broiler chickens: Endocrine functioning and intermediary metabolism. Poultry Science 2005;84:1051-1057.