N
Save Nature to Survive8(3): 777-781, 2013 www.thebioscan.in
EFFECT OF GENOTYPES AND NITROGEN LEVELS ON PRODUCTION
POTENTIAL OF MAIZE (
ZEA MAYS
L.) UNDER INDO-GANGATIC
PLAIN ZONE OF WESTERN U.P.
PRADEEP SINGH, N. S. RANA,
1U. N. SHUKLA, SMITA SINGH RAKESH KUMAR
2AND KAUSHAL KUMAR*
Department of Agronomy, S.V.P. U.A and T, Meerut - 250 110, INDIA
1
Department of Agronomy, S.V.P.U.A. and T., Meerut (U. P) - 250 110 INDIA
2
Department of Agronomy, Institute of Agricultural Sciences, BHU, Varanasi - 221 005
e-mail: [email protected]
INTRODUCTION
Maize, being a C4 plant, has yield potential far higher than any other cereals and that’s why sometimes referred to as the miracle crop or ‘Queen of Cereals’. Like other cereals, it has multiple uses. Over 35% of maize produced in the country is consumed as human food, 25% as poultry feed, 25% as cattle feed and 15% undergoes food processing (corn flakes, popcorns etc). The green cobs harvested at the milk stage are ground to make “chapattis” or local bread. It is also used to brew local liquor either solely or in combination with millet. “Sattu” or “champa” prepared by grinding maize to powder form alone or with wheat or barley is consumed along with tea (Narang and Gill, 2004). Nitrogen is a component of protein and nucleic acids and when nitrogen is sub-optimal, growth is reduced. Its availability in sufficient quantity throughout the growing season is essential for optimum maize growth. It is also characteristic constituent element of proteins and also an integral component of many other compounds essential for plant growth processes including chlorophyll and many enzymes. It also mediates the utilization of phosphorus, potassium and other elements in plants. An adequate supply of N is associated with dark green colour, high photosynthetic activity and vigorous growth. An excess of N can delay the crop maturity and the optimum use of maize crop when N supply is insufficient, carbohydrate will be deposited in vegetative cells, causes them to thicken (Rasheed et al., 2004). When N supply is adequate, the conditions are favorable for
ABSTRACT
Among genotypes, Dekalb 900 M Gold had significantly higher yield attributes viz. cobs/plant, cob length (cm), grains/row, grains/cob, 1000 grain weight, ten cobs weight, grain weight/ten cobs, shelling percentage, grain yield (6340 kg/ha), stover yield (8550 kg/ha), benefit: cost ratio (2.0), crop profitability (329.47 /ha/day)and crop productivity (62.35 kg/ha/day). Crop fertilized with 160 kg N/ha registered significantly higher yield attributes viz. cob length, cob girth, grain rows/cob, grains/row, grains/cob, 1000 grain weight, ten cobs weight, grain weight/ten cobs, shelling percentage, grain yield (6240 kg/ ha) and stover yield over 40 kg N/ha, but it was at par with 120 N kg/ha. However, the highest benefit: cost ratio (2.0), crop profitability (322.42/ha/day)and crop productivity (61.76 kg/ha/day) with the application of 120 kg N/ha closely followed by 160 kg N/ha. Harvest index, grain rows/cobs and cobs girth did not influenced by any of the genotypes and N levels.
KEYWORDS
Genotypes Maize Nitrogen levels Yield
Received on :
21.03.2012
Accepted on :
07.07.2012
*Corresponding author
growth, proteins are formed from manufactured carbohydrates ultimately higher crop yield (Sabha Jeet et al., 2012). An experiment was conducted with five N levels (0, 40, 80, 120 and 160 kg/ha) and found that the increased growth attributes with increasing N levels while highest plant diameter, LAI and DM production up to 160 kg/ha (Rasheed et al., 2004). Crop produced significantly maximum plant height, stem girth, number of leaves and dry weight/plant (87.42g) was recorded at 120 kg N + 20 kg P/ha while the lowest was recorded in the control by Onasanya et al. (2009). Khan et al., (2005) tested four N levels (0, 60, 120 and 180 kg/ha) and recorded maximum cobs/plant (1.5), 1000-grain weight (254.4g) and number of grains/cob (342.5) with 120kg N/ha. The increase of nitrogen consumption caused an increase in grain/cobs and 1000-seed weight was also reported by Sabha Jeet et al.
(2012) and Lack et al. (2008).
management including various monetary and non-monetary inputs. Among them fertilizer is one of the costliest and perhaps the most crucial input limiting cereal yields. Among the essential nutrient, response to nitrogen application is by and large obtained in Indian soils, low in nitrogen. Even under the best of prevailing situations in Indian soil, utilization efficiency of nitrogen ranges from 30-35 per cent, and has never exceeded 50 per cent (Prasad and Prasad, 1988). Nitrogen is most important in yield and quality formation in crops through manifestation of growth and development. Its role in photosynthesis, protein synthesis, cell division and other plant metabolic activities are well documented. Increase nitrogen supply in continuous manner to the crop results in greater cell size and leaf area and thus greater photosynthetic activity. Therefore, under such circumstances only two ways are there which can increase the productivity per unit area and quality, firstly by the adoption of hybrid varieties and secondly with improved agronomic practices (Kumar et al., 2002; Muhammad et al., 2004, Pal and Bhatnagar, 2009). It is also important to study the interaction of appropriate fertility levels with judicious selection of hybrids under Indo-gangatic plain zone. The present study was, for such motives, undertaken with the objective to find out and determine the effect of nitrogen application on growth and yield of maize hybrids.
MATERIALS AND METHODS
Experimental site and meteorological information
A field experiment was conducted at Crop Research Center, Sardar Vallabhbhai Patel University of Agriculture and Technology, Modipuram, Meerut (Uttar Pradesh) during 2008-09. Geographically, Meerut is located in semi-arid and sub-tropical region at 29º05’ 19’’ North latitude, 77º41’ 50’’ East longitude. The meteorological trends during crop period were depicted in Fig. 1. The soil of experimental plot was sandy-loamy textural class (42% sand, 38% silt and 20% clay) with low in organic carbon (0.46%), available N (190.4 kg/ha) and K2O (178.0 kg/ha), but medium in P2O5 (12.0 kg/ha). The pH and EC (ds/m) of soil was 7.4 and 0.351, respectively. Alkaline permanganate method (Subbiah and Asija, 1956), Olsen’s method (Watanabe and Olsen, 1965), Neutral normal Ammonium Acetate extract using flame photometer (Hanway and Heidel, 1952) and Walkely and Black method (Jackson,1967) for the determination of available nitrogen (N), phosphorus (P2O5) potassium (K2O) and organic carbon, respectively. The pH and EC of experimental site was determined through 1:2.5 soil and water suspension method (Jackson, 1967).
Technical programme
The experiment was laid out in Factorial RBD design with three replications. On succeeding maize crop, 25 treatment combinations comprising of five genotype (V1- Dekalb-Hishell, V2-Dekalb-Double, V3-Dekalb-900M-Gold, V4 -Dekalb-DKC-7074 and V5-Mahyco 3838) and five nitrogen levels (N0, N40, N80, N120 and N160) were imposed. The crop was fertilized with nitrogen as per the treatment (0, 40, 80, 120 and 160 N kg/ha) and uniformly with 60-40-20 P2O5, K2O and ZnSO4 kg/ha.
Experimental materials used and cultural operations Table 1: Yield attributes and yield as influenced by different genotypes and nitrogen levels Treatments
Cobs/ Cobs Cobs Grain Grains/ Grains/ 1000 grain 10 cobs Grain S h elling Grain Stover Harvest plant length girth rows/ ro w c o b weight (g) weight weight /10 (% ) yield yield index (cm) (cm) c o b (g ) cobs (g) (kg/ha) (kg/ha) (% )
Genotypes V1
-Dekalb Hishell 1.2 21.6 13.6 14.6 32.3 471 226 1825 1510 82.3 5150 6900 43.0 V2 -DeKalb Double 1.3 21.9 13.3 14.3 32.1 466 230 1829 1514 82.6 5750 8000 41.8 V3
-Dekalb 900M Gold
1.5 23.3 15.6 15.9 36.6 586 239 1886 1571 83.3 6360 8550 42.9 V4
-Dekalb DKC 7074
1.3 23.0 13.3 14.5 35.6 515 236 1873 1558 83.1 6080 8050 43.3 V5 -Mahyco 3838 1.0 22.3 13.5 14.0 32.2 449 228 1505 1190 78.8 4830 6830 41.5 SEm± 0.04 0.17 0.62 0 .6 0.67 22.5 3 .3 26.2 26.2 0 .3 24.1 42.0 0 .6 CD (P=0.05) 0.11 0.48 N S N S 1.91 64.0 9.5 74.5 74.5 0.9 69.2 120.0 N S
Nitrogen levels (kg/ha) N0
Table 2: Cost of cultivation, B: C ratio, crop profitability and crop productivity as influenced by different genotypes and nitrogen levels
Treatments Cost of cultivation ( /ha) B:C ratio Crop profitability(/ha/day) Crop productivity (kg/ha/day)
Genotypes
V1-Dekalb Hishell 32148 1.7 206.63 50.49
V2-DeKalb Double 32148 1.9 270.41 56.37
V3-Dekalb 900M Gold 32148 2.0 329.47 62.35
V4-Dekalb DKC 7074 32148 1.9 299.92 59.61
V5-Mahyco 3838 32148 1.6 177.69 47.35
SEm± - 0.08 6.2 0.7
CD (P=0.05) - 0.23 17.6 0.20
Nitrogen levels (kg/ha)
N0 31542 1.5 169.21 46.47
N40 31649 1.7 217.15 50.78
N80 32083 1.8 263.13 55.88
N120 32517 2.0 322.42 61.76
N160 32951 1.9 312.22 61.18
SEm± - 0.08 6.2 0.7
CD (P=0.05) - 0.23 17.6 0.20
The sources of nitrogen, phosphorus and potassium were urea, single super phosphate and murate of potash, respectively. Full dose of phosphorus and potash were applied as basal, while zinc sulphate was added at the time of last harrowing during field preparation. Nitrogen was applied in three equal splits as basal, knee-height and tasseling stages. Basal application of fertilizers was made at 8-10cm depth in furrows opened 2-3cm to the side of seed furrow. The seeds were placed manually in the furrows at a spacing of 60 x 20cm using the with recommended seed rate (20 kg/ha) on 29th June, 2008. Excess plants were thinned out at 21 days after sowing of the crop as to ensure intra-row spacing of 20cm. Weeding and irrigation were done as per crop requirements.
Experimental design, data collection and analysis
Various yield attributes and yield data on maize were recorded at harvest stages and B: C ratio worked out accordingly. Observations were recorded and analyzed as per standard statistical procedure (FRBD) suggested by Gomez and Gomez (1984). The estimates of correlation coefficients were worked out using the Mini-Tab programme based on concept developed by Dewey and Lu (1959). The correlation and
regression studies were done to established cause and effect relationship among yield attributes and yield.
RESULTS AND DISCUSSION
Dekalb 900M Gold had significantly superior yield attributes
viz. cobs/plant (1.5), cob length (23.3cm), grains/row (36.6), Figure 1: Meteorological trends during maize growing period
40
35
30
25
20
15
10
5
0
Temperature (°C) and sunshine (hrs.)
26 27 28 29 30 31 32 33 34 35 36 37 38 39 40 41
Meteorological week
100 90
80
70
60
50
40
30
20
10
0
Rainfall (mm) and relative humidity (%)
Rainfall Temp.max Temp.min Sunshine Humidity
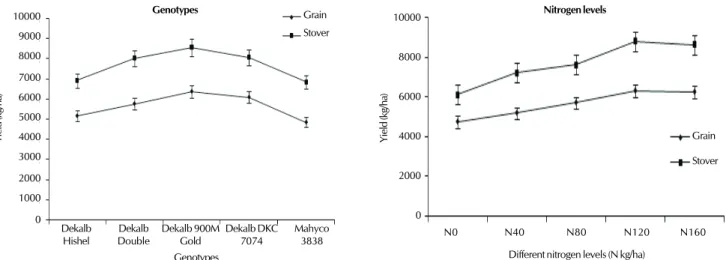
Figure 2. Effect of genotypes and nitrogen levels on grain and stover yield of Maize (standard error bars indicates the CD Values) Grain
Stover 10000
9000
8000
7000
6000
5000
4000
3000
2000
1000
0
Yield (kg/ha)
Dekalb Hishel
Dekalb Double
Dekalb 900M Gold
Dekalb DKC 7074
Mahyco 3838 Genotypes
Genotypes
Grain
Stover 10000
8000
6000
4000
2000
0
Yield (kg/ha)
N0 N40 N80 N120 N160
Nitrogen levels
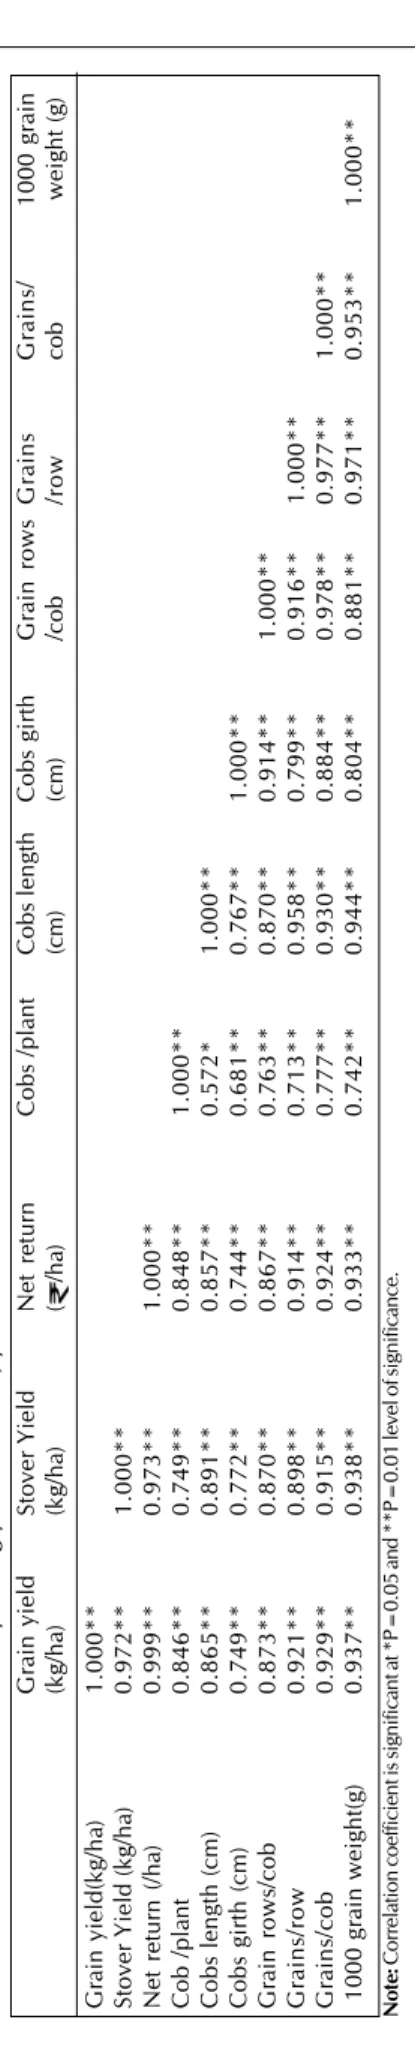
Table 3: Correlation coefficient study among yield attributes, yield and economics
Grain yield
Stover
Yield
Net
return
Cobs
/plant
Cobs
length
Cobs
girth
Grain rows
Grains
Grains/
1000 grain
(kg/ha)
(kg/ha)
(
/ha)
(cm)
(cm)
/cob
/row
c
o
b
weight (g)
Grain yield(kg/ha)
1.000**
Stover Yield (kg/ha)
0.972**
1.000**
Net return (/ha)
0.999**
0.973**
1.000**
Cob /plant
0.846**
0.749**
0.848**
1.000**
Cobs length (cm)
0.865**
0.891**
0.857**
0.572*
1.000**
Cobs girth (cm)
0.749**
0.772**
0.744**
0.681**
0.767**
1.000**
Grain rows/cob
0.873**
0.870**
0.867**
0.763**
0.870**
0.914**
1.000**
Grains/row
0.921**
0.898**
0.914**
0.713**
0.958**
0.799**
0.916**
1.000**
Grains/cob
0.929**
0.915**
0.924**
0.777**
0.930**
0.884**
0.978**
0.977**
1.000**
1000 grain weight(g)
0.937**
0.938**
0.933**
0.742**
0.944**
0.804**
0.881**
0.971**
0.953**
1.000**
Note:
Correlation coefficient is significant at *P=0.05 and **P=0.01 level of significance.
grains/cob (586), 1000 grain weight (239g), ten cobs weight (1886g), grain weight/ten cobs (1571g), shelling percentage (83.3%), grain yield (6340 kg/ha) and stover yield (8550 kg/ ha) over other genotypes (Table 1). Harvest index, grain rows/ cobs and cobs girth did not influenced by none of the genotypes, but highest values were recorded by Dekalb 900M Gold. Dekalb 900M Gold yielded 31.6%, 23.5%, 10.6% and 4.6% higher grain yield than Mahyco 3838, Dekalb Hishell, Dekalb Double and Dekalb DKC 7074, respectively. This might be due to higher leaf area index of genotype Dekalb 900 M Gold resulted in more photosynthesis and produce more photosynthate for sink and gave batter yield attributes. Similar finding were also reported by Kumar et al. (2002) Muhammad
et al. (2004) and Pal and Bhatnagar (2009). Effect of genotypes and nitrogen levels on grain and stover yield of maize (standard error bars indicates the CD values) were depicted in Fig. 2. Significantly higher benefit: cost ratio (2.0), crop profitability (329.47 /ha/day)and crop productivity (62.35 kg/ha/day) were fetched with the genotype Dekalb 900 M Gold. However, significantly lowest benefit: cost ratio (1.6) were obtained under Mahyco 3838 (Table 2). This might be due to Dekalb 900 M Gold have great potential to produced more grain and stover yield that may leads more B: C ratio and crop productivity than others hybrids (Sabh Jeet et al., 2012).
CD values
Crop fertilized with 160 kg N/ha registered significantly higher yield attributes viz. cob length (23.9cm), cob girth (15.0cm), grain rows/cob (15.5), grains/row(36.4), grains/cob (565), 1000 grain weight (240g), ten cobs weight (1886 g), grain weight/ ten cobs (1571), shelling percentage (83.1%), grain yield ( 6240 kg/ha) and stover yield ( 8630 kg/ha) than those given 40 kg N/ha or no nitrogen (Table 1). The crop fertilized with 120kg N/ha remaining at par yield attributes with those given 80 and 160kg N/ha and proved superior over no nitrogen and 40kg N/ha in terms of yield and yield attributes. Cobs/ plant and harvest index did not influenced by different nitrogen levels, The sink capacity of the plant is depends mainly on vegetative growth of the plants and vigorous vegetative growth increased leaf area index with the application of higher dose of nitrogen, consequently supply of photosynithates for the formation of yield components was also enhanced. The results are in close conformity with the findings of Sabh Jeet et al.
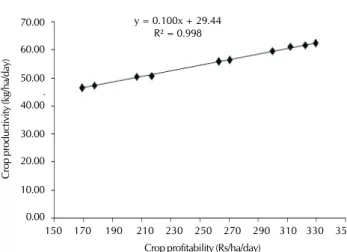
(2012), Raja (2000) and Sharma et al. (2000). The significantly higher B: C ratio, crop profitability and crop productivity at the slightly higher levels of nitrogen (120 kg N/ha) than lower levels (Table 2). The application of 120 kg N/ha gave the highest benefit: cost ratio (2.0), crop profitability (322.42/ha/day)and crop productivity (61.76 kg/ha/day) closely followed by 160 kg N/ha (Sabh Jeet et al., 2012, Pal and Bhatnagar, 2009 and Sharma et al., 2000). Crop productivity and crop profitability was positively correlated with correlation co-efficient of 0.998 (R2). This was further supported by the regression analysis (equation 1). Thus, unit increase in crop profitability caused increase in crop productivity by 29.44 kg/ha/day (Fig. 3). The increase in crop profitability with increase in crop productivity was also reported by Chaudhary et al. (2002).
Y = 0.100x + 29.44
Association among traits measured by correlation coefficient revealed a significant and positive correlation (Table 3). The grain yield of maize was significant and positively correlated stover yield (r = 0.972), net return (r = 0.999), cobs/plant (r = 0.846), cobs length (r = 0.865), cobs girth (r = 0.749) grain rows/cobs (r = 0.873), grain/rows (0.921), grain/cobs (r = 0.929) and 1000 grain weight (r = 0.937). Test weight (1000 grain weight) which was yield determined attributes also significant and positively correlated with other yield attributing characters viz. stover yield (r = 0.0938), net return (r = 0.933), cobs/plant (r = 0.742), cobs length (r = 0.944), cobs girth (r = 0.804) grain rows/cobs (r = 0.881), grain/rows (r = 0.971), grain/cobs (r = 0.953).
The present investigation confirmed that maize genotype well performed and produced higher yield attributes to the added nitrogen. It was found that genotype Dekalb 900 M Gold produced higher yield attributes that resulted in more grain yield under 160 kg N/ha closely followed by 120 kg N/ha. Correlation matrix among traits (yield attribute and yield) showed significantly and positively associated with each other. This was further supported by the curve fitted regression analysis. However, application of 120kg N/ha caused higher benefit: cost ratio and crop productivity closely followed by 160 kg N/ha. Hence, from the above discussion, it may conclude that genotype Dekalb 900 M Gold well responds to the each unit added nitrogen i.e. 120kg N/ha and saved 40kg N/ha to achieved comparable yield attributes and yield of maize in respect of economics and ecological concern.
REFERENCES
Choudhary, R. S., Rana, K. S. and Kantwa, S. R. 2002. Effect of cropping system and nitrogen on growth and yield of maize (Zea mays L.). Ann. Agril. Res.23(3): 461-464.
Kumar, A., Thakur, K. S. and Manuja, S. 2002. Effect of fertility levels of promising hybrids maize (Zea mays, L) under rainfed conditions of
Himachal Pardesh. Indian J. Agronomy.47(4): 526-530.
Muhammad, S., Abdul, A., Muhammad, I. and Abdul, A. 2004.
Performance of maize hybrids under different NPK regime. Sarhad J. Agric.20(1): 93-97.
Pal, M. S. and Bhatnagar, A. 2009. Production potential and economics of winter maize (Zea maize L.) cultivars in Tarai belt of Uttarakhand.
Current Adv. Agril. Sciences1(1): 14-16.
Prasad, U. K. and Parsad, T. N. 1988. Production potential of intercrops with winter maize. Indian Farming. 38(7): 9-10.
Raja, A. 2000. Effect of nitrogen and plant population on yield and quality of super sweet corn (Zea mays L.). Indian J. Agronomy. 46(2):
246-249.
Sharma, N. N., Paul, S. R. and Sarma, D. 2000. Response of maize (Zea mays L.) to nitrogen and phosphorus under rainfed conditions of the hills zone of Assam. Indian J. Agronomy. 45(1): 126-131.
Thomson P. R., Geyer A. B., Bishop B. L., Yong J. R. and Lentz, E. 2004. Nitrogen fertility effects on grain yield, protein and oil of corn hybrids with enhanced grain quality traits. Crop Management. pp. 1-7.
Dewey, D. R. and Lu, K. H. 1959. A correlation and path coefficient analysis of components of crested wheat grass and seed production.
Agron. J.51: 515-518.
Gomez, K. A. and Gomez, J. H. 1984. Statistical Procedures for Agricultural Research. J. Wiley and Sons.
Hanway, J. J. and Heidel, H.1952. Soil analysis, as used in Iowa State. College of Soil Testing Laboratory, Iowa, Agriculture. 57: 1-31.
Watanabe, F. S. and Olsen, S. R. 1965. Test of an ascorbic acid method for determining phosphorus in water and NaHCO3 extracts.
Soil Sci. Soc. Amr. Proc.29: 677-678.
Subbiah, B. V. and Asija, E. L. 1956. A rapid procedure for estimation of available nitrogen in soil. Current Sci.25(8): 259-260.
Sabha Jeet, Singh, J. P., Rakesh, K., Prasad, R. K., Pramod, K., Anupma, K. and Prakash, P. 2012. Effect of nitrogen and sulphur levels on yield, economics and quality of QPM hybrids under dryland condition of Eastern Uttar Pradesh, India. J. Agric. Sci. 4(9): 31-38.
Narang and Gill. 2004. A text book of field crops. pp. 89-120.
Rasheed, M., Ali, H. and Tariq, M. 2004. Impact of nitrogen and sulfur application on growth and yield of maize (Zea mays L.) J. Crop Res.15(2): 153-157.
Onasanya, R. O., Aiyelari, O. P., Onasanya, A., Oikeh, S., Nwilene, F. E. N. and Oyelakin, O. O. 2009. Growth and Yield Response of Maize (Zea mays L.) to Different Rates of Nitrogen and Phosphorus Fertilizers in Southern Nigeria. World J. Agric. Sci.5(4): 400-407, 2009.
Khan, A., Jan, A., Bashir, S. and Mammona N. 2005. Effect of nitrogen and seed size on maize crop. J. Agric. Social Sci.1 (4): 380-381.
Lack, S., Naderi, A., Siadat, S. A., Ayenehband, A., Nour-Mohammadi, G. and Moosavi, S. H. 2008. The effects of different levels of irrigation, nitrogen and plant population on yield, yield components and dry matter remobilization of corn at climatical conditions of Khuzestan.
J. Sci. Tech. Agric. Nat. Res. 11(42A): 1-15.
Jackson, M. L. 1967. Soil chemical analysis, Prentice Hall of Inc. New York, US.A.
Figure 3: Regression between crop productivity and crop profitability 70.00
60.00
50.00 . 40.00
30.00
20.00
10.00
0.00
Crop productivity (kg/ha/day)
150 170 190 210 230 250 270 290 310 330 350
Crop profitability (Rs/ha/day) y = 0.100x + 29.44