Effects of the land use change on ecosystem service value
J. Zhou, L. Sun, S.Y. Zang*, K. Wang, J.Y. Zhao, Z.X. Li, X.M. Liu, X.R. Liu
Key Laboratory of Remote Sensing Monitoring of Geographic Environment, College of Heilongjiang Province, Harbin Normal University, No.1 South Shida Road, Limin Economic
Development Zone, Harbin, Heilongjiang, 150025, P. R. China
Global J. Environ. Sci. Manage., 3(2): 121-130, Spring 2017 DOI: 10.22034/gjesm.2017.03.02.001
ORIGINAL RESEARCH PAPER
Received 15 November 2016; revised 14 January 2017; accepted 1 February 2017; available online 1 March 2017
*Corresponding Author Email: [email protected] Tel.: +8645 1 8806 0689 Fax: +8645 1 88060689
Note: Discussion period for this manuscript open until June 1, 2017 on GJESM website at the “Show Article”.
ABSTRACT: The impacts of land utilization change on the ecosystem service values in Daqing during 1995 to 2015 were analyzed based on unit area ecosystem service value of Chinese territorial ecosystem from Mr. Xie Gaodi and ecosystem service value calculation formula from Costanza. Results showed that the ecosystem service value of Daqing decreased from US $4343.1559m in 1995 to US $3824.327m in 2015, with the ecological value of US $518.8289 m decreased during the past 20 years. Wetland and water body were the two main land utilization types with the greatest contributions to the ecosystem service value. Ecosystem services value of per capita decreased 23.52%. The sensitivity coeficient of eco-service values of all types of land utilization to their value coeficients were all less than 1 in Daqing area. The sensitivity coeficients followed that wetland > water body > woodland > unutilized land > pasture land> cultivated land in 2015, which indicating that the changes of the land utilization are lack of lexibility to the changes of the ecosystem service value.
KEYWORDS: Ecosystem service value (ESV);Land utilization; Northeast China area; Sensitivity index; Urbanization.
INTRODUCTION
The ecosystem service function means the natural environment conditions and their effectiveness for maintaining the existence of the human being, which is formed by the ecosystem and ecological processes (Daily, 1997). According to their functions and utilization situations, the ecological service function values can be divided into four categories: direct utilization value, indirect utilization value, selection value and existence value (Bi and Ge, 2004). The analysis and evaluation of the ecosystem service
function value are the hot research points in the ield
of ecology and ecological economy. Land is the carrier of various terrestrial ecosystems. The utilization of land is an indispensable activity for the existence and
development of the human beings. The variation of the land utilization and the resulting changes in the land coverage patterns not only change the structure of the ecosystem, make biodiversity loss and decrease the productivity of the ecosystem but also lead to the changes of the function of the ecosystem. So, the land utilization change plays a decisive role (Daily, 1997; Costanza et al., 1997; Ge et al., 2000; Long et al., 2014; Song et al., 2015) in maintaining the service function of the ecosystem. There is very close relationship between the types of ecosystem and types of land utilization. So, the study of the impact the land utilization change to the regional ecosystem
service value (ESV) has very important signiicance.
2006; Xiao et al., 2003; Muellera et al.,2016;Song
et al.,2015; Yirsaw et al., 2016; Valdez et al., 2016; Feng et al., 2014; Lopes et al., 2015; Vejre et al.,2010; Costanza et al.2014). Based on the changes of the land utilization in Daqing during the years of 1995 to 2015, the author evaluated the evolutionary law of the ecosystem service value brought by the changes of the land utilization (Wang et al., 2006; Yu et al., 2011; Valdez et al., 2013; Zhang et al., 2012; Zhang
et al., 2015; Lautenbach et al., 2011).The purposes of
this research are to provide the scientiic basis for the
sustainable utilization of the land resources, for the eco-environmental protection, for the maintenance of the ecological balance and for the promotion of coordinated development of the regional resources and environment in Daqing area in 1995-2015.
MATERIALS AND METHODS
Study area
Daqing is located in the middle of the Songnen
plain. Its latitude is from 45°46′ to 46°55′ N, its longitude is from 124°19′ to 125°12′ E (Fig.1). It is 150 km in its southeast direction away from Harbin City, which is the capital of Heilongjiang Province, and is 139 km in its northwest direction away from
QiQihar. The territory of the city is lat. Its average
elevation is 146 meters. Through Binzhou rail road, it can reach to Mongolia and Russia. Through the golden waterway of Songhua River, it can reach to Russia directly. The territorial and geographical advantages are very obvious. Daqing is the transfer station of the Eurasian continental bridge also is the transfer hub of Heilongjiang, Jilin and Inner
Global J. Environ. Sci. Manage., 3(2): 121-130, Spring 2017
Mongolia provinces. Daqing has jurisdiction over Saertu, Honggang, Ranghulu, Longfeng, Datong
ive districts and Zhao Zhou, Zhaoyuan and Lindian
three counties, and Duerbote Mongolian Autonomous
County. The sunshine is suficient in Daqing area,
but the rainfall is relatively less. The time of winter is longer and the weather is cold. May, in the summer and autumn time, it is cool and refreshing. Annual precipitation is between 400 mm and 550 mm, and the precipitation in the growing season is between 350 mm and 480 mm, accounting for more than 85% of the annual precipitation. Daqing has the largest onshore
oilield in China and is the important petrochemical industrial base. In ifty years, Daqing has contributed
accumulatively 2 billion tons crude oil to our country, paid 1700 billion RMB tax to the government, created
US $50 b of the exportation proit (Zang et al. 2011). The dynamic agriculture and animal husbandry
and the local economy which is led by the key high
tech enterprises are developing lourishingly. In
the municipal comprehensive strength comparison appraising activities made by National Statistics Bureau, Daqing is ranked as No. 19 (Zang et al. 2011).
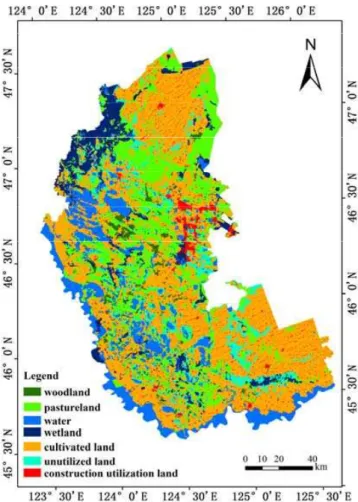
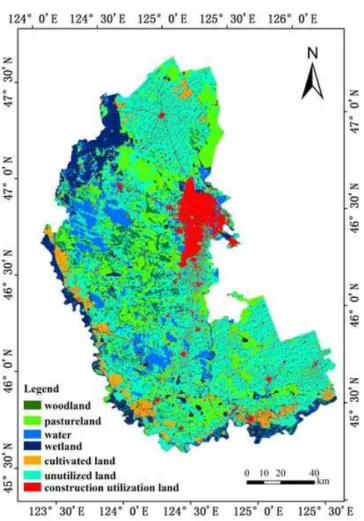
Data
Major dataset used in this research includes remote sensing imagery and socio-economic information. Landsat Thematic Mapper (TM) data acquired in 1995 and 2015 were utilized to derive land utilization maps for the two years (Figs. 2 and 3). The resources of the data in this research mainly came from Daqing Statistical Yearbook, China Statistical Yearbook. The selected research area is separated according to the real situation, including mainly; 1) cultivated land, refers to the land where the crops are planted, including the newly reclaimed wasteland, fallow land,
grass and crops rotation land and cultivated fruit and forest land where the agricultural fruits and other kinds of crops are planted; 2) woodland, refers to the forest land where the shrubs, arbors and bamboo etc. are grown; 3) pastureland, refers to the land where herbaceous plants are mainly grown, including shrub grass land which mainly for the husbandry, and veld (open woodland) with the canopy density below 10%;
4) wetland, refers to low-lying, lat land, where is
moist and wet in long term, the drainage is poor and the wetland plants are grown on the surface of the soil; 5) construction utilization land, refers to urban and rural residential settlement and industry, mining and transportation utilization land; 6) unutilized land, refers to the land which is unused at present time or
the land which is dificult to be utilized, in Daqing
area, it is mainly shown as bare land; 7) water body, refers to rivers, lakes, reservoirs and pond.
Quantitative analysis of land use change
Land use changes were assessed by comparing the areas occupied by each land use type in each period. For each study period, the total area lost or gained by each land use type was calculated. In this study, two indices, the land use dynamic index (Hao et al., 2012) and land use dynamic degree (Liu et al., 2010; Wang
et al., 1999) were employed to analysis of land use changes in the area of Daqing. These indices can be assessed as Eq. 1.
T S
S S K
a a b− ×1
= (1)
Where K is the land use dynamic index of a certain land use type, S is the area for a certain land use type, ‘‘a’’and ‘‘b’’ are the initial and inal areas, respectively, and “T’’ is the study period. If “T’’ is 1 year, then K is the annual rate of change of a certain land use type. Fig. 3: Land utilization classiication map for Daqing in 2015
Global J. Environ. Sci. Manage., 3(2): 121-130, Spring 2017
Evaluation methods of the service value of ecosystem During the calulation of the ecosystem service value of in Daqing area (Sawut et al., 2013), considering the real situation of the researched areas, some
modiications are made in the reference. The residential
settlement, transportation and water conservancy facilities belong to the construction utilization, referred to research results of Costanza (Costanza et al., 1997). The parameter of their ecological value is 0; the unutilized land is divided as: the saline-alkali
land, marsh, sand, mud lat and reed shallows, wild
grass ground, and bare rocks in the land utilization plan. With the reason of short of the statistical data of their real utilization, they are considered together as unutilized land. Their ecological value is the average of the desert and grassland (Xu et al., 2008). The calculation formula of the ecosystem service value is as Eq. 2.
(
)
∑
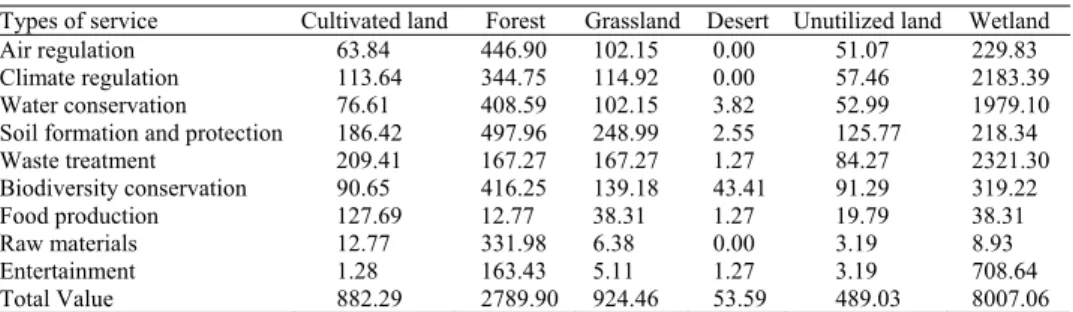
= × = n i i i A VC ESV 1 (2)Where in Eq. 1, ESV refers to the total value of the ecosystem service function of the research region, VCi is the unit area ecosystem service value with type i land utilization (US $/ha), using unit area ecosystem service value of Chinese Territorial ecosystem made by (Xie et al., 2003)and his partners (Table 1). Ai is the area of type i land utilization in the research region (ha), n refers to the number of the types of the land utilization.
Calculation for the changes of the ecological service value per capita
In order to show out the relationship of ecosystem service value with human beings, it must calculate out the ecological service value per capita. The changes can show the relationship of the ecosystem service function with the population according to the Eq. 3.
i n i i A N VC N ESV ESV
Ave = =
∑
×=1
) (
(3)
Where in Eq. 2, Ave(ESV) is the amount of ecological service per capita; N is population; the
deinitions of the other parameters in the formula are
the same as those in Eq. 2.
The calculation of the sensitivity index of the ecological value
In this article, the concept of lexibility coeficient
which is frequently used in the economy (Kreuter
et al., 2001; Mankiw, 1999) is applied to calculate
the sensitivity index of the coeficient of value. The
purpose is to determine the dependence level of the change of the ecosystem service value with the time
upon the coeficient of value, and also to verify the
representativeness of the above types of ecosystem to the types of the land coverage and to verify the
accuracy of the coeficient of value provided by Costanza too. Flexibility coeficient refers to the ratio
of the percentage of the changes of the dependent variables to the percentage of the changes of the independent variables, when CS < 1, it shows that
the value of ecosystem is short of lexibility, when CS>1, it shows the value of the ecosystem is lexible.
The high value of CS declares the ecosystem service
value is lexible compared with the coeficient of value. Further, it also illustrates the signiicance
of the accuracy of the ecosystem value factor to the evaluation of the ecosystem service value. The calculation is based on Eq. 4.
(
)
(
)
ik ik jk i i j VC VC VC ESV ESV ESV CS − −= (4)
Where in Eq. 4, j and i represent the value of the
Table 1 Table of Unit area ecological service values of Different Chinese Territorial Ecosystems (US $/ha)
Types of service Cultivated land Forest Grassland Desert Unutilized land Wetland Air regulation 63.84 446.90 102.15 0.00 51.07 229.83 Climate regulation 113.64 344.75 114.92 0.00 57.46 2183.39 Water conservation 76.61 408.59 102.15 3.82 52.99 1979.10 Soil formation and protection 186.42 497.96 248.99 2.55 125.77 218.34 Waste treatment 209.41 167.27 167.27 1.27 84.27 2321.30 Biodiversity conservation 90.65 416.25 139.18 43.41 91.29 319.22 Food production 127.69 12.77 38.31 1.27 19.79 38.31 Raw materials 12.77 331.98 6.38 0.00 3.19 8.93 Entertainment 1.28 163.43 5.11 1.27 3.19 708.64 Total Value 882.29 2789.90 924.46 53.59 489.03 8007.06
initial situation and the value after the coeficient is modiied.
RESULTS AND DISCUSSION
Analysis of the changes of land utilization in Daqing area
According to the need of the research, the land in Daqing area is separated into seven categories, e.g. the cultivated land, woodland, pasture land, residential land and construction land, unutilized land, wetland
and water body classiied from remote sensing
imagery (Table 2).
Data in Table 2 shows that the main type of the land utilization in Daqing in 1995 is cultivated land, followed with pastureland and water body; while, the main type in 2015 is unutilized land, up to 9 thousand square km, following is the pasture land.
Large changes happened with the land utilization during 1995-2015. The overall trend is that the water body, pasture and cultivated land is decreasing, in which the cultivated land reduced the most, up to 8779.85 square km, with the rate of change is -91.32%, and the dynamic degree is -4.57%. The proportion of cultivated land decreased from 45.65% to 3.95%. Water body decreased by 1022.45 square km, with the rate of change is -35.92%, and the dynamic degree is -1.8%. The proportion of cultivated land decreased
from 13.51% to 8.64%. Pasture land decreased by 532.34 square km, with the rate of change is -11.88%, and the dynamic degree is -0.59%. The proportion of cultivated land decreased from 21.27% to 18.7%. The unutilized land and woodland increased the most. Unutilized land increased by 7652.08 square km, with the rate of change is 524.67%, and the dynamic degree is 26.23%. Woodland increased by 1261.21 square km, with the rate of change is 342.94%, and the dynamic degree is 17.15%. Meanwhile, Construction utilization land and wetland increased, with the dynamic degrees of 8.37% and 0.72%, respectively. Daqing oil industry rapidly developed during the period of 1995-2015, which resulted in construction utilization land increased rapidly. Especially the implementation of the strategic decision of “Ha-Da-Qi industrial corridor” in 2005, the development of Daqing regional economy and population was promoted, and also the development of the oil industrialization process was derived. The increased of woodland is due to the implementation of returning farmland to forest policy, which promoting the construction of protection forest
system in northeast China. The increased of artiicial forest prevented the excessive exploitation of oil ield
caused by soil erosion. At the same time, because the
area is closed low area, poor drainage, unreasonable
land exploitation and utilization of land salinization,
Table 3: ESVs in 1995 and 2015, and their changes during 1995-2015
Land use type ESV in 1995 (US $ 104)
ESV in 2015 (US $ 104)
Values of changes (US $ 104)
Ratio of changes
(%)
ESV per cap (US $) Ratio of ESV per cap (%) 1995 2015
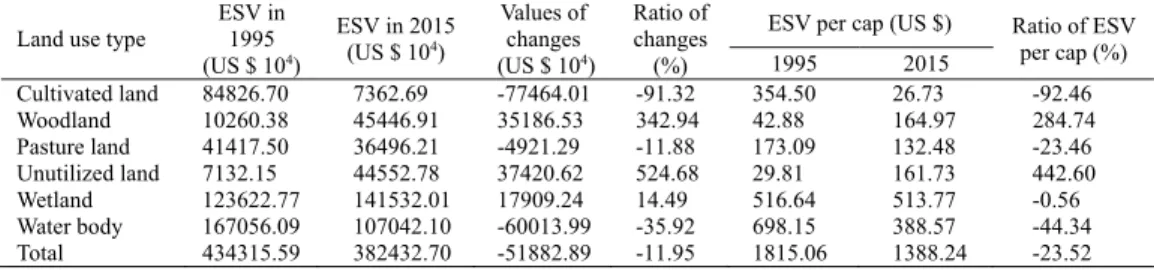
Cultivated land 84826.70 7362.69 -77464.01 -91.32 354.50 26.73 -92.46 Woodland 10260.38 45446.91 35186.53 342.94 42.88 164.97 284.74 Pasture land 41417.50 36496.21 -4921.29 -11.88 173.09 132.48 -23.46 Unutilized land 7132.15 44552.78 37420.62 524.68 29.81 161.73 442.60 Wetland 123622.77 141532.01 17909.24 14.49 516.64 513.77 -0.56 Water body 167056.09 107042.10 -60013.99 -35.92 698.15 388.57 -44.34 Total 434315.59 382432.70 -51882.89 -11.95 1815.06 1388.24 -23.52
Note: the data of population of 1995 and 2015 came from the “China City Statistic YearBook”.
Table 3: ESVs in 1995 and 2015, and their changes during 1995-2015
Table 2: Changes of the area of each category of the land utilized in Daqing area (Unit: km2 and %)
Land utilization categories Area 1995 2015
(km2) Proportion (%) (kmArea 2) Proportion (%)
Cultivated land 9614.34 45.65 834.4947 3.95 Woodland 367.7693 1.75 1628.982 7.71 Pastureland 4480.193 21.27 3947.85 18.70 Construction utilization land 749.1192 3.56 2003.47 9.49 Unutilized land 1458.442 6.93 9110.522 43.14 Wetland 1543.922 7.33 1767.59 8.37 Water body 2846.122 13.51 1823.668 8.64 Total 21059.91 100.00 21116.58 100.00
Global J. Environ. Sci. Manage., 3(2): 121-130, Spring 2017
therefore, unused area of explosion. Wetlands area increased was due to strengthen ecological protection.
The reason of the decreased of cultivated land were various. The speeding up of urbanization and the development of oil industry took up a lot of cultivated land. At the same time, because the land salinization is
serious in Daqing area. Oilield development reduced
the number of arable land, is a profound badly effect on cultivated land quality. The pollutant derived from
oilield drilling and oil chemical industry emitted
through a variety of ways such as surface runoff, spreading of harmful substances into the soil, cause the pollution of farmland, so that the cultivated land
loss of productivity. The development of oil ield and
animal husbandry leaded to a drop in grassland area.
Analysis of the changes of the ecosystem service value in Daqing area
According to the related data in Tables 1 and 2, and the Eq. (2), it is calculated the overall value of the ecosystem service in Daqing area (Table 3). The results showed that the main types of land utilization by which the ecosystem service value in Daqing were wetland and water body, with the proportion of more than 60%. For the wetland, its ecological service value accounting for 37.01% of the total value in 2015, which related to the high ecological service value per unit area in wetland (Zorrilla-Miras et al., 2014). For the water body, its ecological service value accounting for 27.99% of the total value in 2015. The overall ecosystem value in the research area was decreased in 21 years with the change rate is 11.95%. The overall change of the ecological value is very large. The cultivated land reduced the most, and the loss value of ecosystems was 91.32%; while, the unutilized land
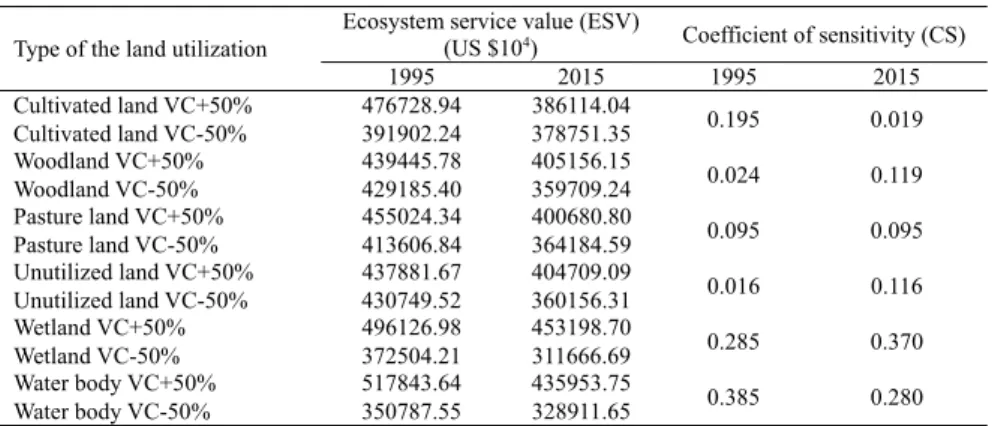
Table 4: Sensitivity of the ecosystem service value
Type of the land utilization Ecosystem service value (ESV) (US $104) Coefficient of sensitivity (CS)
1995 2015 1995 2015 Cultivated land VC+50% 476728.94 386114.04 0.195 0.019 Cultivated land VC-50% 391902.24 378751.35
Woodland VC+50% 439445.78 405156.15 0.024 0.119 Woodland VC-50% 429185.40 359709.24
Pasture land VC+50% 455024.34 400680.80 0.095 0.095 Pasture land VC-50% 413606.84 364184.59
Unutilized land VC+50% 437881.67 404709.09 0.016 0.116 Unutilized land VC-50% 430749.52 360156.31
Wetland VC+50% 496126.98 453198.70 0.285 0.370 Wetland VC-50% 372504.21 311666.69
Water body VC+50% 517843.64 435953.75 0.385 0.280 Water body VC-50% 350787.55 328911.65
Table 4: Sensitivity of the ecosystem service value
increased the most. Thus, the main reason for reducing the number of Daqing city ecosystem services value is caused by a big drop in cultivated land. The period of study, six types of land use types of ecological service value and its change trend of area is consistent.
Compared with the overall eco-service value, the eco-service values per capita show different change situation. It is mainly manifested as: the value per capita of unutilized land and woodland increased the most. Although wetlands ecological value has increased, but due to that it was lower than the rate of population growth, so its per capita ecological value showed a trend of decline. Cultivated land, water, and the change of per capita value of grassland and the trend are consistent with the overall value changes (Li et al., 2014).
Analysis of the sensitivity
According to the coeficient of sensitivity
calculation Eq. 4 and for the purpose to be convenient during calculation, the author adjust the ecosystem
service value coeficient (VC) up and down 50% separately in order to analyze the signiicance of
the change of certain type of land utilization in Daqing area to the change of the ecosystem service value (Table 4). The results show that the sensitivity
coeficient of eco-service values of all types of land utilization to their value coeficients are all less than 1
in Daqing area. The highest CS value is 0.285-0.370,
which means when the eco-service value coeficient
increases 1%, the total eco-service value will increase 0.285 to 0.370 percentages. It shows concretely as:
wetland > water body > woodland > unutilized land > pasture land> cultivated land. It indicates that the ESV in the research region is short of lexibility to
SC of wetland, unutilized land and woodland shows an increase result, all the SCs of other types of land utilization are decreased. It indicates that the change
of the VC of wetland can have a magniied effect to
the total eco-service value, which was agreed with the results of Valdez et al. (2016). Its research that wetland is very sensitive to changes in land use, these changes alter the supply of the ecosystem services and quality (Valdez et al., 2014).
CONCLUSION
The changing characteristics of ecosystem service value in Daqing induced from the land utilization change during the 20 years of 1995-2015 were analyzed. Analyses of results suggest several conclusions as below:
(1) The structure of the land utilization in Daqing area had a great change during 1995 to 2015. The unutilized land increased the most, followed by constructional land and woodland, and wetland increased in a small extent. The cultivated land reduced the most, which was indicating an evitable phenomenon that large area of cultivated land will be evaded during the quick process of urbanization (Chen et al., 2016).
(2) Wetland and water body were the two main land utilization types with the greatest contributions to the ecosystem service value. The change trend of the ecosystem service value of the land utilization in the selected research area is consistent with that of its main components. In the quick process of the urbanization, the construction land utilization and unutilized land is increasing, while, the cultivated land, water body and pasture land is reducing. Ecosystem service value was decreased by 11.95% during the years of 1995 to 2015.
(3) The sensitivity coeficient of eco-service
values of all types of land utilization to their value
coeficients were all less than 1 in Daqing area. The sensitivity coeficients followed that wetland > water body > woodland > unutilized land > pasture land>
cultivated land in 2015, which indicating that the
changes of the land utilization are lack of lexibility to
the changes of the ecosystem service value.
ACKNOWLEDGEMENT
This study was inancially supported by the
Special Award for the Science and Technology Talents Research Foundation of Harbin Technology Bureau (No. 2016RAXXJ037), the National Natural
Science Foundation of China (No. 41401589), and the Key Provincial Natural Science Foundation of Heilongjiang Province (No. ZD201308).
CONFLICT OF INTEREST
The authors declare that there is no conlict of
interests regarding the publication of this manuscript.
ABBREVIATIONS
CS Coeficient of Sensitivity ESV Ecosystem Service Value TM Thematic Mapper VC Value Coeficient
REFERENCES
Bi, X.L.; Ge, J.P., (2004). Evaluating ecosystem service valuation in China based on the IGBP land cover datasets. J. Mt. Sci-Engl.,
22(1): 48-53 (6 pages). (in Chinese with English abstract)
Cai, B.C.; Lu, G.F.; Song, L.J.; Huang, H.P.; Han, S.F.; Chen, K.L., (2006). Variation of ecosystem services’value of Kunshan based on the land use change. Acta Ecologica Sin. (Int. J.)., 26(9):
3005-3010 (6 pages).
Chen, X.Z., (2016). A study on the value change of land ecosystem services in Huangguoshu scenic area. Asian Agricultural
Research., 8(5): 57-60, (4 pages).
Costanza, R.; Groot, R.D.; Sutton, P.; Ploeg, S.V.D.; Anderson, S.J. ; Kubiszewski, I.; Farber, S.; Tuener, R.K., (2014). Changes in the global value of ecosystem services. Global Environ. Change.,
26(1): 152-158 (7 pages).
Costanza ,R.; d’Arge, R.; Groot, R.D.; Farber, S.; Grasso, M.; Hannon, B.; Limburg, K.; Naeem, S.; O’Neill, R.V.; Paruelo, J.; Raskin, R.G.; Sutton, P.; Belt, M.V.D., (1997). The value of the world’s ecosystem services and natural capital. Nature., 38(6):
253-260 (8 pages).
Daily, G.C., (1997). Nature’s service: societal dependence on natural ecosystems. Island Press; Washington, USA.
Feng, Y.B.; He, C.Y.; Yang, Q.Y.; He, J., (2014). Evaluation of ecological effect in land use planning using ecosystem service value method. Transactions of the Chinese Society of Agric.
Eng., 30(9): 201-211 (11 pages).
Ge, Q.S.; Zhao M.C.; Zheng, J.Y., (2000). Land Use Change of China during the 20th Century. Acta Geol. Sin.., 55(6): 698-706
(9 pages). (in Chinese with English abstract)
Hao, F.H.; Lai, X.H.; Ouyang, W.; Xu, Y.M.; Wei, X.F.; Song, K.Y., (2012). Effects of land use changes on the ecosystem service values of a reclamation farm in Northeast China. Environ.
Manage., 50(5): 88-99 (12 pages).
Kreuter, U.P.; Harris, H.G.; Mathlock, M.D.; Lacey, R.E., (2001). Change in ecosystem service values in the San Antonio area,
Texas. Ecol. Econ., 39(3): 333-346 (14 pages).
Lautenbach, S.; Kugel, C.; Lausch, A.; Seppelt, R., (2011). Analysis of historic changes in regional ecosystem service provisioning
using land use data. Ecol. Indic., 11(2): 676-687(12 pages).
Global J. Environ. Sci. Manage., 3(2): 121-130, Spring 2017
the changes in land use and ecosystem services in Changzhou municipality. Peoples’ Republic of China, 1991-2006. Ecol.
Indic., 42(1): 95-103 (9 pages).
Liu, J.Y.; Zhang, Z.X.; Xu, X.L.; Kuang, W.H.; Zhou, W.C.; Zhang, S.W.; Li, R.D.; Yan, C.Z.; Yu, D.S.; Wu, S.X.; Jiang, Nan., (2010). Spatial patterns and driving forces of land use change in China during the early 21st century. J. Geog. Sci., 20(4): 483-494 (12 pages).
Li, R.Q.; Dong, M; Cui, J.Y.; Zhang, L.L.; Cui, Q.G.; He, W.M.,
(2007). Quantiication of the impact of land-use changes on
ecosystem services: A case study in Pingbian County, China.
Environ. Monit. Assess., 12(8): 503-510 (8 pages).
Long, H.L; Liu, Y.Q; Hou, X.G.; Li, T.T.; Li, Y.R., (2014). Effects of land use transitions due to rapid urbanization on ecosystem services: Implications for urban planning in the new developing
area of China. Habitat Int., 44: 536-544 (9 pages).
Lopes, L.F.G.; Bento, J.M.R.D.S.; Cristovão, A.F.A.C.; Baptista, F.O., (2015) .Exploring the effect of land use on ecosystem services: The distributive issues. Land Use Policy., 45(17):
141-149 (9 pages).
Mankiw, N.G., (1999). Principles of Economics. Peking University Press; Beijing, China.
Min, J.; Gao, W.; Li, X.Y.; Zhang, A,L., (2006). Analysis on spatial-temporal changes of land use and ecosystem services value in
Wuhan City. J. Soil Water Conserv., 20(4): 170-174 (5 pages).
Muellera, H.; Hamiltona, D.P.; Dooleb, G.J., (2016). Evaluating services and damage costs of degradation of a major lake
ecosystem. Ecosyst. Serv., 22(B): 370-380 (11 pages).
Sawut, M.; Eziz, M.; Tiyip, T., (2013). The effects of land-use change on ecosystem service value of desert oasis: a case study in Ugan-Kuqa River Delta Oasis,China. Can. J. Soil Sci., 93(1):
99-108 (10 pages).
Song, W.; Deng, X.Z.; Yuan, Y.W.; Wang, Z.;Li, Z.H., (2015). Impacts of land-use change on valued ecosystem service in rapidly banized North China Plain. Ecol. Modell., 318: 245-253 (9 pages).
Valdez, V.C.; Ruiz-luna, A.; Ghermandi, A.; Berlanga-Robles, C.A.; Nunes, P.A.L.D., (2014). Effects of land use changes on the ecosystem service values of scoastal wetlands. Environ.
Manage., 54(4): 852-864 (13 pages).
Valdez, V.C.; Ruiz-Luna, A.; Ghermandi, A.; Nunes, P.A.L.D., (2013). Valuation of ecosystem services provided by coastal wetlands in northwest Mexico. Ocean Coastal Manage., 78(3):
1-11 (11 pages).
Valdez, V.C.; Ruiz, L.A.; Robles, C.A.B., (2016). Effects of land
use changes on ecosystem services value provided by coastal wetlands: Recent and future landscape scenarios. J. Coastal Zone
Manage., 19(1): 1-7 (7 pages).
Vejre, H.; Jensen, F.S.; Thorsen, B.J., (2010). Demonstreating the importance of intangible ecosystem services from periurban
landscapes. Ecol. Complexity, 7(3): 338-348 (11 pages).
Wang, X.L.; Bao, Y.H., (1999). Study on the methods of and use
dynamic change research. Progress geography., 18(1): 81-87 (8
pages). (in Chinese with English abstract)
Wang, Z.M.; Zhang, B.; Zhang, S.Q.;Li, X.Y.;Liu, D.W.;Song, K.S.;Li,J.P.;Li,F.;Duan,H.T., (2006).Change of land use and of ecosystem service values in Sanjiang Plain, northeast Chin.
Environ. Monit. Assess., 112: 69-91 (23 pages).
Xiao, Y.; Xie, G.D.; An, K., (2003). Economic value of ecosystem services in Mangcuo Lake drainage basin. Chin. J. Appl. Ecol.,
14(5): 676-680 (5 pages). (in Chinese with English abstract)
Xie, G.D.; Lu, C.X.; Leng,Y.F.; Zheng,D.; Li, S.C., (2003). Ecological assets valuation of the Tibetan Plateau. J. Nat.
Resour., 18(2): 189-195 (7 pages).
Xu, X.; Li, X.B.; Fu, N.; Li, C., (2008). Application of ecological service value in strategic environmental assessment for land use
planning. Resour. Sci., 30(9): 1382-1387 (6 pages). (in Chinese
with English abstract)
Yirsaw, E.; Wu, W.; Temesgen, H.; Bekele, B., (2016). Effect of temporal land use/land cover changes on ecosystem services value in coastal area of China: The case of Su-Xi-Chang region.
Appl. Ecol. Env. Res., 14(3): 409-422 (14 pages).
Yu, W.H.; Zang, S.Y.; Wu, C.S.; Liu, W.; Na, X.D., (2011). Analyzing and modeling land use land cover change (LUCC) in
the Daqing City, China. Appl Geog., 31(2): 600-608 (9 pages).
Zang, S.Y.; Wu, C.S.; Hang, L.; Na, X.D., (2011). Impact of urbanization on natural ecosystem service values: a comparative
study. Environ. Monit. Assess., 179: 579-588 (10 pages).
Zhang, H.Q.; Lei, G.P.; Dou, Y.Y.; Zhang, Y., (2012). Value of ecosystem services in Daqing City-based land use change.
Territory Nat. Resour. Study, (3): 51-52 (2 pages). (in Chinese
with English abstract)
Zhang, Z.M.; Gao, J.F.; Gao, Y.N., (2015). The inluences of land
use changes on the value of ecosystem services in Chaohu Lake
Basin, Chin. Environ. Earth Sci., 74(1): 385-395 (11 pages).
Zorrilla-Miras, P.; Palomo, I.; Gómez-Baggethun, E.; Martín-López, B.; Lomas, P.L.; Montes, C., (2014). Effects of land-use change on wetland ecosystem services: a case study in the Donana marshes (SW Spain). Landscape Urban Plan., 122:
AUTHOR (S) BIOSKETCHES
Zhou, J., Ph.D., Professor, Key Laboratory of Remote Sensing Monitoring of Geographic Environment, College of Heilongjiang Province, Harbin Normal University, No.1 South Shida Road, Limin Economic Development Zone, Harbin, Heilongjiang, 150025, P. R. China. Email: [email protected]
Sun, L., Ph.D., Assistant Professor, Key Laboratory of Remote Sensing Monitoring of Geographic Environment, College of
Heilongjiang Province, Harbin Normal University, No.1 South Shida Road, Limin Economic Development Zone, Harbin, Heilongjiang, 150025, P. R. China. Email: [email protected]
Zang, S.Y., Ph.D., Professor, Key Laboratory of Remote Sensing Monitoring of Geographic Environment, College of Heilongjiang Province, Harbin Normal University, No.1 South Shida Road, Limin Economic Development Zone, Harbin, Heilongjiang, 150025, P. R. China. Email: [email protected]
Wang, K., M.Sc. Student, Key Laboratory of Remote Sensing Monitoring of Geographic Environment, College of Heilongjiang
Province, Harbin Normal University, No.1 South Shida Road, Limin Economic Development Zone, Harbin, Heilongjiang, 150025, P. R. China. Email: [email protected]
Liu, X.M., M.Sc. Student, Key Laboratory of Remote Sensing Monitoring of Geographic Environment, College of Heilongjiang
Province, Harbin Normal University, No.1 South Shida Road, Limin Economic Development Zone, Harbin, Heilongjiang, 150025, P. R. China. Email: [email protected]
Zhao, J.Y., M.Sc. Student, Key Laboratory of Remote Sensing Monitoring of Geographic Environment, College of Heilongjiang Province, Harbin Normal University, No.1 South Shida Road, Limin Economic Development Zone, Harbin, Heilongjiang, 150025, P. R. China. Email: [email protected]
Li, Z.X., M.Sc. Student, Key Laboratory of Remote Sensing Monitoring of Geographic Environment, College of Heilongjiang Province, Harbin Normal University, No.1 South Shida Road, Limin Economic Development Zone, Harbin, Heilongjiang, 150025, P. R. China. Email: [email protected]
Liu, X.R., M.Sc. Student, Key Laboratory of Remote Sensing Monitoring of Geographic Environment, College of Heilongjiang
Province, Harbin Normal University, No.1 South Shida Road, Limin Economic Development Zone, Harbin, Heilongjiang, 150025, P. R. China. Email: [email protected]
COPYRIGHTS
Copyright for this article is retained by the author(s), with publication rights granted to the GJESM Journal. This is an open-access article distributed under the terms and conditions of the Creative Commons Attribution License (http://creativecommons.org/licenses/by/4.0/).
HOW TO CITE THIS ARTICLE
Zhou, J,; Sun, L.; Zang, S.Y.; Wang, K.; Liu, X.M.; Zhao, J.Y.; Li, Z.X.; Liu, X.R., (2017). Effects of the land use change on ecosystem service value. Global J. Environ. Sci. Manage., 3(2): 121-130.
DOI:10.22034/gjesm.2017.03.02.001