A Comparative Analysis on Assessment of
Land Carrying Capacity with Ecological
Footprint Analysis and Index System Method
Yao Qian, Lina Tang*, Quanyi Qiu, Tong Xu, Jiangfu Liao
Key Lab of Urban Environment and Health, Institute of Urban Environment, Chinese Academy of Sciences, Xiamen, China
Abstract
Land carrying capacity (LCC) explains whether the local land resources are effectively used to support economic activities and/or human population. LCC can be evaluated commonly with two approaches, namely ecological footprint analysis (EFA) and the index system method (ISM). EFA is helpful to investigate the effects of different land categories whereas ISM can be used to evaluate the contributions of social, environmental, and economic fac-tors. Here we compared the two LCC-evaluation approaches with data collected from Xia-men City, a typical region where rapid economic growth and urbanization are found in China. The results show that LCC assessments with EFA and ISM not only complement each other but also are mutually supportive. Both assessments suggest that decreases in arable land and increasingly high energy consumption have major negative effects on LCC and threaten sustainable development for Xiamen City. It is important for the local policy makers, planners and designers to reduce ecological deficits by controlling fossil energy consumption, protecting arable land and forest land from converting into other land types, and slowing down the speed of urbanization, and to promote sustainability by controlling rural-to-urban immigration, increasing hazard-free treatment rate of household garbage, and raising energy consumption per unit industrial added value. Although EFA seems more appropriate for estimating LCC for a resource-output or self-sufficient region and ISM is more suitable for a resource-input region, both approaches should be employed when per-form LCC assessment in any places around the world.
Introduction
No matter how advanced science and technology becomes, human beings consistently rely on natural resources for survival and living. Expansive urbanization associated with rapid indus-trialization places enormous pressure on the Earth’s resources, and humans’requirements for resources have surpassed the planet’s regeneration capacity since the 1970s [1]. Unfortunately, the high ecological pressure in urban areas and almost fully loaded land carrying capacity are
OPEN ACCESS
Citation:Qian Y, Tang L, Qiu Q, Xu T, Liao J (2015) A Comparative Analysis on Assessment of Land Carrying Capacity with Ecological Footprint Analysis and Index System Method. PLoS ONE 10(6): e0130315. doi:10.1371/journal.pone.0130315
Editor:Abdisalan Mohamed Noor, Kenya Medical
Research Institute—Wellcome Trust Research
Programme, KENYA
Received:December 19, 2014
Accepted:May 19, 2015
Published:June 29, 2015
Copyright:© 2015 Qian et al. This is an open access article distributed under the terms of the
Creative Commons Attribution License, which permits unrestricted use, distribution, and reproduction in any medium, provided the original author and source are credited.
Data Availability Statement:All relevant data are within the paper and its Supporting Information files.
Funding:This work was supported by the National Natural Science Foundation of China (41101143).
even more troublesome as cities continue to experience population expansion, consumption growth, resource overuse, waste and emission accumulation, et al [2]. Thus, it is essential to determine land carrying capacity (LCC) to ensure the safety of ecosystems and their sustainable development, or at least to slow down the degradation of natural capital. Currently, more and more regional science programs have been devoted to study the relationship between human beings and land-use situations. The United States’NASA Land-Cover and Land-Use Change Program was designed to improve the understanding of human interactions with the environ-ment. It is focused on providing foundational knowledge of sustainability, vulnerability, and resilience of land use and on addressing issues related to land-cover and land-use changes for the purpose of human welfare [3].
Due to prodigious changes in land use, research activities on LCC have experienced a signif-icant shift from land population carrying capacity to land integrated carrying capacity [4,5]. In the late 1790s, a distinguished demographer, Thomas Robert Malthus, first described the rela-tionship between population explosion and the Earth’s carrying through Malthus’population theory, making a significant contribution to human demography, modern evolutionary biol-ogy, ecology [6,7]. The concept of LCC originates from the book“Road to Survival”by Wil-liam Vogt, who precisely defined LCC from the point of view of the human population in 1948 [8]. Over the past few decades, research has extended to comprehensively assess the impacts of human activities on LCC. After assessing what population size could be continually supported in a specific area, many studies proposed land function-oriented research for improving LCCs [9]. Here we refer LCC as the maximum human population a given region can support under a certain level of economic development and environmental conditions.
There are several ways to calculate LCC, but changing land-use patterns caused by advanc-ing modern lifestyles have complicated the calculation procedure. Due to expansive urbaniza-tion, main industries, human populaurbaniza-tion, and wealth are concentrated in city centers, and a majority of human populations occupies a small amount of land area, the locals tend to lose sight of the space and significance for non-commercial agricultural production and ecological protection [10]. Thus, the concept of agricultural sustainability was integrated into LCC. And it was suggested to improve LCC from feedback of measuring the condition of agricultural sus-tainability (e.g., the maximum level of sustainable exploitation of human resources) [11]. Noticing the correlation of land, population, and agriculture with environmental degradation, Komatsu et al. (2005) selected villages in Inner Mongolia to investigate the relationship of com-bating desertification and agricultural sustainability, aiming to evaluate the land conversion policy’s influence on the supply-demand balance in rural communities [12]. Agro-ecological zoning methodology originated in the 1970s and was applied as a system to evaluate land for rain-fed and irrigated agriculture, forestry, and grazing. This methodology has been developed by the United Nation’s food and agriculture organization (FAO) to assist with land resource assessments for better management and monitoring of these resources. In particular, based on the land productivity potential, such systems are commonly used in developing countries in order to assure food security [13].
metropolitan scale and found that food, transportation, and buildings were the largest compo-nents of the footprint [18]. In order to select useful ecological indicators based on scientific validity and policy utility, Blomqvist proposed a set of principles, including the consideration of both ecological foundations and common sense when making sustainability goals [19]. After Ma determined the five major factors influencing the national ecological footprint (gross domestic product, urbanization, distribution of income, export dependence, and service inten-sity) [20], ecological footprint calculations were improved by the application of a support vec-tor machine. In contrast, ISM is used as a tool to comprehensively assess LCC and contains multiple factors, including society, economy, production, environment, resources, etc. Wei et al. (2014) developed an index system to assess LCC by the“drive force-pressure-state-response-control”conceptual model. And they concluded that pressure from socio-economic development decreased the LCC value in several coastal cities [21].
The primary goal of this paper is to further compare the two LCC-evaluation approaches above, namely EFA and ISM. The study intended to answer the following questions: which method is suited for determining future sustainable land use? Which factors contribute to LCC and exert a major effect on it? Will ecosystems suffer from human activities in areas where nat-ural land has been converted into other land types (e.g., agricultnat-ural land, aquaculture grounds, industrial zones, or urban areas)?
Methods and Materials
Study area
The study area is sub-provincial region, Xiamen City, in Fujian Province, located in the south-east coastal of China. Xiamen City consists of an island and mainland, with a total area of 1,699 km2[22]. Over the last few decades, suburbanization has altered the land-use pattern in this region. Urbanized land has expanded from the island to the mainland, which has led to an increase in built-up land from 18.3% in 2000 up to 31.2% in 2012 and a decrease in agricultural land from 66.9% in 2000 down to 57.3%. Adjusting the balance of social development, popula-tion growth, and ecological protecpopula-tion proves to be an important concern in Xiamen City.
The aim of LCC assessment in this region is to predict the long-term influences of human activities on land resources and propose effective land management strategies. Such an aim has regional representative meaning because Xiamen City is the core of the Western Taiwan Straits Economic Zone as well as a Model livable City in China.
Ecological footprint analysis
Cooperation and Development, the Association of Southeast Asian Nations, BRICs, and some African countries) [26].
The calculation process involves four steps. First, one calculates the per capita annual con-sumption of the main resources with Eq (1):
Ci ¼ ðPiþIi EiÞ=pi ð1Þ
where,iis the consumption item,Ci(kg) is annual per capita consumption,Pi(kg) is annual
production,Ii(kg) is annual imports,Ei(kg) is annual exports, andpiis population.
Second, the yield factorsyjand equivalence factorsejare imported (Table 1). Based on net
primary productivity (NPP) from MODIS data with 1km resolution in 2001 and areas of differ-ent land-use types, Liu calculated yield factors at provincial level in China [27]. In this paper, we use specific yield factors that reflect ecosystem productivities in Fujian Province. This factor enables the comparison among all the types of biologically productive land. Equivalence factors were introduced by Wackernagel in 1999 in order to making biologically productive lands more comparable among different regions [28]. This factor is the average ratio of the produc-tion of a certain biologically productive land and that of the same land on a global scale.
Next, the per capita ecological footprint (PEF) and per capita biocapacity (PBC) are calcu-lated with Eqs2–4. In addition, 12% of the total land use is set aside for biodiversity protection [29,30].
aai¼Ci=Wi ð2Þ
PEF¼Xðej
X
aaiÞ ð3Þ
PBC¼ ð1 0:12Þ XðajyjejÞ ð4Þ
where,aai(ha) is the per capita actual biologically productive land of itemi,Wi(kg/ha) is the
yield of itemi, PEF (ha) is the per capita ecological footprint, PBC (ha) is the per capita bioca-pacity,jis the type of biologically productive land, andaiis the total area of a type of
biologi-cally productive land.
Finally, the ecological surplus and ecological deficit are calculated. If the value of PBC is larger than PEF, this biologically productive land exhibits an ecological surplus. Otherwise, it exhibits an ecological deficit.
We collected data to evaluate LCC for Xiamen City between 2000 and 2012. EFA calculation requires detailed resource data, including biotic resources (12 items) and energy (9 items), and all the data can be found in the yearbooks of the Xiamen Special Economic Zone (2000–2012) and other references (Table 2).
Table 1. The values of yield factors and equivalence factors of different land-use types [27–28].
Land-use types Yield factors Equivalence factors
Arable land 1.01 2.8
Forest land 1.57 1.1
Pasture land 3.17 0.5
Fishery ground 3.17 0.2
Built-up land 1.01 2.8
Fossil energy land 0 1.1
Index System Method
As ISM can reflect various features of an evaluated object simultaneously, we developed a framework of the fuzzy comprehensive evaluation model that covers all the basic information and main characteristics of land and human activities [31]. To simplify the description of com-plex parameters, indices ofC1toC20are substituted for the factors (Table 3). Those parameters mentioned above are categorized into three main headings: land social-developmental carrying capacity (B1), land ecological-environmental carrying capacity (B2) and land economic-pro-ductive carrying capacity (B3).
The calculation of ISM also involves four steps. The first step is to select indicators. Each index should reflect the corresponding characteristics of a subsystem. Frequency analysis is adopted to pick out and filter indicators by referencing to related literature, and satisfactory indicators are chosen on the basis of theoretical analysis. Moreover, to strengthen practicabil-ity, we take those indicators that frequently appear in appraisal modules of cities (e.g., indica-tors of National Model City for Environmental Protection) and apply the following selection principles: (1) inclusive relations, repeatability, and intersectionality are avoided; (2) represen-tative indicators are first taken into account; i.e., indicators that can reflect the primary prob-lems between sustainable land resource usage and social economic development; (3) selected Table 2. Land-use classification and consumption items.
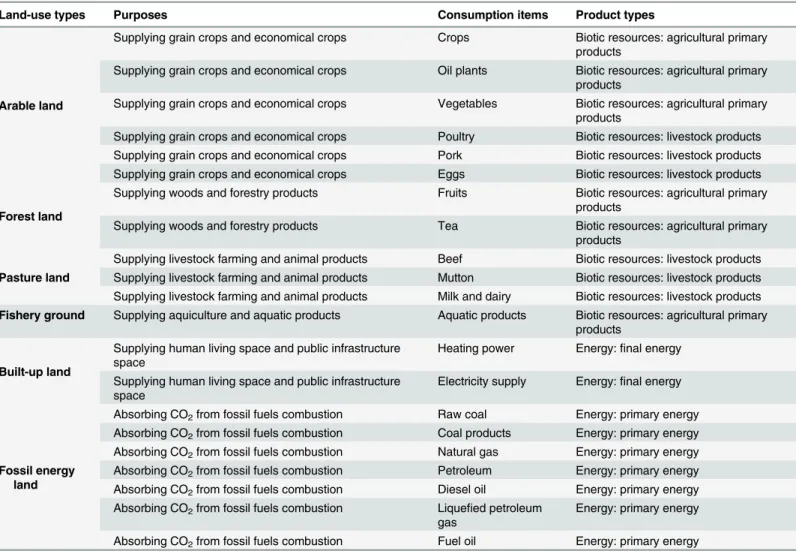
Land-use types Purposes Consumption items Product types
Arable land
Supplying grain crops and economical crops Crops Biotic resources: agricultural primary products
Supplying grain crops and economical crops Oil plants Biotic resources: agricultural primary products
Supplying grain crops and economical crops Vegetables Biotic resources: agricultural primary products
Supplying grain crops and economical crops Poultry Biotic resources: livestock products Supplying grain crops and economical crops Pork Biotic resources: livestock products Supplying grain crops and economical crops Eggs Biotic resources: livestock products
Forest land
Supplying woods and forestry products Fruits Biotic resources: agricultural primary products
Supplying woods and forestry products Tea Biotic resources: agricultural primary products
Pasture land
Supplying livestock farming and animal products Beef Biotic resources: livestock products Supplying livestock farming and animal products Mutton Biotic resources: livestock products Supplying livestock farming and animal products Milk and dairy Biotic resources: livestock products
Fishery ground Supplying aquiculture and aquatic products Aquatic products Biotic resources: agricultural primary products
Built-up land
Supplying human living space and public infrastructure space
Heating power Energy:final energy
Supplying human living space and public infrastructure space
Electricity supply Energy:final energy
Fossil energy land
Absorbing CO2from fossil fuels combustion Raw coal Energy: primary energy
Absorbing CO2from fossil fuels combustion Coal products Energy: primary energy
Absorbing CO2from fossil fuels combustion Natural gas Energy: primary energy
Absorbing CO2from fossil fuels combustion Petroleum Energy: primary energy
Absorbing CO2from fossil fuels combustion Diesel oil Energy: primary energy
Absorbing CO2from fossil fuels combustion Liquefied petroleum
gas
Energy: primary energy
Absorbing CO2from fossil fuels combustion Fuel oil Energy: primary energy
indicators are adjusted according to local conditions (e.g., resources, environment, and regional differentiation) [32].
The second step is to identify the criterion of this system. A standard grading is applied to categorize the scores into five value groups between 0 and 1, which represent different ranks [33]. A higher value corresponds to stronger LCC, which means that each subsystem has better LCC conditions and the degree of coordination between subsystems is higher (Table 4). In terms of social development, if the value approaches 1, then the level of technology, Table 3. ISM framework for assessing LCC.
Criterion layer B Index layer C Index
types
Justification
Land social-developmental carrying capacity,B1
Population density,C1 negative Higher rate, more crowed. Employment rate,C2 positive Higher rate, more stable of society.
Engel coefficient,C3 negative Residents’living standard<40%, rich;>60%, poor (Food and Agriculture Organization).
Residential land use rate,C4 positive Higher rate, more space for living.
Year-end road area,C5 positive Higher rate, more extensive infrastructure construction. Per capita arable land,C6 positive Higher rate, less pressure between population and crop
yields.
Urbanization rate,C7 positive Higher rate, higher degree of urbanization.
Land ecological-environmental carrying capacity,B2
Green coverage,C8 positive Higher rate, higher degree of urban greening. Comprehensive utilization of industrial
solid wastes,C9
positive Higher rate, fewer problems of environmental pollution and human security.
Urban industrial wastewater discharge compliance rate,C10
positive Higher rate, fewer problems of water pollution.
Environmental investment index,C11 negative Higher rate, fewer environmental problems to be solved. Centralized sewage treatment rate,C12 positive Higher rate, higher degree of ability on sewage treatment. Hazard-free treatment rate of household
garbage,C13
positive Higher rate, more garbage being disposed.
Land economic-productive carrying capacity,B3
GDP,C14 positive Higher rate, higher standard of economic development. Industrial output,C15 positive Higher rate, higher degree of industrial enterprise
development.
Proportion of tertiary industry,C16 positive Higher rate, more optimized of industrial structure and advanced of science and technology.
Total retail sales of social consumer goods,C17
positive Higher rate, higher purchasing power of commodities and larger scale of retail market.
Intermediate consumption in of primary industry,C18
negative Higher rate, less consumption of products and service during producing and operating.
Energy consumption per unit industrial added value,C19
negative Higher rate, fewer energies being consumed in industrial activities.
Effective irrigation area of arable land ratio,C20
positive Higher rate, higher degree of intensive water utilization in agricultural activities.
doi:10.1371/journal.pone.0130315.t003
Table 4. A grading standard of LCC.
Score interval Classification
0.8–1 Strongest
0.6–0.8 Strong
0.4–0.6 Medium
0.2–0.4 Weak
0–0.2 Weakest
popularization of education, rate of employment, quality of life, and coverage of public utilities will have a high standard. With regard to the ecological environment, if the value approaches 1, the ecosystem becomes stable to the point where it scarcely suffers damages from human activ-ities, and cities have strong abilities to accommodate pollutants caused by mankind; in addi-tion, people have a high pollution management efficiency and a low investment in
environmental protection. As for economic productivity, when the value nears 1, human pro-ductivity and consumption have low carbon emissions. In addition, the layout and pattern of urban land use tends to be optimal at this point. Lower values correspond to weaker LCC.
The third step is to normalize the indicators. We assume that there aremindicators, where, Ci(1im), andnschemes, whereBj(1jn), which constitute a judgement matrixX=
(Xij)n×m. All of the indicators can be divided into two categories, positive indicators and
nega-tive indicators. Higher property values correspond to better conditions for posinega-tive indicators, whereas lower property values correspond to better conditions for negative indicators. After a dimensionless transformation, all the indicators become positive, and the decision matrix becomes dimensionless, that is,Y= (Yij)n×m. The attribute-based data are normalized by the
method of maximum and minimum values, which converts all the variables into dimensionless numbers; the value ofYijis between 0 and 1, where 1 is the optimal value and 0 is the inferior
value. Eqs5and6are as follows. For positive indicators,
Yij¼
Xij min 1imXij max
1imXij min 1im Xij
ð1im;1jnÞ ð5Þ
For negative indicators,
Yij¼ max
1im Xij Xij max
1im Xij min 1im Xij
ð1im;1jnÞ ð6Þ
where,Yijis the normalized value,Xijis the original value, maxXijis the original maximum
value, and min Xijis the original minimum value.
The next step is to assign weights to the coefficients. In ISM, the weights greatly contribute to the calculation. Here we use the method of mean squared error (MSE), which can reflect the discrete degree of random variables and is calculated with Eqs7–9. The last step is to evaluate the integrated LCC, as shown inEq 10.
Ej ¼ 1
n
Xn
i¼1Yij ð7Þ
sðE jÞ ¼
ffiffiffiffiffiffiffiffiffiffiffiffiffiffiffiffiffiffiffiffiffiffiffiffiffiffiffiffiffiffiffiffi
Xn
i¼1ðYij EjÞ 2 r
ð8Þ
Wj¼
sðEjÞ
Xn
i¼1
sðE jÞ
ð9Þ
Fi¼
Xn
i¼1YijWj ð10Þ
where,Ej is the average value of a random variable,σ(Ej) is MSE,Wjis the weight coefficient,
The data used for ISM calculation consists of 20 indicators that are divided into 3 categories and can be found from the yearbooks of the Xiamen Special Economic Zone (Table 3).
Results
Ecological deficit situation reflected with EFA
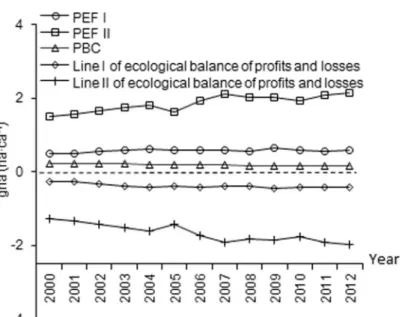
The total PBC decreased from 0.23 haca-1in 2000 to 0.16 haca-1in 2012 (Fig 1). Among the six land categories, arable land experienced the sharpest reduction in PBC (from 0.07 to 0.03 haca-1over the 13 years). The total PEF increased from 1.49 to 2.12 haca-1between 2000 and 2012 (Fig 2). The PEF of fossil energy dominated the overall PEF and also experienced an Fig 1. PBC of five biologically productive land types between 2000 and 2012 in Xiamen City.
doi:10.1371/journal.pone.0130315.g001
Fig 2. PEF of six biologically productive land types between 2000 and 2012 in Xiamen City.
increase (from 1.00 to 1.54 haca-1between 2000 and 2012). The line II of the ecological balance of profits and losses in Xiamen City declined from -1.26 to -1.96 haca-1over the 13-year period
(Fig 3). When excluding fossil energy land, PEF I exhibits almost no change, and line I of the
ecological balance of profits and losses remains stable.
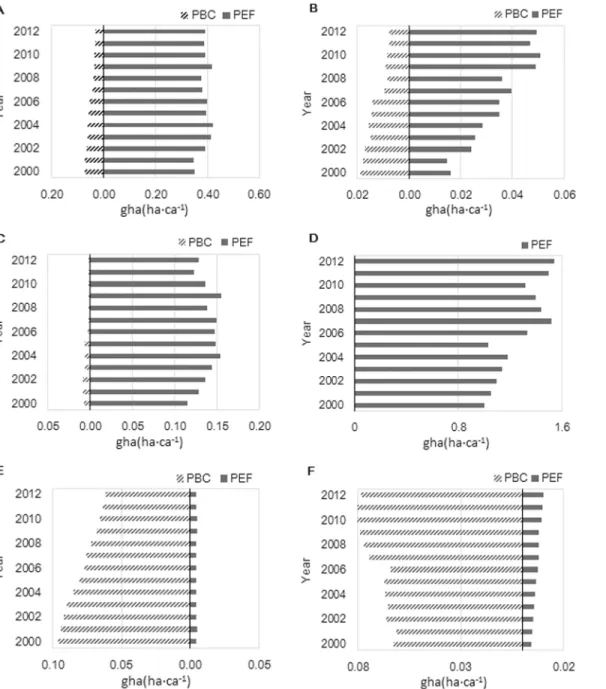
Four land-use types, including arable land, pasture land, fishery ground, and fossil energy land, had ecological deficit whereas the other two, including forest land and built-up land had ecological surplus (Fig 4). The temporal trends in ecological deficit/surplus were different among the six land-use types: the ecological deficits were getting greater over time for the four land-use types; the ecological surplus of forest land was getting smaller as its supply was declin-ing; the surplus of built-up land was increasing because of faster increases in its supply (i.e., urbanization) than its demand.
The dynamics trends in areas and intensity of the six biologically productive lands are diverse (Figs5and6). Between 2000 and 2012, arable land lost 0.04 haca-1of PBC and had the same growth of PEF. Pasture land lost 0.01 haca-1of PBC, and had a growth of 0.03 haca-1in PEF, and exhibited an annual increasing rate of 15% in PEF, which represented the highest change among all land categories. The supply of fishery grounds decreased to 0.007 haca-1 during these years, but the intensity of PBC decreased by 6.9% annually. Built-up land was the only one that exhibits area gains in PBC, meaning that the supply of built-up land increased. However, annual PEF intensity of built-up land increased by 10.6% but its annual PBC inten-sity decreased only by 1.9%. The PEF of fossil energy land increased to 0.54 haca-1in area and increased 4.1% in annual intensity. Fossil energy showed modest change intensity but a tre-mendous change in area gains, indicating that fossil energy land has been in high demand from 2000 to 2012 and exhibits an upward trend over time.
Sustainability status revealed with ISM
The ISM-based LCC evaluation showed different results. The resulted weights of criterion lay-ers ranked as follow:B1>B3>B2(Table 5). As for the index weight, residential land use rate Fig 3. Ecological balance of profits and losses between 2000 and 2012 in Xiamen City.Energy footprint was not calculated in PEF I and line I of the ecological balance of profits and losses but in PEF II and line II of the ecological balance of profits and losses.
(C4) and per capita arable land (C6) contributed to a high proportion ofB1. The hazard-free treatment rate of household garbage (C13) largely contributes toB2and the environmental investment index (C11) contributes to it the least. The energy consumption per unit industrial added value (C19) contributes toB3, and the other factors are almost equal contributions.
Assuming every index follows a linear change over time, we made linear extrapolations to project its future values in 2015, 2020, and 2030, respectively (Table 5). Except forC1andC6 (distributed inB1) andC18andC20(distributed inB3), the values of the remaining 16 indicators become higher with time and approach 1 in 2030.
Fig 4. PBC and PEF of six biologically productive land types between 2000 and 2012 in Xiamen City.(A) Arable land; (B) Pasture land; (C) Fishery ground; (D) Fossil energy land; (E) Forest land; (F) Built-up land.
The three subsystems all presented a rising trend in general, and the average increase rate ranked asB2>B3>B1(Fig 7). In 2000,B1was 0.11,B2was 0.10, andB3was 0.07. The value of B2has increased distinctly since 2007 and it is predicted to grow continuously.B1had the high-est value in the first five years but would become the lowhigh-est in the future. In contrast,B3had relatively steady increases over time.
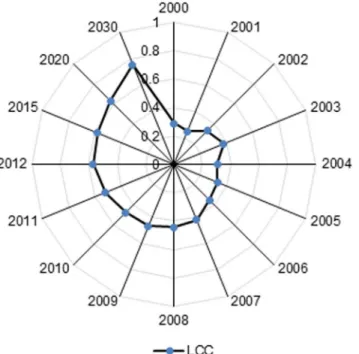
These results show that LCC has experienced a continual increase between 2000 and 2012
(Fig 8). Furthermore, LCC is predicted to rise between 2015 and 2030 in Xiamen City. In the
past, the average index value was 0.382, which indicating a“weak”carrying capacity, and the annual growth rate accounted for 7.3%. By 2012, the level of LCC has become“medium”, and the carrying conditions had slightly improved so that the average score was 0.58. Moreover, LCC is predicted to reach“strong”, with a value of 0.629 in 2020 and 0.758 in 2030.
Fig 5. Change in area of six biologically productive land types between 2000 and 2012 in Xiamen City.
doi:10.1371/journal.pone.0130315.g005
Fig 6. Annual change in intensity of six biologically productive land types between 2000 and 2012 in Xiamen City.
Discussion
Limiting factors in sustainable development for Xiamen City
The EFA-based assessments explain that Xiamen City has experienced a constant ecological deficit between 2000 and 2012, representing a major challenge in its sustainable development. Table 5. Index weights and normalized values (NV) of ISM.
Criterion layer (weight) Index (Index weight) NV(2000) NV(2005) NV (2012) NV (2015) NV (2020) NV(2030)
B1(0.339)
C1(0.046) 1 0.861 0.621 0.519 0.345 0
C2(0.051) 0.090 0.099 0.553 0.470 0.647 1
C3(0.041) 0 0.315 0.432 0.550 0.700 1
C4(0.052) 0.025 0.641 0.398 0.373 0.542 0.880
C5(0.048) 0 0.081 0.401 0.473 0.649 1
C6(0.052) 1 0.532 0.283 0.270 0.101 0
C7(0.049) 0 0.273 0.675 0.707 0.767 1
B2(0.328)
C8(0.047) 0.082 0.147 0.450 0.495 0.663 1
C9(0.048) 0.265 0.433 0.820 0.851 0.911 1
C10(0.063) 0.868 0 0.917 0.936 0.957 1
C11(0.043) 0.611 0.376 0.535 0.548 0.592 1
C12(0.059) 0.075 0.450 0.805 0.847 0.932 1
C13(0.068) 0 0.237 0.884 0.942 0.977 1
B3(0.333)
C14(0.044) 0 0.030 0.139 0.212 0.374 1
C15(0.047) 0 0.129 0.436 0.483 0.655 1
C16(0.047) 0.114 0.036 0.311 0.571 0.643 1
C17(0.048) 0 0.077 0.416 0.470 0.646 1
C18(0.048) 0.950 0.681 0.451 0.486 0.324 0
C19(0.052) 0 0.259 0.704 0.759 0.852 1
C20(0.047) 0.492 1 0.719 0.418 0.337 0.037
doi:10.1371/journal.pone.0130315.t005
Fig 7. The social-development, ecological-environmental, and economic-productive land carrying capacity between 2000 and 2030 in Xiamen City.
In this case, arable land made the highest contribution to the decline in overall PBC, and fossil energy land made the highest contribution to the rise in overall PEF for Xiamen City between 2000 and 2012. The energy footprint was the major cause of the ecological deficit. There are two major reasons that lead to the current high energy footprint. One is that there were limited energy sources but large energy consumptions in Xiamen City. Another is that the built-up area has increased tremendously between 2000 and 2012, which would trigger the increase in energy demand. Thus, it is important for the local policy makers to pay extra attention to con-trol fossil energy consumption, protect arable land and forest land from converting into other land types, and reduce the speed of urbanization.
For ISM-based assessment, the integrated LCC increased continuously between 2000 and 2012, showing a good trend and well balance among social development, environmental treat-ment and economic growth. The in-depth analysis of the three factors of LCC reveals that eco-logical-environmental carrying capacity has experienced the greatest growth since 2006. This growth was the result of efforts Xiamen citizens and policy makers have made in ecological res-toration and environmental protection, which was revealed by the indices of green coverage, the treatment of sewage, and the treatment of household garbage. On the contrary, the increas-ing population and decreasincreas-ing arable land have contributed to the decline in social-develop-ment land carrying capacity between 2002 and 2008. In order to maintain social developsocial-develop-ment, rural-to-urban immigration policy and arable land protection policy need to be strengthened.
Suitability of EFA and ISM for LCC assessment
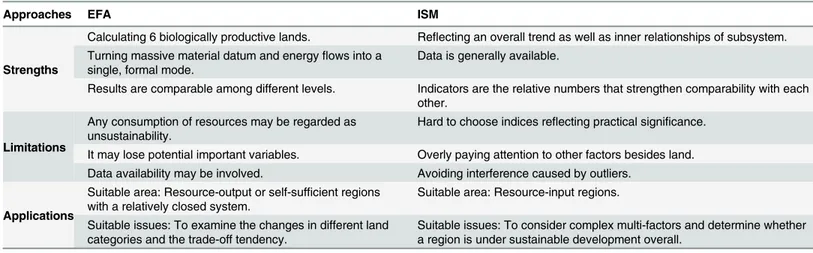
As LCC is a criterion that measures whether the region maintains sustainable development, it can be used to assist policy makers in urban land planning. The suitability of EFA and ISM for LCC assessment is worth discussing for various applications (Table 6).
Fig 8. The integrated land carrying capacity between 2000 and 2030 in Xiamen City.LCC values calculated with ISM were used to assess the current situation and project the prospective state via linear extrapolation. The integrated value in each year also corresponds to the grading standard presented in
Table 5.
EFA focuses on accessing whether an ecosystem is impacted negatively in the process of human production and consumption. EFA enables to estimate the carrying capacity of differ-ent biologically productive lands simultaneously, as well as characterize the dynamic processes of carrying capacity over time. The concept is quite simple and can be intuitively understood by ordinary people, managers and organizations [34]. In addition, the calculation of EFA is unified by integrating real data on massive material and energy flows into a single, formal mode. The results of EFA are comparable. EFA can show not only the level of LCC by ing local states with the average national state, but also can reveal the level of LCC by compar-ing the national situation with the average worldwide situation. As a result, we may measure the conditions of national sustainable development and local lifestyles [35].
However, there are still weaknesses when using EFA for LCC assessment. EFA is a single aggregate static system [36]. Due to this limitation in calculation, any consumption of resources would be regarded as unsustainable from the viewpoint of the ecological footprint [25]. In addition, there are no consideration of other potential important variables for ecologi-cal services and resources consumption in the ecologi-calculation, which may reduce the accuracy of the calculations [37]. The reliability of the results is closely related to the information availabil-ity. In our case study, there is a possibility of underestimating LCC with EFA. This underesti-mating resulting from that fossil energy land is a hypothetical land rather than a real one; thus, there is only a demand for it and no supply in the calculation. However, the calculation neglects the absorption of CO2by other land types in accordance with the principle of space mutual exclusiveness, and this may lower the biocapacity. For instance, forest lands’considerable capacity for CO2assimilation is ignored based on the exclusive land ecological function adopted by the EFA, which only considers the supply of wood and other forestry products.
There are four merits of ISM for LCC assessment. Firstly, the results can reflect an overall trend as well as inner relationships of social development, environmental treatment, and eco-nomic growth subsystem. Secondly, all of the required data can be easily found in statistical yearbooks. However, EFA is more suitable to assess self-reliant regions within a closed system, such as islands [38]. Thirdly, relative values (e.g., percentage, growth rate, per capita, etc.) instead of real values are used to describe each index, which make the three subsystems are compatible [39].
Table 6. Suitability of EFA and ISM for LCC assessment.
Approaches EFA ISM
Strengths
Calculating 6 biologically productive lands. Reflecting an overall trend as well as inner relationships of subsystem. Turning massive material datum and energyflows into a
single, formal mode.
Data is generally available.
Results are comparable among different levels. Indicators are the relative numbers that strengthen comparability with each other.
Limitations
Any consumption of resources may be regarded as unsustainability.
Hard to choose indices reflecting practical significance.
It may lose potential important variables. Overly paying attention to other factors besides land. Data availability may be involved. Avoiding interference caused by outliers.
Applications
Suitable area: Resource-output or self-sufficient regions with a relatively closed system.
Suitable area: Resource-input regions.
Suitable issues: To examine the changes in different land categories and the trade-off tendency.
Suitable issues: To consider complex multi-factors and determine whether a region is under sustainable development overall.
The weakness of ISM is that the indices have weak practical significance, making the meth-odology lack persuasiveness. In addition, ISM pay too much attention to the factors such as liv-ing quality, environmental pollution and governance, economic growth, et al, which leads to the ignoring of direct land carrying capacity. Additionally, if outliers are present, it may draw false conclusions. For example, when values of one subsystem are extremely low but values of two other subsystems are large, the integrated value may be greater than the actual value. Another limitation of ISM is that LCC may be overestimated with ISM.
Conclusions
EFA and ISM are both useful to evaluate LCC but each has special suitability depending on the region of application and the demands of policy makers. ISM is more suitable to resource-input regions, while EFA is appropriate for resource-output or self-sufficient regions. If policy makers wish to consider complex multi-factors, including social development, ecosystem health, and economic growth, in determining whether a region abides by sustainable develop-ment, ISM is more appropriate [40,41]. However, if they wish to investigate the effects of dif-ferent land categories on LCC, EFA is more suitable. In order to take full advantage of these two approaches, the combined use of them may be ideal to evaluate LCC.
The case study in Xiamen City demonstrates that LCC assessments with EFA and ISM are not only complement each other but also are mutually supportive. The decreasing supply of arable land has lowered PBC (assessed with EFA), and also reduced land social-developmental carrying capacity (assessed with ISM). These two assessments have proved that a decrease in arable land has negative effects on LCC for Xiamen City. In addition, high energy consumption has resulted in a low intensity of PEF (assessed with EFA) and a high value of energy consump-tion per unit industrial added value (assessed with ISM). Therefore, it is important to protect arable land and improve the efficiency of fossil energy for the purpose of promoting LCC in Xiamen City.
The situation of LCC in Xiamen City needs to be improved and major efforts have to be made jointly by policy makers, planners and designers [42]. From the viewpoint of reducing ecological deficits, it is important to control fossil energy consumption, protect arable land and forest land from converting into other land types, and reduce the speed of urbanization in Xia-men City; from the viewpoint of promoting sustainability, it is critical to maintain social devel-opment through controlling rural-to-urban immigration, protect the environment by
increasing hazard-free treatment rate of household garbage, and promote economic growth while raising energy consumption per unit industrial added value.
Author Contributions
Conceived and designed the experiments: YQ LT. Performed the experiments: YQ. Analyzed the data: YQ QQ TX JL. Wrote the paper: YQ LT.
References
1. World Wild Fund for Nature (2012) China ecological footprint report 2012: Consumption, production and sustainable development. Available:http://www.wwfchina.org/content/press/publication/ footprint2012en.pdf. Accessed 25 September 2014.
2. World Wild Fund for Nature (2010) China ecological footprint report 2010: Ecological carrying capacity, cities and development. Available:http://www.wwfchina.org/content/press/publication/2010LPR_cn. pdf. Accessed 25 September 2014.
4. Lan DD, Wei SQ, Chen ZQ (2007) Primary study of carrying capacity of urban land resources–Fuzhou as a case. Journal of Shenyang Normal University (Natural Science) 25: 252–256.
5. Chen BM (1991) An outline of the research method of the project“the productivity and population carry-ing capacity of the land resource in China”. Journal of Natural Resources 6: 197–205.
6. Irmi S, Clem AT (1999) Carrying capacity reconsidered: from Malthus’population theory to cultural car-rying capacity. Ecological Economics 31: 395–408.
7. Malthus TR (1986) An essay on the principle of population [1st ed. of 1798]. London.
8. Vogt W (1948) Road to survival. W. Sloane Associates. 335p.
9. Liu XL, Cao AX (2008) Characteristics and conversation of land ecological functions. Environmental science and management 33: 54–57.
10. Shi YS, Wang HF, Yin CY (2013) Evaluation method of urban land population carrying capacity based on GIS–A case of Shanghai, China. Computers, Environment and Urban System 39: 27–38.
11. Kessler JJ (1994) Usefulness of human carrying capacity concept in assessing ecological sustainability of land-use in semi-arid regions. Agriculture, Ecosystems and Environment 48: 273–284.
12. Komatsu Y, Tsunekawa A, Juc H (2005) Evaluation of agricultural sustainability based on human carry-ing capacity in drylands–a case study in rural villages in Inner Mongolia, China. Agriculture, Ecosys-tems and Environment 108: 29–43.
13. FAO Subregional Office for Southern and East Africa Harare (2004) Drought impact mitigation and pre-vention in the Limpopo River Basin. Available:http://www.fao.org/docrep/008/y5744e/y5744e00. htm#Contents. Accessed 2014 Sept 25.
14. Kitzes J, Galli A, Bagliani M, Barrett J, Dige G, Ede S, et al. (2009) A research agenda for improving national ecological footprint accounts. Ecological Economics 68: 1991–2007.
15. Wackernagel M, Schulz NB, Deumling D, Linares AC, Jenkins M, Kapos V, et al. (2002) Tracking the ecological overshoot of the human economy. PNAS 99: 9266–9271. PMID:12089326
16. Rees WE (2001) Ecological footprint, concept of Encyclopedia of biodiversity 2: 229–244.
17. Mcmanus P, Haughton G (2006) Planning with ecological footprints: a sympathetic critique of theory and practice. Environment and Urbanization 118: 113–127
18. Moore J, Kissinger M, Rees WE (2013) An urban metabolism and ecological footprint assessment of Metro Vancouver. Journal of Environmental Management 124: 51–61. doi:10.1016/j.jenvman.2013. 03.009PMID:23603775
19. Blomqvist L, Brook BW, Ellis EC, Kareiva PM, Nordhaus T, Shellenberger M (2013) Does the shoe fit? Real versus imagined ecological footprints. PLoS Biology 11, e1001700. doi:10.1371/journal.pbio. 1001700PMID:24223517
20. Ma HB, Chang WJ, Cui GB (2012) Ecological footprint model using the support vector machine tech-nique. PLoS One 7: e30396. doi:10.1371/journal.pone.0030396PMID:22291949
21. Wei C, Guo ZY, Wu JP, Ye SF (2014) Constructing an assessment indices system to analyze inte-grated regional carrying capacity in the coastal zones–A case in Nantong. Ocean & Coastal Manage-ment 93: 51–59.
22. Tang LN, Zhao Y, Yin K, Zhao J (2013) City Profile: Xiamen Cities. 31: 615–624.
23. Baglini M, Galli A, Niccolucci V, Marchettini N (2008) Ecological footprint analysis applied to a sub-national area: The case of the Province of Siena(Italy). Journal of Environmental management 86:354–364. PMID:17110019
24. Liu LW (2012) Evaluation of ecological carrying capacity based on ecological footprint model in Harbin, electronic, scholarly journal. M.Sc. Thesis, Northeast Agricultural University, Available:http://www.cnki. net/KCMS/detail/detail.aspx?QueryID=1&CurRec=1&recid=&filename=1012515390. Accessed 2014 Sept 25.
25. Hopton ME, White D (2012) A simplified ecological footprint at a regional scale. Journal of environmen-tal management 111: 279–286. doi:10.1016/j.jenvman.2011.07.005PMID:22033065
26. World Wild Fund for Nature (2014) Ecological footprint and sustainable consumption in china. Avail-able:http://www.wwfchina.org/content/press/publication/2014/EN2014footprint.pdf. Accessed 2014 Sept 25.
27. Liu MC, Li WH, Xie GD (2010) Estimation of China ecological footprint production coefficient based on net primary productivity. Chinese Journal of Ecology 29: 592–597.
28. Wackernagel M, Onisto L, Bello P, Linares AC, Falfán ISL, García JM, et al. (1999) National natural capital accounting with the ecological footprint concept. Ecological Economics 29: 375–390.
30. Wackernagel M, Rees WE (1996) Our ecological footprint: Reducing human impact on the earth. New Society Publisher, Gabriola Island, Canada. 179p.
31. Qiu DD, Zhang JL (2011) Urban residential land suitability index system and its comprehensive evalua-tion- a case study of Wenzhou. Procedia Engineering 21: 439–445.
32. Xia CY, Yan JM (2006) Indicator system of implementation evaluation for land use planning. China Land Science 20: 19–23.
33. Guo ZW (2008) Comprehensive Evaluation on Land Resources Carrying Capacity for Beijing City. Urban Studies 15: 24–30.
34. Rees WE (2000) Eco-footprint analysis: merits and brickbats. Ecological Economics 32: 371–374.
35. Bagliani M, Galli A, Niccolucci V, Marchettini N (2008) Ecological footprint analysis applied to a sub-national area: the case of the Province of Siena (Italy). Journal of environmental management 86: 354–364. PMID:17110019
36. Fiala N (2008) Measuring sustainability: Why the ecological footprint is bad economics and bad envi-ronmental science. Ecological Economics 67: 519–525.
37. Rees WE (2013) Ecological footprint, concept of. Encyclopedia of Biodiversity (Second Edition) 701–
713.
38. Zhu Y (2007) Study on the integrated assessment system of land resources carrying capacity for Chongming Island, electronic, scholarly journal. M.Sc. Thesis, East China Normal University. Available:
http://www.cnki.net/KCMS/detail/detail.aspx?QueryID=6&CurRec=1&recid=&filename=2007080830. Accessed 2014 Sept 15.
39. Wang SH, Mao AY (2001) Design and evaluation on the indicator system of land comprehensive carry-ing capacity. Journal of natural resources 16: 248–254.
40. Zhao JZ, Zheng XC, Dong RC, Shao GF (2013) The planning, construction, and management toward sustainable cities in China needs the Environmental Internet of Things. International Journal of Sustain-able Development & World Ecology 20: 195–198.
41. Zhao JZ, Cui SH, Yan CZ, Guo QH (2009) Theoretical thinking of sustainable city construction of China. Chinese Journal of Environmental Science 30: 1244–1248.
![Table 1. The values of yield factors and equivalence factors of different land-use types [27–28].](https://thumb-eu.123doks.com/thumbv2/123dok_br/18157034.328308/4.918.296.866.912.1047/table-values-yield-factors-equivalence-factors-different-types.webp)