American Journal of Engineering Research (AJER)
e-ISSN: 2320-0847 p-ISSN : 2320-0936
Volume-5, Issue-7, pp-193-201
www.ajer.org
Research Paper Open Access
w w w . a j e r . o r g
Page 193
Status Check of the Mining Hub of India: Examining the
Land-Use Pattern Observed in the Forest
–
Agricultural Ecosystem of
Dhanbad
Zareena Begum Irfan
a,*, Anu Anna Jo
band Mohana Mondal
ca,
Associate Professor, Centre of Excellence in Environmental Economics, Madras School of Economics, Gandhi Mandapam Road, Chennai – 600025, Tamil Nadu, India
b, c Research Associate, Centre of Excellence in Environmental Economics, Madras School of Economics, Gandhi Mandapam Road, Chennai – 600025, Tamil Nadu, India
ABSTRACT
:
This paper focuses on the ecosystem based hotspot identification and the pattern of land use change in Forest-agricultural Ecosystem using the land use dynamic degree model. Geological Information on the agricultural ecosystem is obtained by the remote sensing images for the identification of land change. Ecosystem wherein both the agricultural and forest ecosystem coexist is known as forest-agricultural ecosystem. Area is based on the agricultural activities and the forest ecosystem. Hotspot is selected based on the intersection of anthropogenic activities like mining with the forest and agricultural ecosystem. With this hotspot identification it brings a clear picture of how to look into a new definition of hotspots, which identifies a region or specific area and how each area could be identified as a hotspot. Geographic Information System images were used to analyze the changes in land over specific time period.I.
INTRODUCTION
Population and challenges in the ecosystem hotspot has been of long-standing interest to ecologists. Over the past years the subject has been researched in various ways, like identification of various areas of biodiversity using different methods, measuring the overlap of human poverty and ecosystem hotspots, spatial patterns and economic contributions of mining and tourism in biodiversity hotspots. With an increase in the population in the Indian hotspot region, population and challenges in the region is unclear. Estimates of Myers. et al(2000) show that in 1995 more than 1.1 billion people, nearly 20% of world population, were living within the hotspots, an area covering about 12% of Earth's terrestrial surface. Population growth rate in the hotspots (1995-2000) is 1.8% yr-1, substantially higher than the population growth rate of the world as a whole (1.3% yr-1) and above that of the developing countries (1.6% yr-1) . These results suggest that substantial human-induced environmental changes are likely to continue in the hotspots and that demographic change remains an important factor in global biodiversity conservation. Biodiversity hotspots face tremendous anthropogenic pressure resulting in forest destruction and species extinction. This is mainly because of the rising human population in the hotspot region.
Dhanbad was one of the chief mining districts for the past 30 years. So gradual changes or impacts were only observed in land use change. During the three sub periods of observation high increase in building zone and increase in scrub/ fallow land were observed because of the newly formed Jharkhand giving opportunities/new project establishments at all levels of infrastructural development. Few multinational coal exploratory organisations were established in Dhanbad after the city became the part of the new state, attracting high revenue at the price of high degradation.
1.1 Objective of the Study
w w w . a j e r . o r g
Page 194
program. India rich in its flora and fauna and with a characteristic of increasing population is an appropriate site for the study.
II.
LITERATURE REVIEW
Population and challenges in the ecosystem hotspot has been of long-standing interest to ecologists. Over the past years the subject has been researched in various ways, like identification of various areas of biodiversity using different methods, measuring the overlap of human poverty and ecosystem hotspots, spatial patterns and economic contributions of mining and tourism in biodiversity hotspots. With an increase in the population in the Indian hotspot region, population and challenges in the region is unclear, hence my study stands relevant.
A landmark paper that deals with biodiversity by Myers (2000), entitled “Biodiversity hotspots for conservation priorities” developed a strategy for prioritizing areas of biodiversity by providing a ranking of hotspots in order to assist planners in the face of insufficient funding. The authors focused their analysis on and defined „hotspots‟ as areas having “exceptional concentrations of endemic species and experiencing exceptional loss of habitat”. They defined 25 original hotspots, but this list was recently expanded to 34 hotspots and has become the major focus of Conservation International's (CI) work. By focusing on these hotspots, the authors estimate it may be possible to protect 44% of all vascular plant species and 35% of 4 major vertebrate groups in only 1.4% of the earth's surface. This was, and continues to be, an important and timely effort due to the growing evidence of human driven ecosystem degradation and species loss (Vitousek, 1997). While it is an excellent endeavour to help prioritize funding for conservation, their paper does not address the fact that the success of conservation initiatives is largely dependent on the socio-economic conditions of the areas where these hotspots occur.
Paper by Cincotta (2000), entitled “Human population in the biodiversity hotspots” estimated of key demographic variables for each hotspot, and for three extensive tropical forest areas that are less immediately threatened. They estimated that in 1995 more than 1.1 billion people, nearly 20% of world population, were living within the hotspots, an area covering about 12% of Earth's terrestrial surface. They estimated that the population growth rate in the hotspots (1995-2000) is 1.8% yr(-1), substantially higher than the population growth rate of the world as a whole (1.3% yr(-1)) and above that of the developing countries (1.6% yr(-1)). These results suggest that substantial human-induced environmental changes are likely to continue in the hotspots and that demographic change remains an important factor in global biodiversity conservation. The results also underline the potential conservation significance of the continuing worldwide declines in human fertility and of policies and programs that influence human migration.
Dynamics and interactions between mining and tourism were discussed by Huang, Zhou, Ali (2011). This paper examined how mining and tourism industry interact in terms of their economic contributions and spatial patterns in a biodiversity hotspot, Yunnan, China. Studies showed nearly one third of active mines and exploration sites are within areas of intact ecosystems or high conservation value (e.g. Miranda, 2003). The negative impacts associated with mining include land degradation, ecosystem disruption, and negative impacts on the local community (i.e. sexually-transmitted diseases) (The World Bank, 2004). The negative impacts of tourism include land degradation, water pollution, waste and noise brought by tourists, and overwhelming pristine cultures by the modern lifestyle (Butter, 1980). Both mining and tourism have been recognized for their positive roles in alleviating poverty by providing jobs and income to local communities. In this paper two questions were put forward, first, do mining and tourism industries reinforce or impede each other in terms of their economic contributions? Second, what is the spatial pattern of the locations of mining and tourism sites? Do they tend to cluster or avoid each other? Answers to these questions provided important insights on how mining and tourism together may impact the economy and environment in biodiversity hotspots.
In their study they selected Yunnan region in China one of the 34 global biodiversity hotspots. Yunnan hosts the “mountains of southwest China” biodiversity hotspot. Mining and tourism in Yunnan have been growing at a rate of 20-30 percent since 1998. In this paper they used correlation analyses to measure the relationships between mining activities, tourism visits and local gross domestic productions. They also employed a distance based technique to investigate the nature of any dependency between mining and tourism sites.Results showed that mining activities tend to be in relatively fluent areas while tourism tends to occur in less developed areas when measured by economic indicators. The physical locations of mines and tourism sites are clustered. Conflicts between tourism and mining exist when they occur in the same area as tourism income is impacted by mines nearby.
w w w . a j e r . o r g
Page 195
hotspots” paper by J.A. Veech introduces a new method of hotspot analysis that ranks hotspots on the basis of biodiversity and anthropogenic threats to biodiversity.
Methods of study include data compilation, defining threat on a per-species basis: the species load, using multiple regressions for hotspot analysis. Data on the total number and number of endemic non-fish vertebrate species and vascular plant species in each mega diversity country were obtained from Mittermeier, Myers, and Thomsen. (1997). Socioeconomic data for each country were obtained from their „Data Profiles‟ on the World Bank website, specifically population size, population growth rate, rural population density, and debt. Prior to conducting the hotspot analysis, the four socioeconomic variables were standardized to the number of species within a hotspot; these standardized variables are referred to as „species loads‟. Using data from all 17 mega diversity countries, a multiple regression was performed of species richness against the inverse of the area of each country and the species load for population size (Lpop), population growth rate (Lpgr), rural population density (Lrpd), and debt (Ldeb).
The primary goal of the study was to test whether threats to biodiversity can be usefully incorporated into a comprehensive hotspot analysis. More specifically, it tested whether the ranking of hotspots was significantly improved by including socioeconomic variables presumed to represent processes (e.g. habitat destruction) that result in the loss of biodiversity. Using the standardized residuals obtained from multiple regression models, the mega diversity countries were ranked on the basis of the threat per species (i.e. species load variables) and the number of species per unit land area; this was the full regression model. This ranking was then compared with a ranking based only on the number of species per unit land area. The ranking obtained from the full regression model differed substantially from that obtained from the area-only model, as evidenced by the low Spearman rank correlation coefficients comparing the two models. It is reassuring that the ranking of hotspots based on either endemic vertebrate or endemic plants species richness are similar to one another and similar to rankings based on total vertebrate and plant species richness. However, perfect agreement (100%) on the very top ranks should not be expected and was not obtained.
Paper by Venevsky and Venevskaia (2005) suggests quantitative measures which enable two criteria of the global biodiversity hotspots to be applied on a national level for 74 large countries, and show how these measures can be applied to map national biodiversity hotspots. The basic concept in identifying biodiversity hotspot is to elaborate and further develop the national protected area system, to satisfy both national and international conservation goals. They showed how national biodiversity hotspots can be mapped from the species–energy relationship for vascular plants using climate, topographical and land use data when spatial pattern of species richness is not known. This methodology to map national biodiversity hotspots from abiotic factors is applied to Russia as a case study. Three Russian biodiversity hotspots, North Caucasus, South Siberia and Far East were identified. The resulting hotspot maps cover national-scale environmental gradients across Russia and although they are also identified by Russian experts their actual geographical locations were hitherto unspecified. The large-scale national hotspots, identified for Russia, can be used for further fine scale and more detailed conservation planning.
Due to the linkages between socio-economic systems and ecological systems, issues such as development, poverty eradication, and biodiversity conservation need to be addressed not as individual phenomena but rather as complex dynamic systems. Paper by Fisher and Christopher (2007) presents present five key socioeconomic poverty indicators (access to water, undernourishment, potential population pressure, number living below poverty line and debt service) and integrate them with an ecologically based hotspots analysis in order to illustrate magnitude of the overlap between biological conservation and poverty.
Method they used for the research are, 34 hotspots were clipped to a map of the world's countries, these files were combined in order to determine which hotspots overlapped with which country and to select all countries with at least 100,000 ha of overlapping hotspots. This resulted in 125 countries for further analysis. They chose critical socio-economic indicators relating to poverty that show interaction between poverty and conservation threats. They used traditional economic metrics of poverty: national debt service and percentage of people living below the national poverty line. They also included a broader range of poverty indicators (undernourishment, access to clean water and potential population pressure) not based solely on Market-identified poverty. Due to their innate connection with life-supporting ecosystems, they mentioned it as ecological poverty indicators.
w w w . a j e r . o r g
Page 196
conditions at an accelerating rate across geo-climatic regions in Europe by 2050. They also found a strong relationship between temperature and the value of EGS (Ecosystem Goods and Services), but the direction of this relationship depended on the type of EGS under consideration. For example, this relationship was estimated to be positive for provisioning and regulating services, but negatively related to cultural services. The regional model specification results suggested that the negative impacts of climate change on biodiversity (i.e. CCIBE) could go against the positive direct climate change impact on forest growth and generate a net negative impact on total value of EGS, such as for the provisioning services in the Mediterranean Europe .Our estimation results confirm the role of biodiversity as a nature-based policy solution for climate change mitigation, shedding light on the policy actions that generate co-benefits by enhancing ecosystems' capacity to mitigate climate change impacts, while conserving biodiversity and sustaining the flows of EGS for human livelihoods. Especially, nature-based mitigation policies are more cost-effective and better at coping with the ethic and inequality issues associated with distributional impacts of the policy actions, compared to the pure technical solutions to improving energy efficiency and reducing emissions. However, the strength of biodiversity as a nature-based policy option for climate change mitigation depends on both the nature of the EGS and the geographical area under consideration.
III.
METHODOLOGY
The geographical information of forest ecosystem across India for a particular time series is analyzed. Simultaneously, the degradation of this ecosystem is examined by the anthropogenic activities, which has gradually or steeply increased in these zones at the same time period. Based on this intersection of data, the hot spot is selected and investigated.Satellite remote sensing (RS) and geographic information system (GIS) have been widely applied in identifying and analyzing land use/cover change.GIS provides a flexible environment for displaying, storing and analyzing digital data necessary for change detection. Using GIS (Geographical Information System) tool, the land use data of agriculture and forest ecosystem in the years 2000, 2005, 2010 and 2015 were extracted as the basic data of land use/cover change analysis. Land use/cover change is a major factor for global change because of its interactions with climate, ecosystem processes, biogeochemical cycles; biodiversity, and, even more important, human activities (Vogelmann and Howard, 1998; Xiao et al., 2006), research on land use/cover change has become an important aspect of global change. Geographic information system (GIS) has been widely applied in identifying and analyzing land use/cover change. GIS can provide multi-temporal data that can be used to quantify the type, amount and location of land use change. GIS also provides a flexible environment for displaying, storing and analyzing digital data necessary for change detection (Wu et al., 2006).
3.1 Land use dynamic degree model
The land use change was determined using the land use dynamic degree model that included the single land use dynamic degree model and the synthesis land use dynamic degree model. Region differences in the rate of land use change were determined with the single land use dynamic degree that could be mathematically expressed by the following relationship (Li and He, 2002):
Si = (Ai-UAi)/Ai/(T2-T1)×100% (1)
Where Si is the rate of the ith type land use change during the monitoring period T1 to T2; Ai is the area of the ith type land use at the beginning, and UAi is the area of the ith type land use that remains unchanged during this monitoring. Thus, this model represented the time rate of change for one type of land use that was converted into another type of land use relative to the land use situation at the beginning of the monitoring period. Regional difference in land use characteristics was determined using the synthesis land use dynamic degree model as follows (Liu and Buhe, 2000):
S = [(Ai-j/ Ai)] × (1/t) ×100% (2)
S is the land use change rate over time t, Ai is the ith type land use area at the beginning of the monitoring period, and Ai-j is the total area of the ith type land use that is converted into the other types of land use. This model was thus defined as the time rate change of land use that converted into the other types of land use and that at the beginning of monitoring period was part of the land use subject to change. This dynamic degree represented, in a comprehensive manner, the change of land use in a given region.
IV.
DISCUSSION AND RESULTS
w w w . a j e r . o r g
Page 197
agriculture is their employment and primary income generating activity. Thus the intersection served in the identification of hotspot.
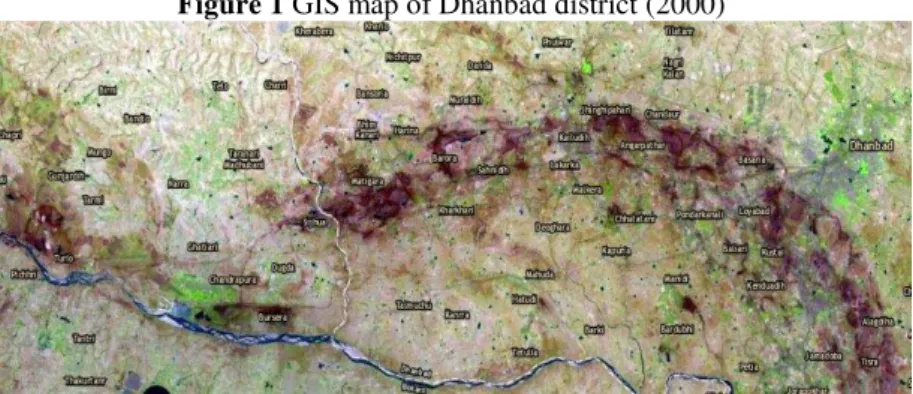
Firstly, temporal changes of land use characteristics were quantitatively analyzed through land use dynamic degree. And then the driving forces of land use changes were analyzed based on natural and artificial factors. From 2000 to 2015, as the result of natural factors and human disturbances, the area of forest-agricultural land shrunk, bringing the conversion from forest and forest-agricultural land to building zone, scrub/fallow land, industrial zone and mining [Figures 1 -4].
Figure 1 GIS map of Dhanbad district (2000)
Figure 2 GIS map of Dhanbad district (2005)
Figure 3 GIS map of Dhanbad district (2010)
w w w . a j e r . o r g
Page 198
The annual conversion rates indicated the rapid land use changes in Dhanbad forest-agricultural ecosystem hotspot. Through the synthesis land use dynamic degree for the three sub-periods, the land use changes during the period 2010-2015. The change in land-use pattern in 2005-2010 increased comparing with that during the period 2000 to 2005. Hence, the management of Dhanbad forest-agricultural ecosystem hotspot must focus on forest land use changes in future, so as to achieve effective conservation of the forest and agricultural land. The study results could provide foundations for target protection in Dhanbad forest-agricultural ecosystem hotspot.
4.1 Quantity analysis of land use changes
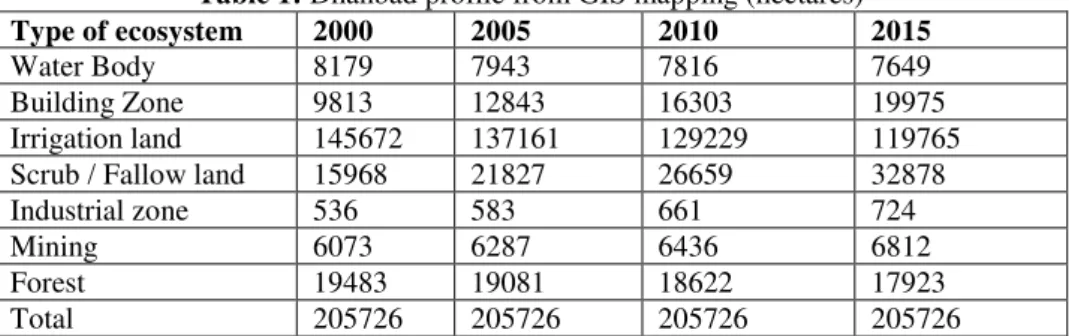
The land use change for the three sub-periods was shown in Table 1 with an increase of irrigation land during the second period(2005-2010) and decrease in the third period Table 1 also shows an increase of forest land in the second (2005-2010) and third (2010-2015) compared to first period (2000-2005). The areas for building zone and industrial zone increased during the sub- periods. The areas of forest decreased during the sub periods.
Table 1: Dhanbad profile from GIS mapping (hectares)
4.2 Land use dynamic degree analysis
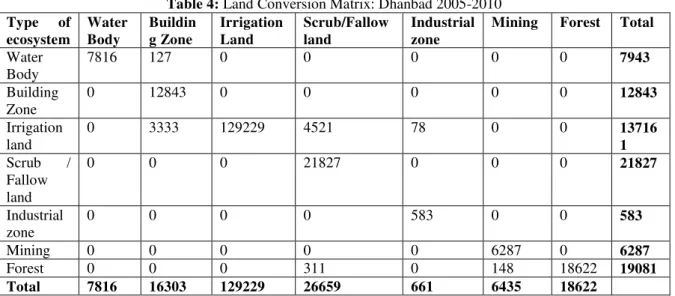
The single land use dynamic degree for each land use types that is the annual conversion rates of land use types were calculated for the three periods. Among the various land use types, irrigation land annual conversion rate was the highest during the three periods. Losses of irrigation land were mainly converted to building zone, scrub/fallow land and industrial zone (Table 2, 3 and 4). Losses of forest land were mainly converted to building zone, scrub/fallow land, industrial zone and mining (Table 2, 3, and 4).
Table 2: Dhanbad Annual average change (hectares/year)
Table 3: Land Conversion Matrix: Dhanbad 2000-2005
Type of
ecosystem
Water Body
Building Zone
Irrigation Land
Scrub/Fallow land
Industrial zone
Mining Forest Total
Water Body 7943 236 0 0 0 0 0 8179
Building Zone
0 9813 0 0 0 0 0 9813
Irrigation land
0 2391 137161 5859 47 214 0 145672
Scrub / Fallow land
0 0 0 15968 0 0 0 15968
Industrial zone
0 0 0 0 536 0 0 536
Mining 0 0 0 0 0 6073 0 6073
Forest 0 403 0 0 0 0 19081 19483
Total 7943 12843 137161 21827 583 6287 19081
Type of ecosystem 2000 2005 2010 2015
Water Body 8179 7943 7816 7649 Building Zone 9813 12843 16303 19975 Irrigation land 145672 137161 129229 119765 Scrub / Fallow land 15968 21827 26659 32878 Industrial zone 536 583 661 724 Mining 6073 6287 6436 6812 Forest 19483 19081 18622 17923 Total 205726 205726 205726 205726
Type of ecosystem 2000-2005 2005-2010 2010-2015
w w w . a j e r . o r g
Page 199
Table 4: Land Conversion Matrix: Dhanbad 2005-2010
Type of ecosystem Water Body Buildin g Zone Irrigation Land Scrub/Fallow land Industrial zone
Mining Forest Total
Water Body
7816 127 0 0 0 0 0 7943
Building Zone
0 12843 0 0 0 0 0 12843
Irrigation land
0 3333 129229 4521 78 0 0 13716 1
Scrub / Fallow land
0 0 0 21827 0 0 0 21827
Industrial zone
0 0 0 0 583 0 0 583
Mining 0 0 0 0 0 6287 0 6287
Forest 0 0 0 311 0 148 18622 19081
Total 7816 16303 129229 26659 661 6435 18622
Though the areas of other land use types (building zone, scrub/fallow land and industrial zone) increased during the study periods, their annual conversion rates indicated the rapid land use changes in (Table 5).
Table 5: Land Conversion Matrix: Dhanbad 2010-2015
Type of ecosystem Water Body Building Zone Irrigation Land Scrub/Fallow land Industrial zone
Mining Forest Total
Water Body
7649 167 0 0 0 0 0 7816
Building Zone
0 16303 0 0 0 0 0 16303
Irrigation land
0 3505 119765 5959 0 0 0 129229
Scrub / Fallow land
0 0 0 26659 0 0 0 26659
Industrial zone
0 0 0 0 661 0 0 661
Mining 0 0 0 0 0 6435 0 6435
Forest 0 0 0 260 63 376 17983 18622
Total 7649 19975 119765 32878 724 6811 17983
4.3.Driving Factors of Land-Use Change
The synthesis land use dynamic degree of Dhanbad forest-agricultural ecosystem hotspot for the period 2000 to 2005 was -13.82%, for 2005-2010 was -11% and for 2010-2015 was -9.58% (Table 6). Comparing with the overall land use change during the earlier stage, the land use change for the later stage had increased.
Table 4.6: Land use dynamic degree of each land use types for the three periods: Dhanbad (in %)
Type of ecosystem 2000-2005 2005-2010 2010-2015
Single Land Use Dynamic Degree model
Water Body 0.5770 0.3197 0.4273 Building Zone -6.1754 -5.3881 -4.5046 Irrigation land 1.16851 1.1565 1.4646 Scrub / Fallow land -7.3384 -4.4275 -4.6655 Industrial zone -1.7537 -2.6758 -1.9062 Mining -0.7047 -0.4739 -1.1684 Forest 0.4126 0.4811 0.7507 Synthesis land use
dynamic degree
w w w . a j e r . o r g
Page 200
4.4 Service Declines, Degradation, and Increasing Vulnerability
Our work highlights the substantial impact of land-cover change on ecosystem services, resulting in declines in ecosystem service levels. These declines mirror biodiversity losses in the region. The significance of these declines relates to the overarching role regulating services play in soil conservation and nutrient cycling, and in turn, the services of primary production and water. It is the latter services that underpin the agricultural economy. These results also point to the substantial impacts of the extensive areas of degraded land. Degraded areas, overlap with the hotspots of the carbon, forage, erosion, and tourism services. Overgrazing of these areas, together with clearing of other areas to grow livestock feed to supplement the forage production service, have been major drivers of change in ecosystem services.
The declines in what are mostly regulating and supporting services, together with the documented biodiversity losses, raise concerns about long-term decreases in the region‟s productivity and resilience, and thus increases in its vulnerability to shocks such as floods, drought, or market shifts. The examined regions are facing decreased ecosystem service levels, threatened biodiversity, high unemployment levels, and narrowing future options. The situation mirrors semiarid regions around the world, which house the most vulnerable people, ecosystems, and ecosystem services. Understanding the drivers of changes in land cover and subsequently in ecosystem services is essential in the design of interventions.
V.
POLICY IMPLICATIONS
Land-cover change has been identified as one of the most important drivers of change in ecosystems and their services. However, information on the consequences of land cover change for ecosystem services and human well-being at local scales is largely absent. Where information does exist, the traditional methods used to collate and communicate this information represent a significant obstacle to sustainable ecosystem management. Embedding science in a social process and solving problems together with stakeholders are necessary elements in ensuring that new knowledge results in desired actions, behavior changes, and decisions. We have attempted to address this identified information gap, as well as the way information is gathered, by quantifying the local-scale consequences of land-cover change for ecosystem services of the highly degraded ecosystems of Indian subcontinent of major ecosystems.The declines in what are mostly regulating and supporting services, together with the documented biodiversity losses, raise concerns about long-term decreases in the region‟s productivity and resilience, and thus increases in its vulnerability to shocks such as floods, drought, or market shifts. The examined regions are facing decreased ecosystem service levels, threatened biodiversity, high unemployment levels, and narrowing future options. The situation mirrors semiarid regions around the world, which house the most vulnerable people, ecosystems, and ecosystem services. Understanding the drivers of changes in land cover and subsequently in ecosystem services is essential in the design of interventions.
The political, social, economic, and technological changes associated with the ecosystems were key drivers of change in the examined ecosystem. The history of land-use decisions and their impacts point to the need to manage systems in ways that recognize their natural constraints and vulnerabilities, as well as the need to create future economies and livelihoods that foster sustainable use of services along with the promotion of human well-being. Sustainable land-use practices rely on the consideration of, and protection of, ecosystems and their services. Such practices focus on maintaining the resilience of ecosystems, and on building agility into production strategies, enabling responses to market trends and fluctuations.
VI.
CONCLUSION
w w w . a j e r . o r g
Page 201
restoration activities targeted at areas of importance to water-flow regulation and erosion control. This realization is not new and, the government formulated policies to deal with drought and erosion.
ACKNOWLEDGMENT
The authors are grateful to the host institute, Madras School of Economics.REFERENCES
[1]. Butter, R.W, (1980), The concept of a tourist area cycle of evolution: implications for management of resources, Canadian
Geographer 24 (1), 5–12.
[2]. Chaudhary, P., Bawa, K. S., (2011), Local perceptions of climate change validated by scientific evidence in the Himalayas,
Biol. Lett. 7, 767-770.
[3]. Cincotta, R. P., (2000), Human population in the biodiversity hotspots, Nature 404, 990-992
[4]. Ding, H. ,Nunes, P.A.L.D. (2014), Modeling the links between biodiversity, ecosystem services and human wellbeing in the
context of climate change: Results from an econometric analysis of the European forest ecosystems, Ecological Economics 97, 60-73
[5]. Fisher, B., Christopher, T., (2007), Poverty and biodiversity: Measuring the overlap of human poverty and the biodiversity
hotspots, Ecological economics 62, 93-101
[6]. Huang, G., Zhou, W., Ali, S., (2011), Spatial patterns and economic contributions of mining and tourism in biodiversity hotspots:
A case study in China, Ecological Economics 70, 1492-1498
[7]. Miranda, M., Burris, P., Bingcang, J.F., Shearman, P., Briones, J.O., Vina, A.L., Menard, S., (2003), Mining and Critical
Ecosystems: Mapping the Risks, World Resources Institute, Washington DC
[8]. Mittermeier, R. A., Myers, N., Thomsen, J. B., Fonseca, G. A. B., (1998), Biodiversity hotspots and major tropical wilderness
areas: approaches to setting conservation priorities, Conservation Biology, 12, 516–520
[9]. Myers, N., (1990), The biodiversity challenge: expanded hot-spots analysis, The Environmentalist, 10, 243–256.
[10]. Myers, N., (1988), Threatened biota: hotspots in tropical forests, The Environmentalist, 8, 178–208.
[11]. Myers, N., Mittermeier, R. A., Mittermeier, C. G., da Fonseca, G. A. B., Kent, J., (2000), Biodiversity hotspots for conservation
priorities, Nature 403, 853-858
[12]. Roy, P., (2013), Forest fragmentation in India, Current Science 15, 774-780
[13]. The World Bank, 2004.HIV/AIDS and mining. http://www.worldbank.org/ogmc/wbminingaids.htm. (Retrieved on Oct, 27 2005
from.)
[14]. Veech, J.A., (2003), Incorporating socioeconomic factors into the analysis of biodiversity hotspots, Applied Geography 23,
73-88
[15]. Venevsky, S.,Venevskaia, I., (2005), Hierarchical systematic conservation planning at the national level: Identifying national
biodiversity hotspots using abiotic factors in Russia, Biological conservation 124, 235-251
[16]. Vitousek, P.M., (1997), Human domination of earth‟s ecosystem, Science 277, 494-499
[17]. Zhang, K., Zhang, Y., Tian, H., Cheng, X., Dang, H.,Zhang, Q., (2013), Sustainability of social–ecological systems under