Submitted29 September 2015
Accepted 4 December 2015
Published4 January 2016
Corresponding author
Joshua M. Diamond, [email protected]
Academic editor
Mario Negrello
Additional Information and Declarations can be found on page 12
DOI10.7717/peerj.1533 Copyright
2016 Diamond
Distributed under
Creative Commons CC-BY 4.0 OPEN ACCESS
Goodness of fit to a mathematical model
for Drosophila sleep behavior is reduced
in hyposomnolent mutants
Joshua M. Diamond
Dornsife College of Letters, Arts and Sciences, University of Southern California, Los Angeles, CA, USA
ABSTRACT
The conserved nature of sleep in Drosophila has allowed the fruit fly to emerge in the last decade as a powerful model organism in which to study sleep. Recent sleep studies in Drosophila have focused on the discovery and characterization of hyposomnolent mutants. One common feature of these animals is a change in sleep architecture: sleep bout count tends to be greater, and sleep bout length lower, in hyposomnolent mutants. I propose a mathematical model, produced by least-squares nonlinear regression to fit the formY =aX∧b, which can explain sleep behavior in the healthy animal as well as previously-reported changes in total sleep and sleep architecture in hyposomnolent mutants. This model, fit to sleep data, yields coefficient of determinationRsquared, which describes goodness of fit. R squared is lower, as compared to control, in hyposomnolent mutantsinsomniacandfumin. My findings raise the possibility that low Rsquared is a feature of all hyposomnolent mutants, not justinsomniac andfumin. If this were the case,Rsquared could emerge as a novel means by which sleep researchers might assess sleep dysfunction.
SubjectsAnimal Behavior, Entomology, Mathematical Biology, Statistics
Keywords Sleep, Activity, Drosophila, Waking, Nonlinear regression, Architecture, Least-squares,
Insomniac, Homeostasis
INTRODUCTION
Sleep in Drosophila exhibits many characteristics that are seen also in mammalian sleep, including extended periods of quiescence and increased arousal threshold (Cirelli & Bushey, 2008). Following sleep deprivation, sleep in Drosophila is characterized by increased duration, hyper-consolidation, higher-than-usual arousal threshold, (Cirelli & Bushey, 2008) and decreased latency to sleep (Koh et al., 2008); all of these traits mirror mammalian response to sleep deprivation.
be sufficient to inhibit sleep in both Drosophila and in humans; moreover, they suggest a conserved biochemical mechanism for sleep in both species.
Behavioral and biochemical evidence for sleep as a conserved phenomenon has allowed Drosophila to emerge in the last decade as a powerful model for the study of sleep.
Much recent work in Drosophila has been focused on the study of hyposomnolent mutants (Koh et al., 2008;Hendricks et al., 2001;Stavropoulos & Young, 2011;Kume et al., 2005;Foltenyi, Greenspan & Newport, 2007). Study of sleep behavior in these mutants may shed light on the mechanisms of sleep and sleep pathology.
In addition to reduced total sleep, hyposomnolent mutants also demonstrate altered sleep architecture. Sleep is poorly consolidated: bout length is reduced as compared to control (Koh et al., 2008;Stavropoulos & Young, 2011;Foltenyi, Greenspan & Newport, 2007;Pfeiffenberger & Allada, 2012;Ueno et al., 2012). In some of these cases bout count is also reduced (Koh et al., 2008), but more frequently it is elevated (Stavropoulos & Young, 2011;Foltenyi, Greenspan & Newport, 2007;Pfeiffenberger & Allada, 2012). One such example isinsomniac(Stavropoulos & Young, 2011;Pfeiffenberger & Allada, 2012), which is the basis of much of the modeling work in this study.fumin, which is also considered in this study, has been reported to demonstrate reduced sleep bout length (Ueno et al., 2012).
Several hyposomnolent mutants have also shown an absent or diminished sleep re-bound following sleep deprivation (Koh et al., 2008;Kume et al., 2005;Foltenyi, Greenspan & Newport, 2007;Pfeiffenberger & Allada, 2012).
The goal of this study is to produce a mathematical model that describes the relation-ship between total sleep, sleep bout count and sleep bout length—during normal sleep and following sleep deprivation—in control animals. I will then examine the extent to which this model also holds true in hyposomnolent mutants. A mathematical model could provide better understanding of sleep behavior, in controls as well as in disease states. The extent to which the model holds true in mutant lines could be used as a measure of sleep function in those mutant lines.
Ueno et al. (2012)notes that, among individual Drosophila animals, the relationship betweensleep bout lengthandthe probability of achieving a sleep bout of greater length conforms to a power law function. The mathematical relationship between sleep bout length andsleep bout count, however, has not been considered in past work. Incorporating this relationship into my mathematical model is a goal of this study.
My results may establish a new paradigm for analysis of sleep dysfunction in hypo-somnolent mutants. These techniques could also be used on higher animals, including humans.
METHODS
All animals came from the Bloomington Stock Center at Indiana University.Insomniac corresponds to stock number 18,307. w1118 was used as control.
Sleep was monitored using TriKinetics’ DAM2 Drosophila Activity Monitors, as previously described (Pfeiffenberger et al., 2010a). Briefly, animals were placed inside activity tubes containing food made of 5% sucrose and 2% agarose and then housed in an incubator with 12-hour:12-hour day:night cycles at 25 ◦C and 85% humidity. Sleep
behavior was measured in parallel, in that both wildtype andinsomniacwere housed in the same incubator, at the same time, during the experiment. Animals were given three days to acclimate to the day/night cycle before data collection began. After the acclimation period, data collection lasted four full 24-hour periods. Sleep is defined as five minutes of inactivity (Pfeiffenberger et al., 2010b). Data was processed using SleepLab, custom Matlab-based software provided by Dr. William Joiner (UCSD). Animals that showed significant loss of health during the course of the experiment, as determined by the SleepLab software, were automatically excluded from the results.
Statistical analysis was handled with GraphPad PRISM 6. Daytime data have been separated from nighttime data, but otherwise all data have been combined together over the four days. InUeno et al. (2012), the technique of combining data from multiple flies is used and is empirically validated.
Results are considered either as averages across the experiment or as individual animal data. An average across the experiment refers to the average of a specific measurement, taken over all animals of a specific genotype and over all days or nights of the experiment. For example, we might study mean total sleep of allinsomniacanimals during all nights of the experiment. We might also consider mean sleep bout length, which is more complicated. Animals tend to sleep multiple sleep bouts per day or night. Therefore, mean sleep bout length across the experiment is calculated by first averaging the length of all the sleep bouts slept by a given animal in a given day or night, and then by averaging again across all animals and all days or nights. Mean sleep bout length across the experiment thus refers to average of averages.
On the other hand, data analysis might consider individual animal data. Here, each data point is an animal-day or animal-night pairing. Each pairing consists of a total sleep, a meansleep bout length (since, as mentioned earlier, sleep bouts tend to be multiple), and a sleep bout count.
This individual animal data is the basis for production of a mathematical model. Ordinary (unweighted) least-squares nonlinear regression is used to produce lines of fit, constrained to the equaitonY=aX∧b. In each line of fit, the independent variableX represents the sleep bout count of the animal-time period pair, while the observed response variableY represents the mean sleep bout length in that same animal-time period pair.
Similar lines of fit are produced using activity bout data. In activity bout data analysis, independent variableX represents activity bout count, and observed response variableY represents mean activity bout length.
to model sleep behavior during the fifth day, immediately following the night of sleep deprivation. Here, data is combined across multiple animals, but not across multiple days, since we only consider the single day immediately following the night of sleep deprivation. n=7 control animals and 9insomniacanimals.
Finally, similar lines of fit are produced using data from Dr. William Joiner. Dr. Joiner contributed data from two experiments, both conducted in parallel, which compare the sleep behavior ofiso31, a quasi-wildtype line, with that offumin, a hyposomnolent mutant. n=31 control animals and 28fuminanimals in the first experiment.n=16 control and fuminanimals in the second experiment.
Nonlinear regression assumes that the pool of residuals is drawn from a Gaussian distribution. The D’Agostino & Pearson omnibus K2 test is used to test for attainment of this requirement.
R2 is computed based on the data’s adherence to the same ordinary least-squares nonlinear regression line discussed premviously. Specifically, R2
=1−(SSres/SStot), where SSreg is the sum of the squares of all distances along they-axis between data points and the best-fit curve, and SStot equals the sum of squares of all distances along they-axis between data points and the horizontal line that runs through the mean of ally-values.
RESULTS
n=31 per genotype and 64 total. Since the experiment ran for four days and four nights, we consider sets of 31∗4=124 observations.
Characterization of wild type sleep
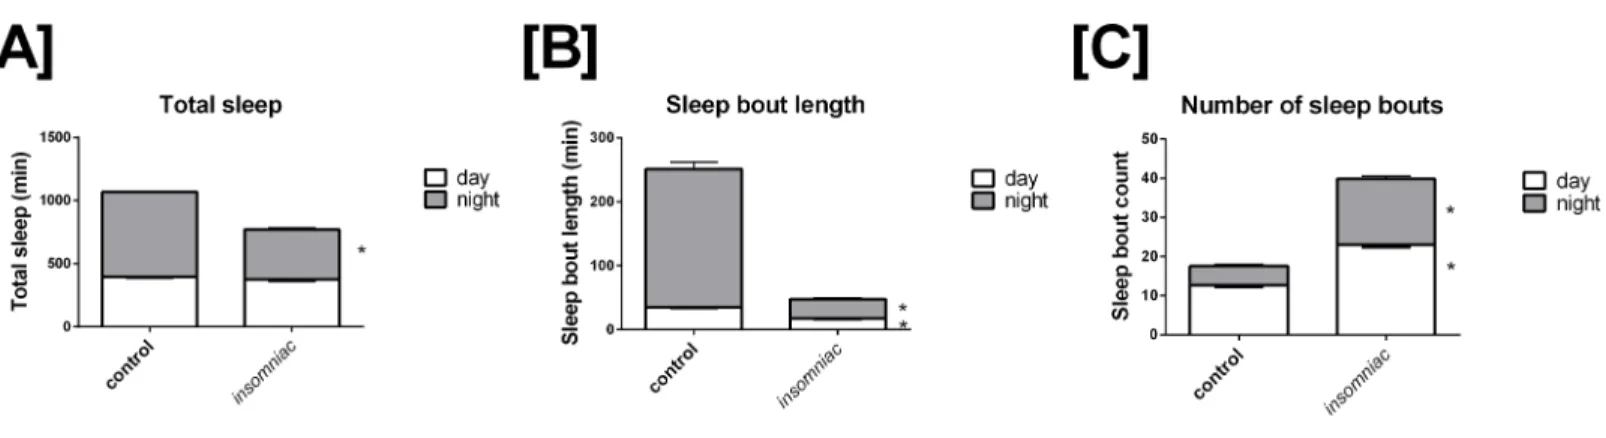
Sleep in wild type animals is consistent with that seen in the literature, in terms of both total time slept and sleep architecture (Stavropoulos & Young, 2011;Pfeiffenberger & Allada, 2012). Total sleep in control is 396.4 min in the day, with SD=82.9, and 672.6 min in the night, with SD=29.9 (Fig. 1A). Total daily sleep is 1069.0 min, with SD=81.7. Mean sleep bout length in control is 35.1 min in the day, with SD=14.4, and 216.1 min in the night, with SD=118.2 (Fig. 1B). Mean sleep bout count in control is 12.6 in the day, with SD=4.6, and 4.9 in the night, with SD=4.2 (Fig. 1C).
Characterization of insomniacsleep
Insomniacdemonstrates a robust phenotype in terms of total time slept.Insomniacanimals tested in this experiment sleep significantly less than controls in the 24-hour period. Mean total sleep in insomniac is 770.1, with SD=210.0, compared to 1069.0 with SD=81.7 in wild type (Fig. 1A). According to a two-tailed, two-sample heteroscedastic (allowing for unequal variance) Student’sT-test, probability that measures of total sleep per 24 h in insomniac and controls came from the same distribution is given by p<0.0001. Separate consideration of daytime and nighttime sleep reveals that nighttime total sleep in insomniac, at 394.7 (SD=148.7) is significantly less than nighttime sleep in wildtype, at 672.6 (SD=29.9) (Fig. 1A). Daytime total sleep ininsomniacis unchanged as compared to control (Fig. 1A).
Figure 1 Characterization of sleep ininsomniacversus control. Each genotype-time period pair represents an average acrossn=124
measure-ments. (A) Total sleep in insomniac versus control. Values shown represent mean total sleep across the four days of the experiment. Nighttime to-tal sleep is significantly decreased ininsomniacas compared to control, while daytime sleep is unchanged. Also worthy of note is that total 24-hour sleep ininsomniacis significantly decreased as compared control. This is not indicated in the figure. (B) Sleep bout length in insomniac versus con-trol. Values represent averages across the length of the experiment. Sleep bout length is significantly reduced ininsomniacas compared to control, for both the daytime and nighttime. (C) Mean length of sleep bouts across the length of the experiment. Sleep bout count is significantly increased ininsomniacas compared to control, for both daytime and nighttime.∗p<0.0001 according to two-tailed, two-sample heteroscedastic Student’sT
-test. Error bars represent the standard error measurement. Error bars for nighttime (gray) project above the top of the corresponding bar. Error bars for daytime (white) project from below the top of the corresponding bar.
Figure 2 Representative actograms for control andinsomniac. (A) control. (B) insomniac. Each panel represents the sleep/wake activity of a
sin-gle animal. So, three animals are shown for each genotype, and six are represented in total. Note disorganized sleep/wake behavior ininsomniac, in-cluding extensive activity during lights-off 12-hour periods.
bout length ininsomniac is 17.4 in the day, with SD=8.4, and 30.0 in the night, with SD=21.4 (Fig. 1B). Both of these values are significantly reduced as compared to wild type. Meanwhile, bout count is significantly greater ininsomniac, with mean bout count=23.1 (SD=8.1) in the day and 16.8 (SD=7.5) in the night (Fig. 1C).
That sleep ininsomniac is poorly consolidated can be observed qualitatively.Figure 2 represents activity ininsomniacand control. We see that, in the case ofinsomniac, activity is distributed throughout periods in which control flies normally sleep.
Production of a mathematical model
Figure 3 Relationship between sleep bout count and mean sleep bout length in individual control and
insomniacanimals. Each dot represents a single animal-day pair (A and B) or animal-night pair (C and
D). Theyaxis represents the mean length of sleep bouts achieved during each animal-time period pair, and thexaxis represents the amount of sleep bouts achieved in that same animal-time period pair. Thusn for each figure is equal to 31∗4=124 animal-time period pairs. Each panel contains an inset, which lists, from to bottom: the equation of the line of fit, in the formatY =aX∧b; the coefficient of determination
R2; the 95% confidence interval for theaparameter; and the 95% confidence interval for theb
parame-ter. Dotted lines represent the upper and lower margins of the 95% confidence band. The chances are 95% that the true line of fit lies between these upper and lower margins.
Sleep behavior is most regular in the case of control night (Fig. 3C). To this set of data, I fit the model
y=a·xb (1)
wherey corresponds to mean sleep bout length, for an individual animal, over the course of a single night; andxcorresponds to sleep bout count for that same individual animal over the course of a single night.
I use the coefficient of determinationR2to assess the strength of this model.R2, in short, describes the vertical distance from the data points to the line that attempts to approximate them. If the line provides a good approximate, the data points will tend to be close to the line, and so this vertical distance will tend to be small. A highR2indicates a low vertical distance, on the whole, and thus it indicates that the line of fit approximates the data well.
conditions.R2 is not as high in other experimental conditions as it is in control night (Fig. 3C), indicating a worse fit to the model in these other experimental conditions.
Equation (1), the parameters that comprise it, and theR2coefficient might provide
valuable insight towards the analysis of sleep behavior in Drosophila, even in experimental conditions whereR2is relatively low.
The parameterbis negative in experimental conditions. This indicates that, as bout count rises, mean sleep bout length falls. Further,btends to reside near−1.
InEq. (1),atends to estimate total sleep. For example, inFig. 3C,a=682.9. Consistent with this prediction, measured sleep for this genotype and timeframe is 672.6 min. Given the form ofEq. (1), one ought to expect that the parameterawould estimate total sleep. Suppose, in the regressionEq. (1), it so happens thatb= −1 exactly. Then we can re-express the equation as
y·x=a. (2)
Equation (2)shows that (in the caseb= −1) the best regression generates a fixed constant awith the special property that the product of any pair of values attained by the variablesx andy tends to fall close toa. These values in turn correspond to the bout count and mean bout lengths, respectively, of the animals. And, we know that, in an individual animal-time period pair, mean bout length times bout count equals total sleep for that time period. Thus we see why, whenbfalls close to−1,aestimates total sleep.
Asbdeviates from−1,abecomes a worse estimate of mean total sleep. For example, in Fig. 3B,a=68. This drastically underestimates total sleep for this genotype and timeframe. Forb>−1,ais an underestimate of mean total sleep. Forb<−1,ais an overestimate. The tendency ofato estimate total sleep, as well as the relationship betweenbandaI have just described, holds in both control animals and ininsomniac. Ininsomniac,amay not be as good an estimate of total sleep, in part becausebmay stray further from−1.
The coefficient of determinationR2may be of use. As described earlier,R2is greatest in the setting of control sleep behavior at night.R2close to 1 indicates that the mathematical model closely fits the data.
R2is closer to 1 in the nighttime, as compared to the daytime, with genotype controlled for. In other words, control night has greaterR2than control day; meanwhile,insomniac night has greaterR2thaninsomniacday. Additionally,R2is farther from 1 ininsomniac, as compared to control, with time of day controlled for.Insomniac night has lowerR2than control night;insomniacday has lowerR2than control day.
So, in the daytime, and ininsomniac, the model tends to fit the data less well.
Under conditions where R2is relatively low, such asinsomniac day, 95% confidence intervals for parametersaandbtend to be wider relative to the absolute value of these parameters. Also, 95% confidence bands tend to be wider as well in conditions with low R2.
The sleep data do not pass the D’Agostino & Pearson omnibus K2 test of normalcy test in any genotype or timeframe, including control day, control night,insomniac day, and insomniac night.
Application of the model to activity data
I conducted a similar statistical analysis on the behavior of the animals used in this experiment, except considering activity bouts as opposed to sleep bouts.
Equation (1)does not fit the activity bout data as well as it fits the sleep bout data.R2is 0.608 at maximum.
Like in the case of the sleep bout data,R2is higher in control than it is ininsomniac.R2 values are 0.635 and 0.637 in control, daytime and nighttime, respectively (Figs. S1Aand
S1C), compared to 0.408 and 0.325 ininsomniac(Figs. S1BandS1D).
Note that, in contrast with the sleep bout data, it is not the case in the activity bout data thatR2changes in daytime as compared to nighttime. Within a given genotype, daytime and nighttimeR2values are nearly identical.
Application of the model to sleep rebound
Control andinsomniac animals were deprived of sleep throughout the entire 12-hour lights off period on the fourth night of an experiment. On the fifth day, both control and insomniacanimals demonstrate sleep rebound, butinsomniacsleep rebound is diminished as compared to wildtype (Fig. 4A). On night four of the sleep deprivation experiment, control slept 9.1 min on average (SD=21.6), which is 486 min fewer than the mean sleep time for the first three nights of the experiment. Meanwhile, on night four,insomniacslept 3.4 min on average, which is 514 min fewer than the mean sleep time for the first three nights of the experiment. Then, on day five, following deprivation, control slept 496 min on average, with SD=50.2. This is 100 min greater than the mean sleep time in control for the first three days of the experiment.insomniac, on day five, slept 496 min on average, with SD=126. This is 70.6 min greater than the mean sleep time ininsomniacfor the first three days of the experiment.
I tested my model on the daytime sleep behavior during this fifth day, immediately following sleep deprivation. The results are shown in Figs. 4Band4C. Equation (1) predicts sleep behavior well during sleep rebound. In fact,R2ishigherfollowing rebound than it is during usual daytime sleep for each respective genotype. CompareFig. 4Bwith Figs. 3Aand4CwithFig. 3B.
The finding discussed in ‘Production of a mathematical model’, whereR2is lower in insomniac than it is in control, still holds in the case of sleep rebound.
Application of the model to other lines
Trikinetics data from two other lines was obtained from Dr. William Joiner. These are iso31, a quasi-wildtype line which serves as control, andfumin, a hyposomnolent line. Two experiments, both conducted in parallel, compare sleep behavior iniso31with sleep behavior infumin.
Figure 4 Mathematical model applied to sleep rebound following deprivation.(A) shows sleep depri-vation and subsequent rebound in control andinsomniac. The gray bar represents the difference in mean total sleep during the fourth night as compared to the mean total sleep in the first three nights. The white bar represents mean total sleep during the fifth day as compared to the mean total sleep during the first three days. Error bars represent SEM. (B) and (C) show the mathematical model as applied to sleep be-havior during this fifth day. Each dot represents a single animal-day pair. Theyaxis represents the mean length of sleep bouts achieved during each animal-day pair, and thexaxis represents the amount of sleep bouts achieved in that same animal-day pair.n=7 animal-day pairs in (B) and 9 animal-day pairs in (C). Each panel contains an inset, which lists, from to bottom: the equation of the line of fit, in the formatY=
aX∧b; the coefficient of determinationR2; the 95% confidence interval for theaparameter; and the 95%
confidence interval for thebparameter. Dotted lines represent the upper and lower margins of the 95% confidence band.
the day with SD=46.5, and 561.6 min at night with SD=49.6. Sleep time is drastically reduced infumin, more than it is ininsomniac. In the first experiment, sleep is 199.4 min in the day (SD=80.3) and 142.1 min at night (SD=115.4). In the second, sleep is 198.7 min in the day (SD=90.24) and 92.7 min in the night (SD=99.1).
RegardingR2, similar results to those described in ‘Production of a mathematical model’ are also found in Dr. Joiner’s data.
R2foriso31is very high, withR2=0.890 in the daytime andR2=0.980 in the nighttime, in the first experiment (Figs. S2AandS2C). In the second experiment,R2is 0.921 and
As in ‘Production of a mathematical model,’R2tends to be greater for nighttime sleep than for daytime sleep. This is true in the first experiment universally, and in the second experiment in control but not infumin.
DISCUSSION
Evaluation of sleep behavior
Sleep behavior in control is normal quantitatively (Fig. 1) and qualitatively (Fig. 2). This indicates that my sleep system is in good working order. Further, the sleep phenotype I have demonstrated ininsomniacmutants, which is characterized by reduced total sleep and poor consolidation, is consistent with past reports (Stavropoulos & Young, 2011;Pfeiffenberger & Allada, 2012).
Merits of the mathematical model
Coefficient of determinationR2, which measures goodness of fit to the mathematical model described inEq. (1), is as high as 0.993. This serves to validate the mathematical model: at least in some circumstances, the model describes behavior very well. Even in conditions whereR2is not as high, such as ininsomniac night or control day, the model appears to describe the behavior reasonably well considering the higher degree of variability within those data.
Note thatR2 constitutes a measure of sleep behavior independent of those measures usually studied in Drosophila sleep research, namely, total sleep, mean bout length, and mean bout count. Any of these measures could be changed in a Drosophila line, without change inR2. Likewise,R2could theoretically change without corresponding change in total sleep, mean bout length, or mean bout count. Thus, theR2measure offers novelty. As an alternative toR2, the model also yields 95% confidence intervals for parametersa andb. As mentioned in the results, whereR2is relatively low, the 95% confidence intervals for parametersaandbtend to be wide relative to the absolute value of these parameters. So,Eq. (1)parameter confidence interval width could also serve as a novel measure of sleep dysregulation. Confidence bands also tend to be wider in situations with lowR2.
Limitations of the model
Dependency between parametersaandb, when used to describe sleep behavior ininsomniac and control animals, can be as high as 0.984. This indicates thataandbmay be redundant. If a simpler model is desired,Eq. (2)would suffice. However, the inclusion ofbseems to be merited, because production of a model conforming toEq. (1)is not difficult, andbstill improves goodness of fit.
the standard that underlying distributions be Gaussian (D’Agostino, 1986). Nevertheless, future work could look at the use of robust nonlinear regression models, as opposed to the least-squares nonlinear model used here. These are less distorted by data sets whose residuals come from non-Gaussian distributions (D’Agostino, 1986).
Also note that, if mean sleep bout length values are weighted by 1/y2, performance on
the D’Agostino & Pearson omnibus K2 normalcy test is improved but still poor.
Teleological significance of the model
ThatEq. (1)provides a good fit to the data—at least under some circumstances, like control night (Fig. 3C)—indicates that bout length and bout count are regulated with respect to each other such that, despite substantial variability in the values of these measures, total sleep tends to fall within a narrow range. RecallEq. (2): ifEq. (2)provides a good fit to a set of animals, then no matter how much bout length and bout count vary among those animals, that each individual’s total sleep will be close toa.
So,R2may be indicative of how tightly bout length and bout count are regulated among a group of individuals so as to produce levels of total sleep within a narrow range. HighR2 could serve as a marker for successful regulation of sleep. A lowR2would suggest decreased regulation of sleep or an interference with the ability to regulate sleep.
R2for daytime sleep is less thanR2for nighttime sleep (‘Production of a mathematical
model’). This might then suggest that daytime sleep is less tightly regulated than nighttime sleep.
R2for activity data is less thanR2for sleep data (‘Application of the model to activity data’). This could suggest that time spent active is less tightly regulated than time spent asleep.
R2for sleep rebound is greater thanR2for normal daytime sleep (‘Application of the model to sleep rebound’). This could suggest that sleep after a period of sleep deprivation is more strictly regulated than is sleep without sleep deprivation.
Finally,R2 is low ininsomniac (‘Production of a mathematical model’) and infumin (‘Application of the model to other lines’), and it is lower in the latter than in the former. Meanwhile, mean total sleep is also lower infuminthan ininsomniac. This suggests a sort ofdose-dependent relationship between sleep impairment andR2, where, as total
24-hour sleep falls, so doesR2. The more total sleep is impaired, the more achievement of tightly-regulated sleep also tends to be impaired.
Overall, these results suggest thatR2could serve as a measure for the extent of sleep regulation. This is true in Drosophila as well as in higher animals.
ACKNOWLEDGEMENTS
ADDITIONAL INFORMATION AND DECLARATIONS
Funding
Funding came from the University of Southern California’s Provost’s Fellowship for Undergraduate Research. The funders had no role in study design, data collection and analysis, decision to publish, or preparation of the manuscript.
Grant Disclosures
The following grant information was disclosed by the author: University of Southern California’s Provost’s Fellowship.
Competing Interests
The author declares there are no competing interests.
Author Contributions
• Joshua M. Diamond conceived and designed the experiments, performed the experiments, analyzed the data, contributed reagents/materials/analysis tools, wrote the paper, prepared figures and/or tables, reviewed drafts of the paper.
Data Availability
The following information was supplied regarding data availability: Raw data can be found in theSupplemental Information.
Supplemental Information
Supplemental information for this article can be found online athttp://dx.doi.org/10.7717/ peerj.1533#supplemental-information.
REFERENCES
Cirelli C, Bushey D. 2008.Sleep and wakefulness in Drosophila melanogaster.Annals of the New York Academy of Sciences1129:323–329.
D’Agostino R. 1986. Tests for normal distribution. In:Goodness-of-fit techniques. New York: Marcel Dekker.
De Mendonça A, Cunha R. 2010.Therapeutic opportunities for caffeine in Alzheimer’s disease and other neurodegenerative disorders.Journal of Alzheimer’s Disease S1(20):S1–S2DOI 10.3233/JAD-2010-01420.
Foltenyi K, Greenspan R, Newport J. 2007.Activation of EGFR and ERK by rhomboid signaling regulates the consolidation and maintenance of sleep in Drosophila.Nature Neuroscience10(9):1160–1167DOI 10.1038/nn1957.
Hendricks J, Finn S, Panckeri K, Chavkin J, Williams J, Sehgal A, Pack A. 2000.Rest in Drosophila is a sleep-like state.Neuron25(1):129–138.
Koh K, Joiner W, Wu M, Yue Z, Smith C, Sehgal A. 2008.Identification of SLEEPLESS, a sleep-promoting factor.Science321(5887):372–376.
Kume K, Kume S, Park S, Hirsch J, Jackson F. 2005.Dopamine is a regulator of arousal in the fruit fly.The Journal of Neuroscience 25(32):7377–7384.
Pfeiffenberger C, Allada R. 2012.Cul3 and the BTB adaptorinsomniacare key regulators of sleep homeostasis and a dopamine arousal pathway in Drosophila.PLoS Genetics 8(10):e1003003DOI 10.1371/journal.pgen.1003003.
Pfeiffenberger C, Lear B, Keegan K, Allada R. 2010a.Locomotor activity level monitor-ing usmonitor-ing the Drosophila Activity Monitormonitor-ing (DAM) System.Cold Spring Harbor Protocol2010(11): pdb.prot5518DOI 10.1101/pdb.prot5518.
Pfeiffenberger C, Lear B, Keegan K, Allada R. 2010b.Processing sleep data created with the Drosophila Activity Monitoring (DAM) System.Cold Spring Harbor Protocol. Stavropoulos N, Young M. 2011.Insomniacand Cullin-3 regulate sleep and wakefulness
in Drosophila.Neuron72(6):964–976.
Ueno T, Masuda N, Kume S, Kume K. 2012.Dopamine modulates the rest period length without perturbation of its power law distribution in Drosophila melanogaster.PLoS ONE7(2):e32007DOI 10.1371/journal.pone.0032007.