UNIVERSIDADE FEDERAL DE UBERLÂNDIA FACULDADE DE MEDICINA
PROGRAMA DE PÓS-GRADUAÇÃO EM CIÊNCIAS DA SAÚDE
ASSOCIAÇÃO ENTRE POTENCIAL INFLAMATÓRIO DA DIETA, HORÁRIO DE COMER E PADRÃO DE SONO EM PACIENTES COM SÍNDROME DA
APNEIA OBSTRUTIVA DO SONO
TÁSSIA DO VALE CARDOSO LOPES
Uberlândia
TÁSSIA DO VALE CARDOSO LOPES
ASSOCIAÇÃO ENTRE POTENCIAL INFLAMATÓRIO DA DIETA, HORÁRIO DE COMER E PADRÃO DE SONO EM PACIENTES COM SÍNDROME DA
APNEIA OBSTRUTIVA DO SONO
Tese apresentada ao Programa de Pós-graduação em Ciências da Saúde da Faculdade de Medicina da Universidade Federal de Uberlândia, como requisito parcial para obtenção do título de Doutor em Ciências da Saúde.
Área de concentração: Ciências da Saúde.
Orientador(a): Cibele Aparecida Crispim.
Co-orientador(a): Vinicius Vasconcelos Teodoro.
Dados Internacionais de Catalogação na Publicação (CIP) Sistema de Bibliotecas da UFU, MG, Brasil.
L864a 2018
Lopes, Tássia do Vale Cardoso, 1986
Associação entre potencial inflamatório da dieta, horário de comer e padrão de sono em pacientes com síndrome da apneia obstrutiva do sono [recurso eletrônico] / Tássia do Vale Cardoso Lopes. - 2018.
Orientadora: Cibele Aparecida Crispim. Coorientador: Vinicius Vasconcelos Teodoro.
Tese (Doutorado) - Universidade Federal de Uberlândia, Programa de Pós-Graduação em Ciências da Saúde.
Disponível em: http://dx.doi.org/10.14393/ufu.te.2018.496 Inclui bibliografia.
Inclui ilustrações.
1. Ciências médicas. 2. Sono - Aspectos fisiológicos. 3. Apnéia. 4. Nutrição. I. Crispim, Cibele Aparecida, (Orient.). II. Teodoro, Vinicius Vasconcelos, (Coorient.). III. Universidade Federal de Uberlândia. Programa de Pós-Graduação em Ciências da Saúde. IV. Título.
FOLHA DE APROVAÇÃO
TÁSSIA DO VALE CARDOSO LOPES.
ASSOCIAÇÃO ENTRE POTENCIAL INFLAMATÓRIO DA DIETA, HORÁRIO DE COMER E PADRÃO DE SONO EM PACIENTES COM
SÍNDROME DA APNEIA OBSTRUTIVA DO SONO
Presidente da banca (orientador): Profa. Dra. Cibele Aparecida Crispim
Tese apresentada ao Programa de Pós-graduação em Ciências da Saúde da Faculdade de Medicina da Universidade Federal de Uberlândia, como requisito parcial para obtenção do título de Doutor em Ciências da Saúde.
Área de concentração: Ciências da Saúde.
Banca Examinadora
Titular: Profa. Dra. Camila Maria de Melo
Instituição: Universidade Federal de Lavras (UFLA) Titular: Prof. Dr. Rogério Santos e Silva
Instituição: Universidade Federal de São Paulo (UNIFESP) Titular: Profa. Dra.Geórgia das Graças Pena
Instituição: Universidade Federal de Uberlândia (UFU) Titular: Prof. Dr. Thúlio Marquez Cunha
Instituição: Universidade Federal de Uberlândia (UFU) Suplente: Profa. Dra. Luana Padua Soares
AGRADECIMENTOS
Aos meus pais, Ana Celina e Ralph, por estarem sempre ao meu lado e por todo suporte e incentivo durante toda a minha vida acadêmica.
Ao meu marido Diego, por sempre estar presente, por nunca me deixar desistir e sempre me lembrar do quanto sou capaz.
À minha irmã Raíssa, por toda ajuda e dedicação dispendida em minha tese; continuou com função de tradutora e corretora oficial.
À minha orientadora, profa. Cibele Aparecida Crispim, por ter concordado em me orientar e possibilitar a realização desse doutorado.
À Ioná Zalcman Zimberg, por suas ideias e contribuições ao longo do projeto.
Ao professor Vinícius Teodoro e Samantha Paim, por terem permitido a realização da coleta de dados na Clínica do Sono e por todos os ensimanentos em apneia.
Às funcionárias da Clínica do Sono e ao aluno Matheus por toda a ajuda e paciência durante a coleta de dados.
Aos pacientes que fizeram parte desse trabalho, meu eterno agradecimento. Sem suas participações, esse trabalho não seria possível.
Aos amigos do grupo Ceinutri, principalmente Luisa e Laura, por todas as conversas, viagens, cafés e desabafos ao longo desse período.
Às funcionárias do Programa de Pós-graduação em Ciências da Saúde, Gisele e Viviane, pela atenção dispensada em todas as minhas dúvidas e solicitações.
RESUMO
Introdução: Nos últimos tempos, houve um aumento no número de indivíduos com
distúrbios do sono relacionadas à obesidade, como a síndrome da apneia obstrutiva do sono (SAOS). Sabe-se que as interrupções no sono por causa dessas desordens podem gerar patologias devido à inflamação crônica, a qual pode ser agravada pelo tipo de alimentação adotada pelo indivíduo. Porém, a literatura científica carece de estudos que tenham avaliado interferências alimentares, como o potencial inflamatório da dieta e os horários das refeições, na SAOS. Objetivos: Avaliar a associação entre potencial inflamatório da dieta, horários das refeições e paramêtros do sono em apneicos, bem como a eficácia do índice inflamatório da dieta em predizer o padrão do sono. Material e métodos: Pacientes com idade entre 18 a 60 anos e sem diagnóstico prévio de
pró-inflamatórias tiveram maior sonolência que o grupo com tendência a uma dieta mais anti-inflamatória (Exp(B)= 0.470, CI= 0.222-0.994, p=0.048). Os resultados relacionados às associações entre os horários das refeições e os paramêtros do sono demonstraram que o horário do jantar foi associado à latência (β=0.130, p=0.022), ao
IAH (β=1.284, p=0.033) e à uma pior qualidade do sono (β=1.140, p=0.015); o horário do café da manhã foi associado à vigilia (β=3.567, p=0.003) e aos estágios N1 (β=0.130, p<0.001) e REM (β= -1.189, p=0.001); o horário do almoço também foi associado ao estágio N1 (β=0.095, p=0.025), à latencia (β=0.293, p=0.001) e à sonolência diurna (β=1.267, p=0.009). Indivíduos com refeições tardias apresentaram
menor duração do sono REM e maior valor de latência, vigília, estágio N1 e IAH, além de pior qualidade do sono e sonolência diurna quando comparados aos indivíduos que comem mais cedo (p<0.005). Conclusão: Hábitos alimentares não saudáveis, como dietas inflamatórias e refeições tardias, estão associados a alterações no padrão do sono e à severidade da apneia.
ABSTRACT
Background: In the last years, there has been an increase in the number of individuals
(Exp(B)= 0.470, CI= 0.222-0.994, p=0.048). Regarding meal timing, dinner timing was associated with sleep latency (β=0.130, p=0.022), apnea-hypopnea index (AHI) (β=1.284, p=0.033), and poor sleep quality (β=1.140, p=0.015). Breakfast timing was
associated with wakefulness after sleep onset (WASO) (β=3.567, p=0.003), N1
(β=0.130, p<0.001), and R sleep (β= -1.189, p=0.001). Lunch timing also was associated with N1 sleep (β=0.095, p=0.025), sleep latency (β=0.293, p=0.001), and
daytime sleepiness (β=1.267, p=0.009). Compared to early eaters, late eaters presented
lower duration of R sleep and greater values of sleep latency, WASO, N1 sleep, and AHI, beyond increased risk of poor sleep quality and daytime sleepiness (p<0.005). Conclusion: Poor dietary pattern, such as diets with higher inflammatory potential and
late meal timing, was associated with worse sleep pattern and apnea severity.
LISTA DE ILUSTRAÇÕES
Manuscrito 1
Figura 1. Study sample flow chart...31
Manuscrito 2
LISTA DE TABELAS
Tabela 1. Parâmetros alimentares incluídos no índice inflamatório da dieta e valores de ingestão do conjunto de dados da coleta global...21
Manuscrito 1
Table 1. OSA participants’ characteristics according to DII Quintiles………..36
Table 2. Adjusted mean (95% Confidence Interval) of energy and nutrients intake by
DII quintiles……….37
Table 3. ROC curve for the ability of DII to predict a worse sleep pattern and apnea severity in stratified groups………...38 Table 4. Effect of DII on objective sleep parameters (PSG)………..39 Table 5. Effects of DII quintiles on subjective sleep parameters………....40
Manuscrito 2
Table 1. Participants’ characteristics according to food patterns………60
Table 2. Medians of objective (PSG) and subjective sleep parameters by meal timing.62
Table 3. Effects of meal timing and eating duration on PSG parameters………...64
Table 4. Effects of meal timing and eating duration on subjective sleep and fatigue
LISTA DE ABREVIATURA E SÍMBOLOS
CPAP- Continuous Positive Airway Pressure EROs - Espécies Reativas de Oxigênio IAH- Índice de Apneia-Hipopneia
ICSD-3 - International Classification of Sleep Disorder IL – Interleucina
IMC- Índice de Massa Corporal PCR- Proteína C Reativa PSG- Polissonografia
SUMÁRIO
1. Introdução ... 12
2. Referencial teórico ... 13
2.1. Síndrome da Apneia Obstrutiva do Sono ... 13
2.2. A relação da SAOS com as doenças ... 14
2.3. SAOS e inflamação ... 18
2.4. Ingestão alimentar e inflamação ... 20
2.5. Ingestão alimentar e sono ... 22
3. Objetivos ... 25
3.1 Objetivo Geral ... 25
3.2 Objetivos Específicos ... 25
4. Resultados ... 26
4.1 Primeiro manuscrito ... 26
4.2 Segundo manuscrito ... 50
5. Considerações finais ... 75
REFERÊNCIAS ... 76
APÊNDICE A ... 866
APÊNDICE B ... 911
APÊNDICE C ... 922
ANEXO A ... 955
ANEXO B ... 988
ANEXO C ... 100100
ANEXO D ... 1033
ANEXO E ... 1044
ANEXO F ... 1066
APRESENTAÇÃO
Essa tese está estruturada no formato alternativo aprovado pelo Colegiado do Programa de Pós-graduação em Ciências da Saúde dessa Universidade, o qual define que os resultados do estudo sejam apresentados em formato de artigos científicos.
A tese está organizada nas seguintes seções: (1) Introdução, que aborda o referencial teórico que norteia as hipóteses do presente trabalho; (2) Objetivos, em que são expostos os propósitos do estudo; (3) Resultados, que contempla os manuscritos elaborados; (4) Considerações finais, que discorre sobre a síntese dos principais resultados do estudo.
O primeiro manuscrito original intitulado “The association between a diet with higher inflammatory potential and sleep parameters in sleep apnea patients”, foi elaborado em conjunto com parceiros que atuam na área de consumo alimentar e sono em instituições internacionais e nacionais. O artigo teve como objetivo analisar a associação entre os efeitos de uma dieta potencialmente inflamatória e paramêtros do sono em indivíduos com síndrome da apneia obstrutiva do sono (SAOS). Observou-se que a dieta com características mais inflamatórias associou-se com a sonolência diurna. Entretanto, não foram encontradas associações dessa dieta com os estágios do sono ou a severidade da apneia. Em adição, o instrumento utilizado para pontuar o potencial inflamatório da dieta demonstrou eficácia em predizer alguns paramêtros do sono em alguns grupos da população avaliada, como a severidade da apneia. O artigo foi submetido à revista The Journal of Nutrition e aguarda avaliação dos revisores.
1. Introdução
A Síndrome da Apneia Obstrutiva do Sono (SAOS) é considerada um problema de saúde pública com elevadas taxas de morbidade e mortalidade (MAHBOUB et al., 2013; PEPPARD et al., 2013). Juntamente a esse fator, a alta prevalência de indivíduos que apresentam a doença sem diagnóstico confirmado torna-se um forte incentivo para melhorar o reconhecimento dessa doença na comunidade (REDLINE, 2017).
na literatura, estudos que avaliem o padrão alimentar de apneicos e sua possível relação com os padrões do sono e severidade da apneia devem ser incentivados.
2. Referencial teórico
2.1. Síndrome da Apneia Obstrutiva do Sono
A SAOS é caracterizada por apneia recorrente associada a mudanças cíclicas na saturação da oxihemoglobina, além de alterações no padrão cardíaco e na pressão sanguínea durante o sono (RIEDL et al., 2014). A SAOS é causada pelo fechamento das vias aéreas superiores, o que desencadeia uma parada do fluxo aéreo nasal e bucal, com manutenção do esforço ventilatório pela musculatura inspiratória, incluindo os movimentos toracoabdominais (APPLETON et al., 2015; PAIVA; ATTARIAN, 2014). Essas pausas respiratórias que se interpõem aos roncos podem resultar em engasgos, sensação de sufocamento, vocalizações ou breves despertares. Como resultado, ocorre fragmentação do sono e consequente sonolência diurna, cansaço, redução da atenção e do desempenho cognitivo (ALGHANIM et al., 2008).
A fisiopatologia da SAOS não pode ser vista isoladamente como uma disfunção da musculatura de vias aéreas superiores (RIHA; GISLASSON; DIEFENBACH, 2009; VIEGAS, 2010). Estudos sugerem que a etiologia para a transição de ronco habitual para o desenvolvimento da síndrome ainda não está clara e envolve fatores como idade, obesidade, sexo, etnicidade, menopausa, consumo de álcool e sedativos, restrição do sono, anormalidades craniofaciais (principalmente envolvendo anormalidades mandibulares), bem como a presença de outras comorbidades (ANDERSEN et al., 2011; RIHA; GISLASSON; DIEFENBACH, 2009; VIEGAS, 2010; WITTERT, 2014). Fatores atribuídos à alimentação também foram observados como um agravante à severidade da apneia e à qualidade do sono (CAO et al., 2016; TRAKADA et al., 2014); entretanto, a associação entre alimentação e severidade da apneia parece ser mediada pelo ganho de peso, ao contrário dos outros paramêtros do sono que tiveram efeito direto do consumo de nutrientes (CAO et al., 2016).
padrão-ouro para o diagnóstico de distúrbios do sono e consiste no registro de diversos parâmetros fisiológicos, como eletroencefalografia, eletro-oculograma, eletrocardiografia, eletromiografia submentoniana e tibial anterior, fluxo aéreo nasal por cânula e oronasal por sensor térmico, movimentos torácicos e abdominais, saturação da oxihemoglobina por oxímetro digital, registro do ronco por microfone e monitorização do decúbito (GARCIA et al., 2010). De acordo com a International Classification of Sleep Disorder (ICSD-3), o diagnóstico de SAOS requer cinco ou mais enventos obstrutivos na respiração por hora de sono durante a PSG (AMERICAN ACADEMY OF SLEEP MEDICINE - AASM, 1999). Se os pacientes estiverem com índice de apneia-hipopneia (IAH) entre ≥5 e ≤14,9, precisarão apresentar ao menos um dos seguintes sintomas para serem diagnosticados com SAOS: ronco alto, sonolência diurna, fadiga, interrupções respiratórias durante o sono e comorbidades associadas; caso apresentem IAH≥ 15, os indivíduos já serão diagnosticados com apneia do sono, independente dos sintomas (AASM, 1999). De acordo com a AASM (1999), considera-se SAOS de grau leve o IAH entre cinco e 15, moderado entre 15 e 30 e considera-severo considera-se o valor for maior que 30.
Em todo o mundo, a prevalência estimada de SAOS varia de 2 a 33% da população (MAHBOUB et al., 2013; PEPPARD et al., 2013; TUFIK et al., 2010), dependendo da metodologia do estudo. Em associação à sonolência diurna, a prevalência varia entre 3% a 7% em homens adultos e 2% a 5% em mulheres (PUNJABI, 2008). Entretanto, quando a SAOS é definida pelo valor do IAH igual ou superior a 5 eventos/hora, a prevalência é maior, sendo 33,9% em homens e 17,4% em mulheres (PEPPARD et al., 2013). No Brasil,um estudo populacional na cidade de São Paulo observou que 32,8% dos indivíduos possuiam SAOS, sendo a maior prevalência em homens (TUFIK et al., 2010). Além de sua significativa prevalência, a SAOS vem sendo considerada como um dos grandes problemas de saúde pública da atualidade, devido ser reconhecida como uma das importantes causas de morbidade e mortalidade por sua associação a doenças cardiovasculares, metabólicas, neurológicas e alterações endoteliais (DEAK; KIRSCH, 2014; NICKERSON et al., 2015; PEPPARD et al., 2013; TUFIK et al., 2010).
2.2. A relação da SAOS com as doenças
(TUFIK et al., 2010; YOUNG; PEPPARD; GOTTLIEB, 2002). Entretanto, essa associação parece ser bidirecional, ou seja, a apneia do sono pode levar ao ganho de peso, assim como o ganho de peso pode aumentar o risco de SAOS (PILLAR; SHEHADEH, 2008). Nesse sentido, sabe-se que a obesidade é um fator de risco bem reconhecido para os distúrbios respiratórios do sono, sendo geralmente aceito que homens de meia-idade, com excesso de peso e circunferência do pescoço aumentada são especialmente predispostos a esses distúrbios (SCHWARTZ et al., 2010). Isso pode ocorrer pela elevada deposição de gordura, principalmente no pescoço e no abdômen superior, que resulta em uma redução do calibre nasofaríngeo que, se significativo, pode levar à hipoventilação devido à reduzida complacência da parede torácica; outro fator é devido à leptina, normalmente elevada em indivíduos com excesso de peso e acúmulo de gordura visceral, a qual pode afetar a regulação do centro respiratório (KAPSIMALIS et al., 2008). Devido à essa estreita relação entre SAOS e obesidade, ainda é controverso na literatura o real impacto da SAOS, independente do excesso de peso, em todas as doenças já relacionadas à ela.
A prevalência de SAOS em pacientes com diabetes tipo 2 é de aproximadamente 71% e cerca de 19 milhões de diabéticos podem tê-la não tratada ou não diagnosticada (ARONSOHN et al., 2010). Evidências sugerem que os distúrbios do sono, como a SAOS, estão associadas a um ineficaz controle glicêmico e à diabetes tipo 2 (FREDHEIM et al., 2011; HEFFNER et al., 2012; LARCHER et al., 2015; LECOMTE et al., 2013), independente do peso corporal (NAGAYOSHI et al., 2016). Há vários mecanismos fisiológicos ligados à associação do sono com a regulação da glicose, como o aumento da atividade do sistema nervoso simpático, da secreção de cortisol, inflamação e mudanças nos hormônios reguladores de apetite e do crescimento (LARCHER et al., 2015; REUTRAKUL; VAN CAUTER, 2014).
associação seria o aumento da pressão arterial decorrente da SAOS (MENG et al., 2016), a qual poderia resultar em piora da função renal, já que a hipertensão é um dos mais importantes fatores de risco para o desenvolvimento de doença renal crônica (ARCHONTOGEORGIS et al., 2016). Além disso, Kanbay et al. (2012) sugerem que o efeito da hipopneia decorrente da SAOS poderia acarretar em fatores que auxiliariam na progressão da doença renal em pacientes com SAOS, como a dessaturação do oxigênio durante o sono, o aumento dos níveis de citocinas e a resistência à insulina.
Os frequentes despertares associados à SAOS, os quais resultam na fragmentação crônica do sono, normalmente ocorrem juntamente com mudanças na pressão de oxigênio, a qual pode causar momentos de isquemia e reperfusão. A redução do tempo de sono ocasionada por essa fragmentação pode resultar em prejuízos na aprendizagem e na memória, pois a quantidade e a qualidade do tempo de sono facilita a manutenção da função e saúde neurocognitiva, a qual ultimamente contribui para baixas taxas de morbidade e mortalidade (FANG et al., 2014; MARKWALD et al., 2013; STIEFEL et al., 2013; ZIELINSKI et al., 2013). Foi relatado também que a hipóxia intermitente afeta o córtex cerebral (BURCKHARDT et al., 2008) e que a hipóxia crônica recorrente induz à lesão irreversível em grupos neuronais ativos na vigília (ZHU et al., 2007). Entretanto, Ayalon et al. (2009) sugerem que a redução do grau de alerta e a lentificação do tempo de resposta estão mais fortemente associados à fragmentação do sono do que a hipóxia.
WATTERS, 2013) e, também, devido à ativação da xantina oxidase, a qual gera ânions superóxido e peróxido de hidrogênio, ambos contribuidores do estresse oxidativo (BAGUET et al., 2012). O inadequado suprimento de oxigênio também pode implicar na formação de adenosina trifosfato, a qual posteriormente irá se degradar em adenosina difosfato e monofosfato (SAITO et al., 2002). Esse processo causa a liberação de intermediários de purina (adenosina, inosina, hipoxantina e xantina), a qual resultam em uma superprodução de ácido úrico, que é o produto final do catabolismo de purinas. A hiperuricemia tem sido associada à falência cardíaca, ao processo aterogênico e à hipertensão arterial, além de ser considerada um preditor independente para a mortalidade em pacientes com alto risco de doenças cardiovasculares (IOACHIMESCU et al., 2008).
coronariana, arritmias e acidente vascular encefálico (AYAS; TAYLOR; LAHER, 2016; DRAGER et al., 2009; 2010).
Embora a etiologia da SAOS seja incerta, a presença da inflamação local intensa e sistêmica nesses pacientes é bem consolidada, a qual pode implicar na patogênese das doenças associadas à apneia do sono (PATEL et al., 2009; TARANTINO et al., 2014). Estudos têm demonstrado uma associação entre marcadores inflamatórios e obesidade (GUILLEMINAULT; KIRISOGLU; OHAYON, 2004; RYAN et al., 2007; SHARMA et al., 2008), síndrome metabólica (SHIINA et al., 2006) e obesidade visceral (VGONTZAS et al., 2000) em pacientes com SAOS. Entretanto, a magnitude da resposta inflamatória sistêmica parece estar relacionada com a severidade da apneia (ELTZSCHIG; CARMELIET, 2011; KRITIKOU et al., 2014; SHAMSUZZAMAN et al. 2002; YOKOE et al., 2003), independente da presença de comorbidades frequentemente associadas à SAOS como a obesidade (BROWN; PATIL, 2010; VGONTZAS et al., 1997; YAMAUCHI; KIMURA, 2008). Entretanto, ainda não é claro se a inflamação é o resultado ou causa dessas patologias, mas parece ser um relacionamento bidirecional (CONWELL; LEE-CHIONG, 2013).
2.3. SAOS e inflamação
A inflamação é uma parte normal da resposta imune, a qual é necessária para a cicatrização de feridas e combate de infecções (LIBBY, 2007). Entretanto, a repetição de injúrias, como uso de tabaco, infecção crônica, obesidade e fragmentação do sono podem resultar em uma inflamação sistêmica crônica (AHMADI-ABHARI et al., 2013; KEIBEL; SINGH; SHARMA, 2009; LIBBY, 2007).
Em situações de fragmentação do sono, a qual é comum em pacientes com SAOS, observa-se uma resposta imune caracterizada por um aumento no número de leucócitos, monócitos, granulócitos, células natural killers e diminuição da imunoregulação de citocinas, como IL 4 e 10 (DUMAINE; ASHLEY, 2015). Uma única noite de sono insuficiente aumenta a expressão gênica de citocinas inflamatórias, como IL 1 e 6 e TNF-α em ratos e humanos (ALVES et al.,2013). A restrição do sono também estimula mudanças em outras concentrações de proteínas e hormônios, o que conduz mudanças no metabolismo e no estresse, como alterações na concentração de hormônios da saciedade, como leptina, grelina e peptídeo YY (BADRAN; AYAS; LAHER, 2014; MARTÍNEZ; CASITAS; GARCÍA-RÍO, 2015; SHECHTER, 2017), bem como em marcadores de peroxidação lipídica (LAVIE L; VISHNEVSKY; LAVIE P, 2004). Além de desencadearem o processo de inflamação, a IL-1 e o TNF-α têm papel central nas vias de ativação do sono e de outras citocinas, como IL 10, 6, 2 e 4, em indivíduos com SAOS (VGONTZAS; BIXLER; CHROUSOS, 2005).
Estudos de intervenção foram realizados em apneicos para avaliar a interferência de tratamentos em parâmetros inflamatórios. Em estudo de Chirinos et al. (2014) com duração de 24 semanas, comparou-se os resultados de diferentes intervenções, como perda de peso, continuous positive airway pressure (CPAP) ou as duas intervenções em conjunto, sobre os níveis de PCR no plasma. O CPAP sozinho não teve efeito na PCR ultra sensível, enquanto a perda de peso isolada e a combinação das intervenções promoveram a diminuição desse marcador. Estudos clínicos não demonstraram modificações nos marcadores inflamatórios com o uso de CPAP para tratamento da SAOS (GOTTLIEB et al., 2014; KRITIKOU et al., 2014; STRADLING et al., 2015). A ausência dos efeitos do CPAP nesses marcadores pode ser explicado pelo fato de o CPAP isoladamente não diminuir a gordura visceral, a qual é a fonte de inflamação nesses pacientes (KRITIKOU et al., 2014). Por isso, intervenções que contemplem um conjunto de fatores, dentre eles a orientação nutricional, podem auxiliar os indivíduos com SAOS a terem mais benefícios em seu tratamento, visto que o excesso de peso e a gordura corporal são descritos como fatores de risco para a severidade da apneia e a inflamação.
propostas de estudos para avaliar a relação da ingestão alimentar com essa síndrome poderia agregar importante valor à literatura.
2.4. Ingestão alimentar e inflamação
Pesquisas sobre o papel da dieta na inflamação sugerem que a ingestão alimentar representa um complexo conjunto de exposições de efeito acumulativo, a qual modifica a resposta inflamatória do corpo e os resultados na saúde (AHLUWALIA et al., 2013; SHIVAPPA et al, 2014a). Atualmente, o consumo da dieta mediterrânea (rica em frutas, vegetais, peixes e azeite de oliva) tem sido associada a baixos níveis de inflamação sistêmica. Em contrapartida, o estilo de dieta Western (rico em gorduras, proteína e carboidratos simples) é tipicamente associado ao aumento da inflamação (AHLUWALIA et al., 2013; ESMAILLZADEH et al., 2007). Dietas com alto consumo de frutas e vegetais têm sido associadas a menores níveis de PCR (ESMAILLZADEH et al., 2006), bem como o maior consumo de nutrientes específicos também demonstraram associação a menores níveis de inflamação, como carboidratos complexos (KITABCHI et al., 2013), ômega 3 (FERRUCCI et al., 2006), fibras (MA et al., 2006), vitaminas E e C (BERTRAN et al., 2005; WANNAMETHEE et al., 2006) e β-caroteno (ERLINGER et al., 2001).
A dieta pró-inflamatória possui elevado consumo de nutrientes como gordura saturada, carboidrato, proteína e baixo consumo de ácidos graxos poli-insaturados, flavonoides e outros componentes alimentares (AHLUWALIA et al., 2013; ESMAILLZADEH et al., 2007). No Brasil, a evolução temporal da disponibilidade domiciliar de alimentos nas áreas metropolitanas, considerando o período 1974-2008, evidenciou um aumento na proporção de gorduras e diminuição de carboidratos na dieta, além de maior participação de embutidos, óleos e gorduras vegetais, biscoitos, refeições prontas, açúcar e refrigerantes. Já a participação de frutas, legumes e verduras permaneceu relativamente constante durante todo o período, com valores muito aquém das recomendações (LEVY et al., 2012).
previamente descrito (SHIVAPPA et al., 2014b), o qual conta com dados de 45 parâmetros alimentares (Tabela 1).
Tabela 1. Parâmetros alimentares incluídos no índice inflamatório da dieta e valores de ingestão do conjunto de dados da coleta global.
Paramêtro alimentar Fator calculado com base no
número de artigos Pontuação individual do efeito inflamatório bruto Pontuação global do efeito inflamatório* Ingestão média diária global (unidades/dia)† D.P.†
Alecrim (mg) 9 -0.333 -0.013 1.00 15.00
Ácidos graxos monoinsaturados (g)
106 -0.019 -0.009 27.0 6.1
Ácidos graxos poli-insaturados (g)
4002 -0.337 -0.337 13.88 3.76
Ácido fólico (μg) 217 -0.207 -0.190 273.0 70.7
Açafrão (g) 33 -1.000 -0.140 0.37 1.78
Álcool (g) 417 -0.278 -0.278 13.98 3.72
Alho (g) 277 -0.412 -0.412 4.35 2.90
Antocianidinas (mg) 69 -0.449 -0.131 18.05 21.14
Β-caroteno (μg) 401 -0.584 -0.584 3718 1720
Cafeína (g) 209 -0.124 -0.110 8.05 6.67
Carboidratos (g) 211 0.109 0.097 272.2 40.0
Cebola (g) 145 -0.490 -0.301 35.9 18.4
Chá verde/preto (g) 735 -0.536 -0.536 1.69 1.53
Colesterol (mg) 75 0.347 0.110 279.4 51.2
Cúrcuma (mg) 814 -0.785 -0.785 533.6 754.3
Energia (kcal) 245 0.180 0.180 2056 338
Eugenol (mg) 38 -0.868 -0.140 0.01 0.08
Flavan-3-ol (mg) 521 -0.415 -0.415 95.8 85.9
Flavonas (mg) 318 -0.616 -0.616 1.55 0.07
Flavonois (mg) 887 -0.467 -0.467 17.70 6.79
Flavononas (mg) 65 -0.908 -0.250 11.70 3.82
Ferro (mg) 619 -0.032 0.032 13.35 3.71
Fibras (g) 261 -0.663 -0.663 18.8 4.9
Gengibre (g) 182 -0.588 -0.453 59.0 63.2
Gordura saturada (g) 205 0.429 0.373 28.6 8.0
Gordura total (g) 443 0.298 0.298 71.4 19.4
Gordura trans (g) 125 0.432 0.229 3.15 3.75
Isoflavonas (mg) 484 -0.593 -0.593 1.20 0.20
Magnésio (mg) 351 -0.484 -0.484 310.1 139.4
Niacina (mg) 58 -1.000 -0.246 25.90 11.77
n-3 ácidos graxos (g) 2588 -0.436 -0.436 1.06 1.06
n-6 ácidos graxos (g) 924 -0.159 -0.159 10.80 7.50
Pimenta (g) 78 -0.397 -0.131 10.00 7.07
Proteína (g) 102 0.049 0.021 79.4 13.9
Riboflavina (mg) 22 -0.727 -0.068 1.70 0.79
Selênio (μg) 372 -0.191 -0.191 67.0 25.1
Tiamina (mg) 65 -0.354 -0.098 1.70 0.66
Tomilho/Orégano (mg) 24 -1.000 -0.102 0.33 0.99
Vitamina A (RE) 663 -0.401 -0.401 983.9 518.6
Vitamina B6 (mg) 227 -0.379 -0.365 1.47 0.74
Vitamina C (mg) 733 -0.424 -0.424 118.2 43.46
Vitamina D (μg) 996 -0.446 -0.446 6.26 2.21
Vitamina E (mg) 1495 -0.419 -0.419 8.73 1.49
Zinco (mg) 1036 -0.313 -0.313 9.84 2.19
Diversos estudos analisaram a associação entre o potencial inflamatório da dieta e paramêtros inflamatórios (CAVICCHIA et al., 2009; SHIVAPPA et al., 2015; WIRTH et al., 2014; WOOD et al., 2015), bem como a sua associação a doenças (ANTWI et al., 2018; SHIVAPPA et al., 2016a,b; VAHID et al., 2018; WOOD et al. 2015). Em estudo com policiais, encontrou-se que uma dieta com característica pró-inflamatória foi associada ao aumento dos níveis de PCR e à intolerância à glicose, componentes da síndrome metabólica (WIRTH et al., 2014). Em estudo caso-controle de Wood et al. (2015), encontrou-se que o potencial inflamatório da dieta foi associado ao aumento da inflamação sistêmica e à uma piora na função pulmonar em uma população de asmáticos, sendo que indivíduos com dietas mais pró-inflamatórias possuiam 70% mais chances de desenvolver asma em relação aos com dietas menos inflamatórias. Diversos tipos de câncer também foram associados positivamente à dieta com potencial inflamatório, como o câncer pancreático (ANTWI et al., 2018), gástrico (VAHID et al., 2018), hepatocelular (SHIVAPPA et al., 2016), endometrial (SHIVAPPA et al., 2016) e coloretal (HARMON et al., 2017; SHARMA et al., 2017; WIRTH et al., 2015). Em adição, Veronese et al. (2018) também encontraram que mulheres que consumiam dietas com características mais inflamatórias tiveram maior predisposição a fraturas ósseas. Porém, mesmo com os diversos resultados na literatura sobre a influência do potencial inflamatório da dieta em diversas doenças, não há estudos que associem esse padrão alimentar aos distúrbios do sono, como a SAOS. Ademais, pesquisas que avaliaram a ingestão alimentar desses pacientes são escassas na literatura científica.
2.5. Ingestão alimentar e sono
dificuldades em iniciar o sono, mas a alta quantidade desse nutriente (≥19% vs < 19%) também foi associada à dificuldade em manter o sono em adultos (TANAKA et al., 2013).
Foi encontrado que uma refeição gordurosa pode agravar a severidade da apneia em pacientes apneicos com sobrepeso e obesidade (TRAKADA et al., 2014). Em adição, um estudo crossover randomizado encontrou que baixa quantidade de fibras e alta ingestão de açúcar e gordura saturada foram associados a um sono mais leve e com mais despertares em adultos saudáveis, jovens e de meia-idade (ST-ONGE et al., 2016). Cao et al. (2016) em estudo com apneicos, encontraram que refeições ricas em gordura estavam positivamente associadas à sonolência diurna. Entretanto, outros estudos sugerem que não há associação entre a ingestão de gordura e a qualidade do sono (YAMAGUCHI et al., 2013) ou sintomas de insônia (TANAKA et al., 2013).
Embora os mecanismos das associações entre consumo de nutrientes e paramêtros do sono ainda permaneçam incertos, algumas hipóteses foram sugeridas na literatura. Os nutrientes podem afetar o sono por meio de alterações circadianas responsáveis pela regulação hormonal, pelo sistema nervoso central e metabólico (KOHSAKA et al., 2007; PEUHKURI; SIHVOLA; KORPELA, 2012), principalmente quando o consumo alimentar ocorre próximo ao horário de dormir. Alguns estudos referem que o horário das refeições podem interferir na qualidade do sono, uma vez que horários de comer tardios podem gerar um desalinhamento no ritmo circadiano por induzir uma dessincronização interna, a qual pode gerar disfunções metabólicas (SCHEER et al., 2009) que interferem em menor duração do tempo total de sono, alteração no tempo dos estágios do sono e aumento de peso e adiposidade (BANDÍN et al. 2015; GARAULET et al., 2013; GILL; PANDA, 2015), os quais podem influenciar na severidade da apneia. Entretanto, os estudos que avaliaram os mecanismos que levam os nutrientes e o horário das refeições a impactar nos paramêtros do sono ainda são inconclusivos, sendo que ainda é muito escassa a abordagem da relação entre horário de comer e sono na literatura, visto que a maioria das pesquisas nessa área enfocam em alterações no ganho de peso e no tempo total de sono avaliado de forma subjetiva (BANDÍN et al. 2015; GARAULET et al., 2013; GILL; PANDA, 2015).
3. Objetivos
3.1 Objetivo Geral
Avaliar a associação entre potencial inflamatório da dieta, horário de comer e padrão de sono em pacientes com síndrome da apneia obstrutiva do sono.
3.2 Objetivos Específicos
- Caracterizar os indivíduos apneicos e não apneicos em relação às variáveis sócio-demográficas, físicas, de sono, alimentares e de atividade física.
- Estudar as associações entre o índice inflamatório da dieta e os paramêtros do sono (manuscrito 1).
4. Resultados
4.1 Primeiro manuscrito
The association between a diet with higher inflammatory potential and sleep
parameters in sleep apnea patients
Artigo submetido ao The Journal of Nutrition
Tássia VC Lopes1 Matheus ES Borba1 Raíssa VC Lopes2 Regina M Fisberg2 Samantha L Paim1 Vinicius V Teodoro1 Ioná Z Zimberg3 Lúcio B Araújo4 Nitin Shivappa5,6,7 James R. Hébert5,6,7 Cibele A Crispim1
1
School of Medicine. Federal University of Uberlandia, Uberlandia, Brazil; 2 School of Public Health.
University of Sao Paulo, Sao Paulo, Brazil; 3 Department of Psychobiology, Federal University of Sao
Paulo, Sao Paulo, Brazil; 4 Department of Statistics, Federal University of Uberlandia, Uberlandia, Brazil;
5
Cancer Prevention and Control Program, University of South Carolina, Columbia, USA; 6Department of
Epidemiology and Biostatistics, Arnold School of Public Health, University of South Carolina, Columbia,
Corresponding author: Cibele Aparecida Crispim, Phone/ Fax: +5534 3218-2084. E-mail: cibelecrispim@gmail.com. Address: Avenida Pará 1720 - Bloco 2U - Campus Umuarama - Bairro Umuarama - CEP: 38400-902. Uberlândia – MG – Brazil
List of all authors' last names: Lopes, Borba, Lopes, Fisberg, Paim, Teodoro, Zimberg, Araújo, Shivappa, Hébert, Crispim.
Word count for the entire manuscript: 3783
Number of figures: 1
Number of tables: 5
Supplementary data: no
Running title: The association between DII and sleep parameters
Financial Support: This work has been supported in part by Conselho Nacional de Desenvolvimento Científico e Tecnológico (CNPq) and Fundação de Amparo à Pesquisa de Minas Gerais (FAPEMIG).
Author disclosures: Dr. James R. Hébert owns controlling interest in Connecting
Health Innovations LLC (CHI), a company planning to license the right to his invention of the dietary inflammatory index (DII) from the University of South Carolina in order to develop computer and smart phone applications for patient counselling and dietary intervention in clinical settings. Dr. Nitin Shivappa is an employee of CHI. All the other authors have indicated no conflicts of interest.
Abbreviations: AASM- American Academy of Sleep Medicine, AHI- apnea-hypopnea index, AIC- Akaike Information Criterion, BMI- body mass index, CPAP- continuous positive airway pressure, CRP- C-reactive protein, DBP- diastolic blood pressure, DII-dietary inflammatory index, EEG- electroencephalogram, ESS- Epworth Sleepiness Scale, FFQ- food frequency questionnaire, GLzMM- Generalized Linear Models, ICAM- intercellular adhesion molecule 1, ICSD- International Classification of Sleep Disorders NC- neck circumference, IPAQ-SF- International Physical Activity
Abstract
Study objective: to analyze the association between the inflammatory potential of diet as determined by the dietary inflammatory index (DII®) and sleep parameters in
individuals with obstructive sleep apnea (OSA), as well as to evaluate the sensitivity and specificity of the DII at predicting sleep pattern.
Methods: Patients that were diagnosed with mild to severe OSA were included in the study (n=296). Sleep pattern was analyzed by polysomnography (PSG) and subjective parameters (sleep and fatigue questionnaires). The DII scores were calculated from a validated food frequency questionnaire. The ability of the DII at predicting sleep pattern was determined using the receiver operating characteristic(ROC) curve analysis. The DII values were categorized into quintiles for multiple comparisons using Generalized Linear Models to determine the effects of the DII on PSG and subjective sleep and fatigue parameters.
Results: DII scores were efficient at predicting apnea severity (p<0.05) and daytime sleepiness (p=0.02) in age stratification, as well as predicting REM latency in obese individuals (p=0.03). No significant associations were found between DII scores and the majority of sleep parameters including total sleep time (p=0.99), sleep efficiency
(p=0.99), sleep latency (p=0.91), REM latency (p=0.89), N1 (p=0.92), N2 (p=0.97), N3 (p=0.28), R sleep stage (p=0.92), and apnea severity (p=0.92). The DII was only
associated with daytime sleepiness; patients with a more pro-inflammatory diet (quintile 4) showed more subjective sleepiness than the group with a more anti-inflammatory diet (quintile 1) (Exp(B)= 0.470, CI= 0.222-0.994, p<0.05).
Conclusion: Findings from this study indicate that the DII could be sensitive and specific for predicting apnea severity in individuals commonly associated with OSA. Although the inflammatory potential of diet was not associated with most of the sleep parameters, it still could influence symptoms of OSA.
Introduction
Obstructive Sleep Apnea (OSA) is a worldwide public health problem (1–6). In Brazil, the prevalence estimate of OSA is 32.8% of the population (3). This disturbance is characterized by recurrent episodes of apneas associated with cyclic changes in oxyhemoglobin saturation, alterations in heart rate, and in blood pressure during sleep (7). The full pathogenesis of OSA is not clear; some studies suggest that in addition to mechanical factors in the airway, there may be an inflammatory etiology (8). Systemic inflammatory response mediators, such as coagulation factors (Factor VIII, Tissue factor), inter cell adhesion molecules (ICAM), C-reactive protein (CRP), and pro-inflammatory cytokines (particularly TNF-α, IL-1β, and IL-6), are up-regulated in individuals with OSA (9–11).
Previous studies have consistently found evidence that obesity, which is a state of low-grade chronic inflammation (12), is a well-established leading risk factor for OSA (13, 14). In this sense, the pattern of the diet of the individuals could enhance the risk of OSA or worsen the severity of OSA by increasing the chance of developing obesity (15, 16). Some studies have shown that dietary patterns, mainly those with higher inflammatory potential, could have a profound influence obesity (17, 18) and chronic inflammation (19–23). Accordingly, certain nutrients modify systemic inflammation, such as n-3 polyunsaturated fatty acids (24) and fiber (25), which have consistently shown anti-inflammatory activity, in contrast to high-fat meals, which have pro-inflammatory action (26).
The Dietary Inflammatory Index (DII®) was developed to estimate the
no information about the effect of a pro-inflammatory diet on sleep pattern and apnea severity in OSA individuals.
Considering the body of evidence on the influence of dietary pattern on
inflammation and obesity (17–22), the association of obesity and sleep apnea (13, 14), and higher levels of inflammation parameters in OSA patients (33), we hypothesized that a diet with a higher inflammatory potential could be associated with worse sleep pattern and apnea severity in these individuals. The main objective of this study was to analyze the association between the inflammatory potential of diet and sleep parameters in individuals with obstructive sleep apnea, as well as to evaluate the sensitivity and specificity of the DII in predicting sleep pattern and apnea severity.
Materials and Methods
Study Population
Patients with sleep complaints and that were suspected to have sleep apnea were referred by their physicians to a polysomnography (PSG) exam in a private sleep clinic where this cross-sectional study was conducted. Data collection was performed from August 2016 to March 2017. During the study period, volunteers were eligible to participate if they were aged from 18–60 years old, reported no previous apnea
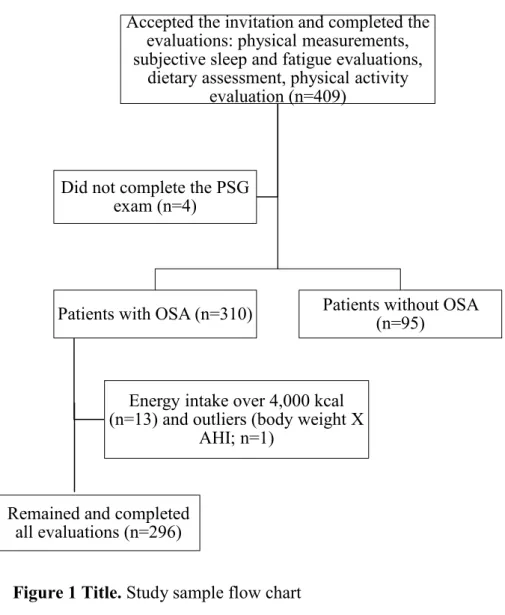
treatments such as surgery or continuous positive airway pressure (CPAP) therapy, had no previous diagnosis of sleep disorders, and did not take medications that could affect sleep. A sample size of 282 participants was established with post-hoc power of 72% using G*Power software with a specified significance level of 0.05 and a power of 90%. Of the 409 patients who agreed to participate in this research, 296 were included in the study and 113 were excluded (95 for having apnea-hypopnea index (AHI) < 5, 13 for energy consumption above 4,000 kcal, 4 for incomplete PSG, and 1 outlier (Body Mass Index (BMI) and AHI) (Figure 1).
This study was approved by the Ethics Committee of the Federal University of Uberlandia (protocol no. 57610416.7.0000.5152) and was conducted according to international ethical standards. An informed written consent was obtained from all volunteers before starting the study.
Figure 1 Title. Study sample flow chart. PSG: polysomnography; OSA: obstructive sleep apnea; AHI: apnea-hypopnea index.
Physical Measurements
Physical measurements were taken by trained staff using standardized methods (34,35) and included neck circumference (NC) at the thyroid cartilage level, waist circumference (WC) at the level of the umbilicus, body weight (kg), height (m), and systolic (SBP, mmHg) and diastolic blood pressure (DBP, mmHg). The participants
Accepted the invitation and completed the evaluations: physical measurements, subjective sleep and fatigue evaluations,
dietary assessment, physical activity evaluation (n=409)
Patients with OSA (n=310)
Energy intake over 4,000 kcal (n=13) and outliers (body weight X AHI;
n=1)
Remained and completed all evaluations (n=296)
Patients without OSA (n=95)
were weighed with light clothes while barefoot on a digital scale that measured to the nearest 0.1 kg. Height was measured using a stadiometer and the participant was positioned upright and relaxed, with their head on the Frankfurt plane. Circumference measurements were made using a flexible and inextensible measuring tape. Participants were classified according to BMI, which was calculated as the ratio of their weight and squared height (34). Diastolic and systolic blood pressures were measured twice in each participant using the left arm after ten minutes rest and the average of the two
measurements was used in our analyses.
Subjective Sleep and Fatigue Evaluations
Subjective sleep evaluations were obtained by questionnaires that evaluated daytime sleepiness, sleep quality, and fatigue. Daytime sleepiness was measured using the Epworth Sleepiness Scale (ESS) (36), a self-administered questionnaire with eight items that is designed to provide a measure of a subject’s propensity to fall asleep in a variety of situations. A total score of eight indicates excessive sleepiness (36). Sleep quality was assessed using the Pittsburgh Sleep Quality Index (PSQI) which includes 19 items and yields a score from 0 (good quality) to 21 (poor quality); a total sum greater than five indicates poor sleep quality (37). Fatigue was assessed using the Chalder Scale, a questionnaire with 11 items that are scored on a four-point scale from “less than usual (0)” to “much more than usual (3)”; the higher the summed score, the more
fatigued the individual (38). Polysomnography
define the sleep stages (39). Leg movements and EEG arousals were scored in agreement with the criteria established by the American Academy of Sleep Medicine (AASM) (39). Apneas were scored and classified according to the recommended respiratory rules for adults by the AASM Manual, and hypopneas were scored by the alternative rules (39).
OSA was diagnosed in accordance with the criteria of the International Classification of Sleep Disorders (ICSD-3) (40). Subjects were classified with OSA diagnosis if they had an AHI ≥ 15 or 5 ≤ AHI ≤ 14.9 and presented at least one of the following complaints: breathing interruptions during sleep, loud snoring, daytime sleepiness, and fatigue. The complaints were assessed according to Tufik et al. (3): breathing interruptions and loud snoring using the second and fifth questions of the Berlin Questionnaire for sleep apnea, respectively (41); daytime sleepiness using the Epworth Sleepiness Scale (36) and the eight questions of the PSQI (37); and fatigue using the Chalder Fatigue Scale (38).
Dietary Inflammatory Index
A validated semiquantitative food frequency questionnaire (FFQ)(42)was administered in person by trained interviewers at recruitment to assess habitual dietary intake of the study participants over the past 1 y. Questions about recent changes in eating habits, consumption of dietary supplements, and other important foods that the instrument did not cover were also included. The Nutrition Data System for Research (NDSR) software (version 2014, University of Minnesota, Minneapolis)was used to quantify the energy and nutrients consumed as obtained by the FFQ. Following this, these data were adjusted for energy intake using the residual method (43).
then multiplied by the respective inflammatory effect score of the food parameters (derived from a literature review and scoring of 1,943 ‘qualified’ articles) to obtain the subject’s food parameter-specific DII score. For the current FFQ, data were available for a total of twenty-seven food parameters: (energy (kcal); carbohydrates; protein; total fat; fiber; cholesterol; saturated, monounsaturated, polyunsaturated, and trans fatty; n-6 and n-3 fatty acids; thiamin; riboflavin; niacin; selenium; iron; magnesium; zinc; vitamins A, C, D, E, B6, and B12; alcohol; and caffeine). All of the food parameter-specific DII scores were then summed to create the overall DII score for each subject in the study. The greater the DII score, the more pro-inflammatory the diet, while more negative values represent more anti-inflammatory diets.
Physical Activity Level
The short-form of the International Physical Activity Questionnaire (IPAQ-SF), version 6, was used to evaluate physical activity (PA) level. This questionnaire was translated into Portuguese and validated by Matsudo et al. (44). Participants were considered physically active if they performed at least 150 minutes of PA per week, moderately active if they performed between 10 and 149 minutes of PA per week, and insufficiently active if they performed less than 10 minutes of PA per week.
Statistical Analysis
overweight, and obese), age (18–30 years old, 31–50 years old, and 51–60 years old), and sex (men and women).
To determine the effects of the DII on PSG and subjective sleep and fatigue parameters, Generalized Linear Models (GLzMM) were used. Individual tests were done for each PSG and subjective parameter (dependent variables) and quintiles of DII (independent variables) using gamma, linear, or tweedie distributions for continuous variables. The best model was chosen based on the Akaike Information Criterion (AIC). Ordinal and binary logistic distributions were used for categorical variables. To
establish possible confounders associated with each PSG and subjective parameters (dependent variables), independent multivariate logistic regression models were performed using backward stepwise elimination (p ≤ 0.15). In addition, collinearity diagnostics tests were done between these variables of adjustment. Individual tests also were conducted for each nutrient (dependent variables) for different quintiles of the DII (independent variables), using the same distributions cited before for continuous
variables to establish the effect of some food parameters in the DII; age, BMI, and sex were used as confounders. Multiple comparisons were performed using sequential Sidak post-hoctest when necessary. Trends also were tested for all of the variables across quintiles of DII score. All statistical analyses were performed using SPSS 20.0 (Chicago, IL, USA). For statistical significance, α error was set at 5%.
Results
Table 1. OSA participants’ characteristics according to DII quintiles
Note. Quintile ranges are as follows: Quintile 1 = Lowest to -2.369184; Quartile 2 = -2.369183 to -1.680988; Quartile 3: -1.680987 to -0.868230; Quartile 4 = -0.868229 to -0.230459; Quintile 5 = -0.230458 to highest. Age,physical measurements, and nutrients intake are presented by mean (interquartile range), multiple comparisons GLzMM; other variables are presented by%, Chi-square test. Protein, carbohydrates, and fat are adjusted for energy intake (kcal). Bold values represent p<0.05. *For continuous variables, p-value represents the difference between quintiles1 and 5; for categorical variables,
p-value represents the association between DII quintile and dependent variables Abbreviations: BMI, body mass index; SBP = systolic blood pressure; DBP = diastolic blood pressure.
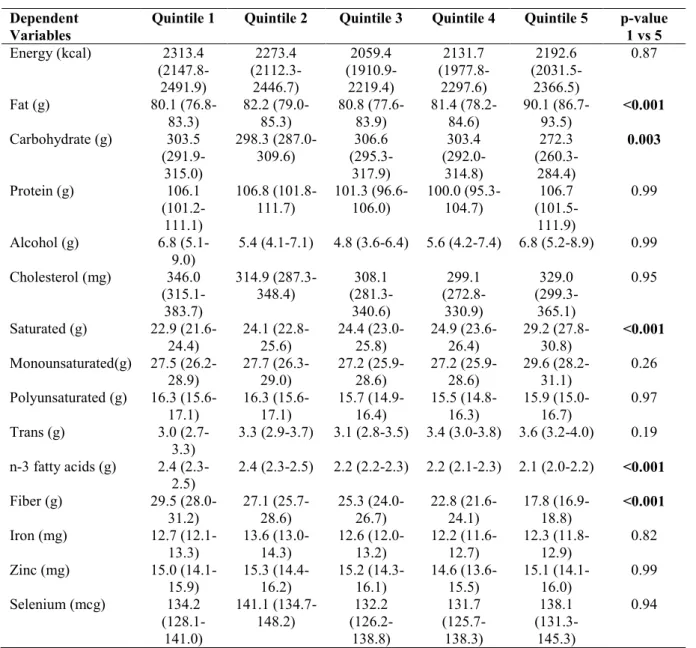
The means of energy and nutrient intake of OSA patients according to DII quintiles are described in Table 2. Sleep apnea patients with a more pro-inflammatory diet (quintile 5) had higher intakes of total fat, saturated fat, and carbohydrates than the group with a more anti-inflammatory diet (quintile 1) (total fat: 90.1 g vs 80.1 g; saturated fat: 29.2 g vs 22.9 g; carbohydrates: 303.5 g vs 272.3 g, respectively, p<0.001). On the other hand, the consumption of n-3 fatty acids and fiber were significantly lower in quintile 5 than in quintile 1 (n-3 fatty acids: 2.1 g vs 2.4; fiber: 17.8 g vs 29.5 g, respectively, p<0.001). No significant differences were found for any other parameters.
Quintile 1 (n=59) Quintile 2 (n=59) Quintile 3 (n=60) Quintile 4 (n=59) Quintile 5 (n=59) p-value* Age (years) 45.6 (43.1-48.1) 43.1 (40.6-45.7) 40.3 (37.8-42.8) 38.5 (36.0-41.0) 38.3 (35.8-40.9) 0.001 Sex (%)
Men 45.8 61 68.3 66.1 79.7 0.023
Marital status
With partner 70.5 72.2 73.2 72.9 70.0 0.57
Monthly household income (R$)
> 2100 88.1 86.4 85.0 81.4 89.8
Education
≤ High school 57.6 66.1 60.0 64.4 55.9 0.72
Graduated 23.7 20.3 21.7 25.4 28.8
Post-graduate 18.6 13.6 18.3 10.2 15.3
Smoking habits (%)
Yes 11.9 8.5 8.3 11.9 16.9 0.49
Alcohol consumption (%)
Yes 52.5 54.2 63.3 55.9 64.4 0.46
Physical activity level (%)
Insufficiently active 52.5 79.7 8.3 1.7 5.1 0.13
Moderately active 39.0 20.3 68.3 66.1 69.5
Active 8.5 0.0 23.3 32.2 25.4
Physical measurements
BMI(kg/m2) 30.7 (29.5-32.1) 31.0 (29.7-32.3) 30.9 (29.6-32.2) 31.1 (29.8-32.4) 31.5 (30.2-32.8) 0.99
Waist
circumference (cm)
101.8 (98.8-104.9) 102.5 (99.4-105.6) 102.7 (99.7-105.8) 104.5 (101.4-107.7) 105.6 (102.5-108.8) 0.62
Neck circumference (cm)
38.4 (37.4-39.3) 38.8 (37.9-39.8) 39.7 (38.7-40.7) 39.2 (38.2-40.2) 40.6 (39.6-41.6) 0.02
Table 2. Adjusted mean (95% Confidence Interval) of energy and nutrient intake by DII quintiles
Dependent Variables
Quintile 1 Quintile 2 Quintile 3 Quintile 4 Quintile 5 p-value
1 vs 5
Energy (kcal) 2313.4
(2147.8-2491.9) 2273.4 (2112.3-2446.7) 2059.4 (1910.9-2219.4) 2131.7 (1977.8-2297.6) 2192.6 (2031.5-2366.5) 0.87
Fat (g) 80.1
(76.8-83.3) 82.2 (79.0-85.3) 80.8 (77.6-83.9) 81.4 (78.2-84.6) 90.1 (86.7-93.5) <0.001
Carbohydrate (g) 303.5 (291.9-315.0) 298.3 (287.0-309.6) 306.6 (295.3-317.9) 303.4 (292.0-314.8) 272.3 (260.3-284.4) 0.003
Protein (g) 106.1
(101.2-111.1) 106.8 (101.8-111.7) 101.3 (96.6-106.0) 100.0 (95.3-104.7) 106.7 (101.5-111.9) 0.99
Alcohol (g) 6.8
(5.1-9.0)
5.4 (4.1-7.1) 4.8 (3.6-6.4) 5.6 (4.2-7.4) 6.8 (5.2-8.9) 0.99
Cholesterol (mg) 346.0 (315.1-383.7) 314.9 (287.3-348.4) 308.1 (281.3-340.6) 299.1 (272.8-330.9) 329.0 (299.3-365.1) 0.95
Saturated (g) 22.9 (21.6-24.4) 24.1 (22.8-25.6) 24.4 (23.0-25.8) 24.9 (23.6-26.4) 29.2 (27.8-30.8) <0.001
Monounsaturated(g) 27.5 (26.2-28.9) 27.7 (26.3-29.0) 27.2 (25.9-28.6) 27.2 (25.9-28.6) 29.6 (28.2-31.1) 0.26
Polyunsaturated (g) 16.3 (15.6-17.1) 16.3 (15.6-17.1) 15.7 (14.9-16.4) 15.5 (14.8-16.3) 15.9 (15.0-16.7) 0.97
Trans (g) 3.0
(2.7-3.3)
3.3 (2.9-3.7) 3.1 (2.8-3.5) 3.4 (3.0-3.8) 3.6 (3.2-4.0) 0.19
n-3 fatty acids (g) 2.4 (2.3-2.5)
2.4 (2.3-2.5) 2.2 (2.2-2.3) 2.2 (2.1-2.3) 2.1 (2.0-2.2) <0.001
Fiber (g) 29.5
(28.0-31.2) 27.1 (25.7-28.6) 25.3 (24.0-26.7) 22.8 (21.6-24.1) 17.8 (16.9-18.8) <0.001
Iron (mg) 12.7
(12.1-13.3) 13.6 (13.0-14.3) 12.6 (12.0-13.2) 12.2 (11.6-12.7) 12.3 (11.8-12.9) 0.82
Zinc (mg) 15.0
(14.1-15.9) 15.3 (14.4-16.2) 15.2 (14.3-16.1) 14.6 (13.6-15.5) 15.1 (14.1-16.0) 0.99
Selenium (mcg) 134.2
(128.1-141.0) 141.1 (134.7-148.2) 132.2 (126.2-138.8) 131.7 (125.7-138.3) 138.1 (131.3-145.3) 0.94
Note. Model adjust: age, BMI and sex.Quintile ranges are as follows: Quintile 1 = 4.37 to 2.37; Quartile 2 = 2.36 to 1.68; Quartile 3: -1.67 to -0.87; Quartile 4 = -0.86 to -0.23; Quintile 5 = -0.22 to 3.41. Abbreviations: DII, Dietary Inflammatory Index; CI, confidence interval. Bold values represent p <0.05
Table 3. ROC curve for the ability of DII to predict a worse sleep pattern and apnea severity in stratified groups
PSG variables
TST (min) Sleep efficiency (%) Sleep latency (min) REM latency (min) WASO (min)
N1 (%TST) N2 (%TST) N3 (%TST) R sleep (%TST)
AHI Poor sleep quality
Daytime sleepiness
Fatigue
AUC AUC AUC AUC AUC AUC AUC AUC AUC AUC AUC AUC AUC
Non stratification All 0.52
(0.44-0.59) 0.56 (0.44-0.68) 0.56 (0.37-0.75) 0.54 (0.46-0.61) 0.52 (0.45-0.59) 0.54 (0.47-0.62) 0.51 (0.43-0.58) 0.54 (0.47-0.61) 0.56 (0.47-0.65) 0.52 (0.45-0.59) 0.54 (0.46-0.61) 0.51 (0.44-0.58) 0.52 (0.45-0.58) BMI Eutrophic 0.49
(0.24-0.74) 0.11 (0.00-0.22) 0.85 (0.68-1.00) 0.56 (0.34-0.78) 0.51 (0.28-0.73)
0.41 (0.18-0.64) 0.53 (0.30-0.76) 0.55 (0.31-0.80) 0.74 (0.49-0.99) 0.54 (0.32-0.76) 0.44 (0.19-0.68) 0.41 (0.20-0.62) 0.38 (0.17-0.59)
Overweight 0.53 (0.41-0.65) 0.57 (0.40-0.73) 0.60 (0.51-0.70) 0.42 (0.31-0.54) 0.52 (0.40-0.63) 0.50 (0.38-0.62) 0.44 (0.31-0.56) 0.54 (0.41-0.66) 0.48 (0.33-0.62) 0.52 (0.41-0.64) 0.60 (0.48-0.72) 0.55 (0.44-0.67) 0.58 (0.46-0.69)
Obesity 0.52 (0.41-0.63) 0.60 (0.42-0.78) 0.45 (0.22-0.69) 0.62 (0.52-0.71) 0.54 (0.45-0.64) 0.60 (0.50-0.70) 0.53 (0.43-0.63) 0.55 (0.45-0.64) 0.58 (0.46-0.70) 0.52 (0.43-0.62) 0.52 (0.42-0.63) 0.52 (0.43-0.61) 0.48 (0.39-0.58) Age
18-30 y 0.58 (0.40-0.77) 0.63 (0.35-0.92) 0.52 (0.26-0.78) 0.54 (0.37-0.71) 0.50 (0.33-0.67) 0.60 (0.44-0.76) 0.46 (0.28-0.65) 0.40 (0.22-0.58) 0.44 (0.22-0.58) 0.54 (0.37-0.71) 0.63 (0.47-0.79) 0.71 (0.56-0.86)
0.58 (0.41-0.75)
31-50 y 0.47 (0.37-0.56) 0.57 (0.42-0.72) 0.57 (0.27-0.87) 0.57 (0.47-0.66) 0.54 (0.45-0.63)
0.50 (0.39-0.60) 0.53 (0.44-0.63) 0.53 (0.43-0.62) 0.57 (0.45-0.68) 0.54 (0.45-0.63) 0.54 (0.44-0.63) 0.54 (0.45-0.63) 0.51 (0.42-0.59)
51-60 y 0.51 (0.31-0.71) 0.41 (0.12-0.70) 0.88 (0.74-1.00) 0.52 (0.36-0.68) 0.45 (0.31-0.60) 0.57 (0.43-0.72) 0.53 (0.39-0.68) 0.60 (0.45-0.74) 0.67 (0.51-0.82) 0.35 (0.21-0.49) 0.49 (0.33-0.65) 0.37 (0.23-0.51) 0.44 (0.28-0.60) Sex Women 0.53
(0.39-0.66) 0.55 (0.32-0.77) 0.67 (0.42-0.93) 0.50 (0.38-0.62) 0.51 (0.40-0.62)
0.50 (0.38-0.62) 0.44 (0.28-0.60) 0.58 (0.44-0.72) 0.56 (0.43-0.69) 0.61 (0.50-0.72) 0.50 (0.37-0.63) 0.53 (0.42-0.64) 0.43 (0.29-0.56)
Men 0.50 (0.40-0.59) 0.55 (0.40-0.69) 0.54 (0.30-0.78) 0.56 (0.47-0.65) 0.53 (0.45-0.62) 0.59 (0.50-0.69) 0.49 (0.40-0.57) 0.56 (0.47-0.65) 0.52 (0.39-0.65) 0.54 (0.44-0.63) 0.55 (0.46-0.64) 0.52 (0.44-0.61) 0.48 (0.39-0.56)
Note: Data are presented as AUC values (95% confidence interval). Cut-off values for objective sleep parameters: Total sleep time: group 1< 420 min and group 2 ≥ 420 min; Sleep efficiency: group 1< 85% and group 2 ≥ 85%; Sleep latency: group 1≤ 30 min and group 2 > 30 min; R sleep latency: group 1≤ 120 min and group 2 > 120 min; WASO: group 1≤ 30 min and group 2 > 30 min; N1: group 1≤ 5% and group 2 > 5%; N2: group 1≤ 55% and group 2 > 55%; N3: group 1< 20% and group 2 ≥ 20%;R sleep: group 1< 20% and group 2 ≥ 20%;AHI: group 1 >5 and <15 and group 2 ≥ 15; Abbreviations: AUC, Area Under the Curve; DII, Dietary Inflammatory Index; TST, total sleep time; WASO, wakefulness after sleep onset; R sleep, rapid eye movement sleep stage; AHI, apnea–hypopnea index. Bold values represent p <0.05.
Sleep parameters (based on PSG) according to DII quintiles are presented in Table 4. Multiple comparisons showed no differences between OSA patients in DII quintiles 1 and 5.
Table 4. Effect of DII on objective sleep parameters (PSG)
Note: Data are presented as adjusted mean (95% Confidence Interval).Quintile ranges are as follows: Quintile 1 = -4.37 to -2.37; Quartile 2 = -2.36 to -1.68; Quartile 3: -1.67 to -0.87; Quartile 4 = -0.86 to -0.23; Quintile 5 = -0.22 to 3.41. Model adjust: Total sleep time: diastolic blood pressure, marital status, smoking habit, waist and neck circumferences, and carbohydrates intake; Sleep efficiency: physical activity, smoking habit, protein intake, and systolic blood pressure; Sleep latency: sex, body mass index, marital status, neck circumference, and AHI; R sleep latency: age, waist circumference, household income, education, systolic blood pressure, and fat intake; WASO: systolic blood pressure, work status, protein intake, and waist circumference; N1: sex, age, marital status, household income, work status, diastolic blood pressure, and protein intake; N2: AHI, sex, protein and carbohydrate intake; N3: age, sex, AHI, and smoking habits; R sleep: sex, napping, AHI, systolic blood pressure, alcohol consumption, and work status; AHI: age, education, alcohol consumption, and neck circumference. Abbreviations: DII, Dietary Inflammatory Index; TST, total sleep time; WASO, wakefulness after sleep onset; R sleep, rapid eye movement sleep stage; AHI, apnea–hypopnea index; CI, confidence interval. Bold values represent p <0.05
The effects of DII quintile on subjective sleep parameters were analyzed in Table 5. The DII was only associated with daytime sleepiness; patients with more pro-inflammatory diets (quintile 4) showed significantly more sleepiness than the group with an anti-inflammatory diet (quintile 1-referent) (Exp (B) = 0.47, CI= 0.22-0.99, p<0.05).
Dependent Variables
Quintile 1 Quintile 2 Quintile 3 Quintile 4 Quintile 5 p-value
1 vs 5
TST (min) 436.39
(421.79-450.98) 435.20 (420.00-450.40) 439.95 (424.51-455.38) 444.84 (429.41-460.28) 432.94 (417.45-448.38) 0.99
Sleep efficiency (%)
90.28 (88.30-92.26) 92.37 (90.18-94.56) 90.58 (88.55-92.61) 90.90 (88.81-92.99) 90.09 (88.08-92.10) 0.99
Sleep latency (min) 3.76
(2.36-5.98) 2.75 (1.69-4.45) 3.46 (2.23-5.35) 2.21 (1.35-3.63) 2.86 (1.76-4.64) 0.91
REM latency (min)
198.45 (170.10-231.53) 189.92 (162.31-222.22) 214.40 (184.64-248.96) 212.70 (183.32-246.78) 221.23 (190.12-257.42) 0.89 WASO (min) 41.54 (34.73-49.69) 31.07 (25.78-37.45) 39.16 (32.60-47.04) 38.92 (32.21-47.02) 38.82 (32.03-47.03) 0.99 N1 (%TST) 12.68 (9.90-16.25) 10.34 (8.01-13.36) 12.82 (9.87-16.66) 10.75 (8.35-13.83) 11.48 (8.80-14.97) 0.96 N2 (%TST) 48.10 (45.33-51.03) 46.98 (44.25-49.88) 49.28 (46.46-52.27) 47.67 (44.89-50.62) 46.19 (43.41-49.15) 0.97 N3 (%TST) 24.04 (20.81-27.27) 26.88 (23.58-30.17) 23.34 (20.02-26.65) 25.56 (22.28-28.83) 28.53 (25.26-31.80) 0.28
R sleep (%TST)
Table 5. Effects of DII quintiles on subjective sleep parameters
Dependent variables Exp(B) Wald Chi-Square 95% CI p-value Poor sleep quality
Quintile 1 1.0 (Referent) 1.0 (Referent) 1.0 (Referent) 1.0 (Referent)
Quintile 2 1.25 0.38 0.62 2.54 0.54
Quintile 3 0.95 0.02 0.47 1.92 0.88
Quintile 4 1.00 0.00 0.49 2.04 0.99
Quintile 5 0.61 1.97 0.31 1.21 0.16
Daytime sleepiness
Quintile 1 1.0 (Referent) 1.0 (Referent) 1.0 (Referent) 1.0 (Referent)
Quintile 2 0.55 2.54 0.26 1.15 0.11
Quintile 3 0.90 0.08 0.43 1.91 0.78
Quintile 4 0.47 3.90 0.22 0.99 <0.05
Quintile 5 1.44 0.85 0.66 3.13 0.36
Fatigue
Quintile 1 1.0 (Referent) 1.0 (Referent) 1.0 (Referent) 1.0 (Referent)
Quintile 2 0.55 1.90 0.23 1.29 0.17
Quintile 3 0.50 2.63 0.22 1.16 0.11
Quintile 4 1.51 0.82 0.62 3.69 0.36
Quintile 5 0.98 0.002 0.42 2.31 0.97
Note: Quintile ranges are as follows: Quintile 1 = -4.37 to -2.37; Quartile 2 = -2.36 to -1.68; Quartile 3: -1.67 to -0.87; Quartile 4 = -0.86 to -0.23; Quintile 5 = -0.22 to 3.41. Model adjust: Poor sleep quality: body mass index, waist and neck circumferences, physical activity; Daytime sleepiness: diastolic blood pressure, alcohol consumption, energy intake, and household income; Fatigue: body mass index, sex, physical activity, shiftwork, and neck circumference. Abbreviations: DII, Dietary Inflammatory Index; CI, confidence interval. Bold values represent p< 0.05.
Discussion
To the best of our knowledge, this is the first time that the association between DII has been tested with respect to sleep and apnea severity by PSG and subjective sleep parameters. The DII showed sensibility/specificity at predicting a poor sleep pattern (alteration in REM latency and daytime sleepiness) and apnea severity when the sample was stratified by BMI and age. We also observed an association between
daytime sleepiness and the inflammatory potential of diet.
The high prevalence of undiagnosed OSA and its concomitant morbidity and mortality may be an incentive to improve the recognition of this disorder (46). In this sense, screening questionnaires could help with the observation of OSA symptoms and encourage further evaluation, reducing the proportion of undiagnosed patients that probably would go years without treatment (46). Diet is correlated with obesity, which is strongly associated with OSA (13, 14), and numerous studies have already found that overweight/obesity, which is a state of low-grade chronic inflammation (47, 48), could partly mediate the association between dietary inflammatory potential and
we hypothesized that food pattern, mainly its inflammatory potential, could be a predictor of OSA severity and a poor sleep pattern in our sample. As hypothesized, the DII predicted apnea severity, particularly for individuals aged 51-60 years old. OSA is more prevalent in men, the elderly and obese individuals (50). A feasible screening tool that is capable of detecting food patterns that are associated with some of these risk factors of OSA could help with faster diagnosis and treatment of these individuals.
Even though the DII could predict AHI in older participants (Table 3), a group with higher incidence of OSA (50), we could not find an association between the inflammatory potential of diet and apnea severity (Table 4). This might have occurred because of the inclusion of adjustment variables in the GLzMM other than the stratified variables used to produce the ROC curve. The low sensitivity and specify of the DII at predicting the remaining sleep parameters in the other stratified models is worth noting. A possible explanation for these results is that food pattern may affect OSA indirectly; i.e., through its effect on excess weight, which in turn affects OSA. This could explain why we only observed significant differences in neck circumference, which is a risk factor for OSA (50).