Thermoelectric Power Studies of Ba-Co-Zr Hexagonal Ferrites
Ch. Venkateshwarlu, P. Vijaya Bhasker Reddy, D. Ravinder
1, Ch. Gopal
Reddy*
Department of Physics, University College of Engineering, Osmania University, Hyderabad-500007, India
1
Department of Physics, Nizam College (Osmania University), Basheerbagh, Hyderabad-500001, India
ABSTRACT
Thermoelectric Power studies of Ba-Co-Zr ferrites having chemical formula BaCoxZrxFe12-2xO19 (x = 0.0, 0.2,
0.4, 0.6, 0.8 and 1.0) were investigated from room temperature to 200 0C by differential method. The Seebeck Coefficient is negative for all the compositions showing that these ferrites behave as n-type semiconductors. Seebeck coefficient (S) in all the samples is found to increase with increasing temperature. The values of the charge carrier concentration have been computed from the observed values of Seebeck coefficient. On the basis of these results an explanation for the conduction mechanism in Ba-Co-Zr mixed ferrites is suggested.
Keywords
: Seebeck coefficient, Charge Carrier Concentration,Ba-Co-Zr ferrites.I.
INTRODUCTION
Ba-Co-Zr hexagonal ferrites have been considered as promising materials for applications in high-density magnetic recording and microwave devices [1, 2]. Hall effect and thermoelectric power studies are widely used in the interpretation of the conduction mechanism in semiconductors. The interpretation of Hall effect results is more straight forward and it gives precise results. However, in the case of low-mobility semiconductors such as ferrites, it is sometimes difficult to measure the Hall effect. In such cases, the thermoelectric measurement is the only alternative. Moreover, the measurement of thermo e.m.f. is simple and its sign gives vital information about the type of conduction in semiconductors, i.e., whether they are n-type or p-type As per the authors' knowledge no information is available on thermoelectric power studies of mixed Ba-Co-Zr ferrites in the literature. The present investigation deals with the study of thermoelectric power of Co-Zr substituted Ba hexaferrites as a function of composition and temperature. The results of such study are presented in this paper.
II.
EXPERIMENTAL DETAILS
2.1 SAMPLE PREPARATION
Ba-Co-Zr hexagonal ferrites having the compositional formula BaCoxZrxFe12-2xO19 (where
x=0.0, 0.2, 0.4, 0.6, 0.8 and 1.0) were prepared by conventional double sintering technique. The samples were pre sintered at 1000oC for 10 hrs and final sintering was carried out at 1250oC for 15 hrs, the sintering atmosphere being air.
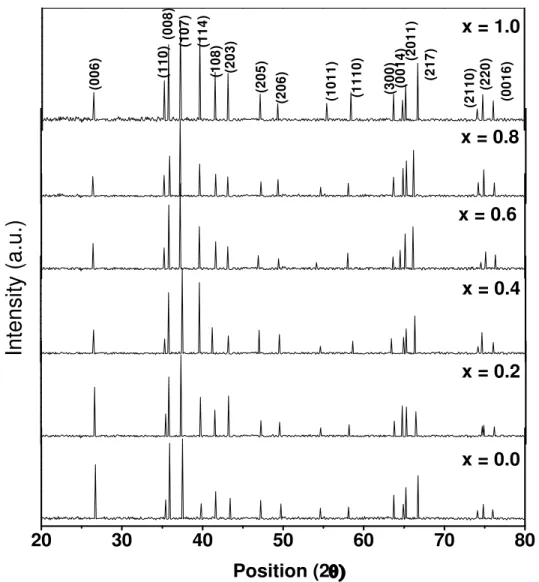
X-ray diffraction patterns for all the Ba-Co-Zr hexagonal ferrites under investigation have been obtained using Co Kradiation with =1.7902 A0.
Fig.1 shows the X-ray diffraction pattern for Ba-Co-Zr hexagonal ferrites. The diffraction patterns confirm the presence of M-Type hexaferrite phase structure.
The lattice parameters of the mixed ferrites were calculated from d-spacing and are given in Table 1. It can be seen from the table that the values of lattice parameters a & c continuously increase with the increase of Co and Zr concentrations. This can be expected in view of the fact that the ionic radii of 0.82 Ao for the Co2+ ions and 0.84 Ao for the Zr4+ ions are larger than that of 0.64 Ao for the Fe3+ ions.
Fig. 2 shows the SEM micrographs of Ba-Co-Zr hexa ferrites. These micrographs are obtained by using LEO-440I model instrument. It can be seen from the micrographs that the morphology of particles is similar and they are largely agglomerated. The average grain size of the samples calculated from line intercept method from SEM micrographs is in
the range of 4 to 10 m.
2.3 MEASUREMENTS
The thermoelectric power measurements were carried out by differential method [3,4] from room temperature to 473K. The temperature gradient across the sample was measured using two pairs of copper constant thermocouples. The sample was mounted on top of two well-separated copper blocks with silver paint. The temperature difference between the two ends of the sample was kept at 10K
thermoelectric power or Seebeck coefficient S was calculated using the relation, S = ∆E/∆T, where E is the thermo e.m.f. produced across the sample due to the temperature difference T.
III.
RESULTS AND DISCUSSION
3.1 COMPOSITION DEPENDENCE OF THE
SEEBECK COEFFICIENT
The values of the Seebeck coefficient (S) at 310 K computed from the measured values of the thermo-e.m.f. are given in Table 2. It can be seen from the table that the sign of the Seebeck coefficient is negative for all the Ba-Co-Zr ferrites. On the basis of its negative sign, the Co-Zr substituted barium ferrites have been classified as n-type semiconductors. It can also be seen from the table that the absolute value of the Seebeck coefficient decreases with the increase of Co and Zr content in barium ferrites.
3.2 TEMPERATURE DEPENDENCE OF THE
THERMOELECTRIC POWER
The variation of the thermoelectric power S with temperature is shown in Figs.3. It can be seen from the figures that the value of thermoelectric power for all Ba-Co-Zr ferrites increases with increasing temperature. The negative value of the thermoelectric power found over the entire temperature range studied shows that the majority of the charge carriers are electrons. This is due to electron hoping between Fe3+ to Fe2+.
A similar variation of the thermoelectric power with temperature was observed by several investigators in various ferrite systems [5-7].
3.3 COMPOSITION DEPENDENCE OF
CARRIER CONCENTRATION (n)
Table 2 gives the experimental values of the Seebeck coefficient at room temperature. The carrier concentration for these ferrites was also calculated using the formula given by Morin and Gebella [8], n = N exp(-Se/K), where S is Seebeck coefficient, e is charge of electron, K is Boltzman constant and N is density of states or concentration of electronic levels involved in the conduction process. For low mobility semiconductors, such as ferrites, the density of states can be taken as 1022/cm3 [8]. The computed values of the carrier concentration are presented in Table 2. It may be seen from the table that the values of the carrier concentration decrease with the increase of Co
with the result reported by Rezlescu et al. [9] who found that the resistivity of Li-Zn ferrites increased with the increase of the zinc content. Among all the ferrites the specimen with composition BaCo1.0Zr1.0Fe10O19 has a minimum value for the
Seebeck coefficient and minimum value of carrier concentration.
IV.
CONCLUSIONS
Ba-Co-Zr ferrites were prepared through soild-state route. X-ray diffractograms reveal the single phase formation and the structure is found to be hexagonal. The crystalline size of the present ferrites were found to be in the range of 4-10 m. The Seebeck coefficient decreases with increasing the Co-Zr content in the Ba ferrite. Among all the compositions, BaCo1.0Zr1.0Fe10O19 showed minimum
Seebeck coefficient as well as charge carrier concentration. Based on the results, the present ferrites were found to be n-type, where majority charge carriers are electrons.
V.
ACKNOWLEDGEMENTS
Authors wish to express their sincere thanks to Prof. K. Venugopal Reddy and Prof. R. Sayanna, the Head and Chairman, Board of Studies, respectively, of Dept. of Physics, Osmania University for their encouragement.
REFERENCES
[1] Z. Simsa, S. Lego, R. Gerber, E. Pollert, J. Magn. Magn. Mater. 140-144 (1995) 2103. [2] G. Mendoza-Suarez, J.C. Corral Hiracuz, M.E.
Contreras-Garica, H. Jucarez-Medina, J. Magn. Magn. Mater. 234 (2001) 73.
[3] Z. Simsa, Czech.J.Phys.B16 (1966) 919. [4] V.D.Reddy, M.A. Malik, P.V. Reddy, Mater.
Sci. Eng. B 8(1991)295.
[5] T.E. Wall, N. Salerno, Y. Proykova, K.A. Miraz, S. Mazen, Philos.Mag. B53 (1985) 107. [6] Md. Abdul Malik, V.D. Reddy, P. Venugopal Reddy, D.R. Sagar and Prankishan, Mod. Phys. Letts. 16 (1994) 947.
[7] D.Ravinder, K.Vijaya Kumar, Mater. Letts. 49
(2001) 57.
[8] F.J. Morin, T.H. Gebella, Phys.Rev. 99
(1955) 467.
20
30
40
50
60
70
80
x = 0.2
Position (2
)
x = 0.0
x = 0.4
x = 0.6
x = 1.0
x = 0.8
In
te
n
si
ty
(a
.u
.)
(1
1
0
)
(0
0
6
)
(2
1
7
)
(3
0
0
)
(0
0
1
6
)
(2
2
0
)
(2
1
1
0
)
(2
0
1
1
)
(0
0
1
4
)
(2
0
6
)
(2
0
5
)
(2
0
3
)
(1
1
1
0
)
(1
0
1
1
)
(1
0
8
)
(1
1
4
)
(1
0
7
)
(0
0
8
)
Fig. 1 : X-ray diffraction patterns of BaCoxZrxFe12-2xO19 hexaferrite samples
Table 1 : Lattice parameters (a & c) of BaCoxZrxFe12-2xO19 hexaferrites
Sl. No. Ferrite composition a(A0) c (A0 ) 1 BaFe12O19 5.890 23.208
2 BaCo0.2Zr0.2Fe11.6O19 5.891 23.213
3 BaCo0.4Zr0.4Fe11.2O19 5.893 23.224
4 BaCo0.6Zr0.6Fe10.8O19 5.897 23.243
5 BaCo0.8Zr0.8Fe10.4O19 5.903 23.267
Figs. 2 : SEM micrographs of BaCoxZrxFe12-2xO19 hexaferrite samples
Table 2 : Electrical transport data for BaCoxZrxFe12-2xO19 hexaferrites at 310K
Sl. No. Composition Seebeck coefficient (S) v/K
Charge carrier concentration
(n) /cm3 1 BaFe12O19 -137 1.131022
2 BaCo0.2Zr0.2Fe11.6O19 -115 1.101022
3 BaCo0.4Zr0.4Fe11.2O19 -105 1.091022
4 BaCo0.6Zr0.6Fe10.8O19 -100 1.081022
5 BaCo0.8Zr0.8Fe10.4O19 -85 1.061022
6 BaCo1.0Zr1.0Fe10O19 -60 1.051022
x= 0.0 x= 0.2
x= 0.4
x= 0.6
x= 0.8
320 360 400 440 480 -100
-120 -140 -160 -180 -200 -220
320 360 400 440 480 -100
-120 -140 -160 -180 -200
320 360 400 440 480 -100
-120 -140 -160 -180
320 360 400 440 480 -100
-120 -140 -160 -180
320 360 400 440 480 -80
-100 -120 -140 -160
320 360 400 440 480 -60
-80 -100 -120 -140
S
eb
eck Co
ef
fici
an
t
(
V
/K
)
Temperature (K)
x= 0.0
S
eb
eck Co
ef
fici
an
t
(
V
/K
)
Temperature (K)
x=0.2
S
eb
eck Co
ef
fici
an
t
(
V
/K
)
Temperature (K)
x= 0.4
S
eb
eck Co
ef
fici
an
t
(
V
/K
)
Temperature (K)
x=0.6
S
eb
eck Co
ef
fici
an
t
(
V
/K
)
Temperature (K)
x=0.8
S
eb
eck Co
ef
fici
an
t
(
V
/K
)
Temperature (K)
x=1.0