Prospects through Lee-Carter Approach
Awdhesh Yadav*, Suryakant Yadav, Ranjana Kesarwani
International Institute for Population Sciences (IIPS), Mumbai, India
Abstract
The present study attempts to study the age pattern mortality and prospects through Lee-Carter approach. The objectives of the study are to examine the trend of mortality decline and life expectancy. Contemporaneously, we have projected life expectancy up to 2025, projecting ASDR using Lee-Carter method. Life table aging rate (LAR) used to estimate the rate of mortality deceleration. Overtime, LAR increased and during recent decade it remained more or less unchanged. By age, LAR significant increased in the oldest of old. The slope is steepest in the oldest of old in the recent decade. The rates of mortality increased in oldest of old as the age group is more vulnerable to chronic disease and vulnerable to identifiable risk factors for virtually every disease, marked by senility. The analysis revealed that the level of mortality is not declining but rate of acceleration is declining and is further expected to decline. By the year 2025, the age specific death rates for the age group 5–9 and 10–14 will go below one per thousand.Life expectancy will attained as high as 73 and 79 years for male and female and is further expected to increase linearly. 71 percent of total female birth and 57 percent of total male birth will survive up to age 70+. Also the findings revealed that mortality rate is declining with constant rate up to age 70 and thereafter, the mortality rate accelerates and this holds true for both sexes.
Citation:Yadav A, Yadav S, Kesarwani R (2012) Decelerating Mortality Rates in Older Ages and its Prospects through Lee-Carter Approach. PLoS ONE 7(12): e50941. doi:10.1371/journal.pone.0050941
Editor:Giuseppe Biondi-Zoccai, Sapienza University of Rome, Italy
ReceivedJuly 3, 2012;AcceptedOctober 26, 2012;PublishedDecember 6, 2012
Copyright:ß2012 Yadav et al. This is an open-access article distributed under the terms of the Creative Commons Attribution License, which permits unrestricted use, distribution, and reproduction in any medium, provided the original author and source are credited.
Funding:No current external funding sources for this study.
Competing Interests:The authors have declared that no competing interests exist.
* E-mail: [email protected]
Introduction
Kingsley Davis spoke of the ‘‘amazing decline’’ of mortality in underdeveloped countries [1]. According to WHO report, India rank third, next to only Myanmar and Nepal, among all South Asian countries ordered by adult death rate in 2001 [2]. One of the greatest human achievements has been the decline in mortality that has occurred during the modern era. Substantial mortality decline in other part of the world is a more recent phenomenon, sharply accelerating after 1950; although demographic data to document these trends are deficient in most of the all part of the third world countries. It is shown that mortality decline in India might have been due, speaking, to development rather than as a primary consequences of public health.
The age pattern of mortality has drawn considerable attention in the field of applied demography and public health not only because mortality is one of the direct determinants of population change but also because of the risk of mortality. Also, the cause of death would be very different in various age segments and any health policy therefore has to take this into consideration the age pattern of mortality. It is generally noted that children in infancy and aged people are most vulnerable group. The study of age
pattern is very important from the point of view of planning. While projecting the population, the future age pattern of mortality is borrowed from sets of model life tables (MLT). Therefore the present study tries to model the pattern and prospects of mortality in older age in India.
Literatures suggest different models for forecasting mortality not all are suitable in Indian conditions. For instant, the 8- parameter
model developed by Heligman and Pollard (1980) [3] has been found to fit a wide range of mortality schedules, but the large number of parameter limits the model’s potential for projection particularly in the context of developing countries [4]. Lee and Carter (1992) [5] proposed a simple method for forecasting future mortality, consisting of a base model of age specific death rates with a dominant time component and a fixed relative age component, and a time series model (autoregressive integrated moving average (ARIMA)) of the time component. A major problem with the Lee carter method is the assumption that the age component is invariant over time [6].
In a study of mortality in India and all the major states as well as, Roy and Lahiri (1987) [7] showed that the age pattern of mortality in India, for males and especially females, resembled well the South Asian Pattern of the new U.N. model life tables (1982) [8] and also the South pattern of the Coale- Demeny model life tables [9]. To study the trends in mortality, life table for each year’s during the period from 1970 to 1983 was constructed and the indices like5L0/l0,10L0/l15,30L15/l15, and‘L50/l50were used to study the mortality at age 0–4, 5–11, 15–49, and 50 over. In addition to these indices, the eou and q0 was also used. The mortality in India was found to be higher at both ends of life span. Female mortality was higher in comparison to male mortality, except at the older ages. The improvement in female mortality was much faster than the male mortality.
among the infants, children below 15 years of age and women in the reproductive ages. Among adults, mortality declined more rapidly among females than in males, the differential being largest in the age group 25–49.
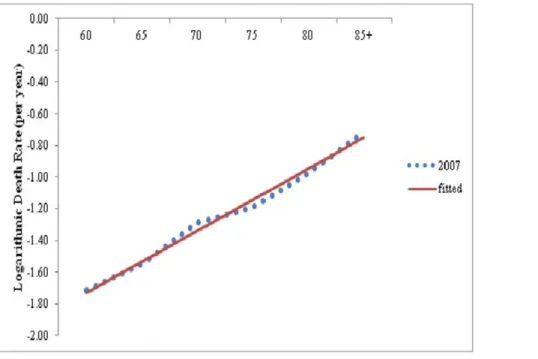
The study of age pattern of mortality in older age is essential for most of demographic measurement and forecasts. In most of the indirect technique of fertility estimation, one needs the knowledge of age pattern of mortality as well as the level of mortality. It has been supposed that human mortality from all cause increases with age nearly exponentially (at constant rate) through adult age except for very older ages, and that this exponential increase also holds fairly well for most major cause of death (CODs) [11]. When age specific death rates are plotted against age on a logarithmic scale, points appear to fall along a straight line as illustrated for
Indian females in figure 1. Thus the present study make an
attempt to study the life expectancy in future and the scenario of oldest old mortality i.e. whether mortality is accelerating or decelerating in the older age groups.
Methods and Materials
Sample Registration System (SRS) [12] is only source that provide age specific death rates, sex and place of residence (Rural, Urban and Total) for all the major states of India. SRS collects information based on the concept of dual record system and thus, errors due to sampling and non-sampling errors are expected to be less. Bhat (2000) [13] pointed out the incompleteness in death-registration in the SRS death records which are approximately 0.2 percent; in the context paucity of other sources of data and their relative reliability compared to the SRS data, it is worthwhile to use information available with SRS. The present study has made use of age specific death rates by sex from 1981 to 2006 for India. The abridge life table based on SRS data starting from 1978 for India has also been used to observe the trend of life expectancy [14].
The one way to examine the age variation in mortality is to plot the logarithm of the age specific death rate against age. Significant
pattern of mortality acceleration or deceleration can be easily visualized through the inspection of plot between logarithmic age specific death rates and age group. A simple measure, the life-table aging rate (LAR), has proven to be a powerful tool for detecting these patterns [15–20]. The LAR at exact age x is defined as:
k(x)~ 1 m(x)(
dm(x)
dx )~ dlnm(x)
dx
Wherem(x)is the force of mortality (instantaneous death rate) at
age x for any population. Thus, the LAR measures the relative mortality increase with age: For example, an LAR of 0.05 means that the death rate is rising (at exact age) at an exponential rate of 5% per year of age.
When data are tabulated by five-year age groups, the LAR can be estimated by
k(x)~lnm(x,x
z5){lnm(x{5,x)
5
Where M(x, x+5) is the death rate for the interval between exact ages x and x+5.
For the second objective, Lee-Carter (1992) method is used for long-run forecasts of the level and age pattern of mortality, based on a combination of statistical time series methods and a simple approach to deal with the age distribution of mortality. The method describes the log of a time series of age specific death rates as the sum of an age-specific component that is independent of time and another component that is the product of a time-varying parameter reflecting the general level of mortality, and an age specific component that represents how rapidly or slowly mortality at each age varies when the general level of mortality changes. The forecasting of the index of level of mortality gas been done by Autoregressive Integrated Moving Average Model (ARIMA).
Figure 1. Age Specific death rates for female on logarithmic scale, India, 2007 (Note: Dotted are logarithmic of death rates between 60 and 85+.The line was fitted to death rates between age 60 and 85 by ordinary least squire regression).
Lee- Carter Model Description and Fitting of the Model The model is specified as
lnmx,t~axzbxktzex,t
or,mx,t~exp (axzbxktzex,t)
where m(x,t) is the death rate for age x in year t, the axcoefficient describe the average shape of the age of the mortality, the bx coefficient describe the pattern of deviations from this age profile when the parameter k varies and ktrepresent the index of level of mortality. As k goes to negative infinity, each age-specific rate tends to be zero and hence negative death rates cannot occur in this model, which is an advantage for forecasting.
The equation of the model is
lnmx,t~axzbxktzex,t
The estimates of ax, bx, and ktcan be obtained by normalizing bxto sum to unity and the ktto sum to zero. The axvalues can be estimated by averaging ln (mx,t) over time. Further, kt can be estimated by summing over the age of [ln (mx,t) –ax]. Also, bxcan be estimated by regressing, without a constant term, [ln (mx,t) –ax] on ktseparately for each age group x.
lnmx,t~axzbxkt
or,mx,t~exp (axzbxktzex,t)
lnmx,t~axzbxkt
X
t
lnmx,t~
X
t
axzbx
X
t
kt
X
t
lnmx,t~taxzbx
X
t
kt
ax~
1
t
X
t
lnmx,t, since
X
t
kt
lnmx,t{ax~bxkt
X
x
½lnmx,t{ax~
X
x
bxkt
X
x
½lnmx,t{ax~kt
X
x
bx
kt~
X
x
½lnmx,t{ax, since
X
x
bx~1
lnmx,t{ax~bxktzerror
y~bxxzerror
where y~lnmx,t{ax
Construction of life table
To understand the mortality pattern in the future, life table has been constructed using the forecasted age specific death rates. For constructing life table the usual method, the death rates for 0–1, 1– 4, and other remaining five years age group are required. But, the SRS provides the death rates in five year age groups starting from
0–4. The nmx values are converted into the nqx by employing
Greville’s formula [21].
nqx~
nmx
1
nznmxf12z12n(nmx{logec)g
For the age group 0–4, thenqxvalues are calculated using the expression obtained by Roy and Lahiri (1987) [7]. They obtained the relation by establishing a linear regression between5p0( =
1-5q0) and5m0using the relevant data from the South Asian pattern of the united nation model life table for the developing countries. The expression is given as
(a) For malesloge5p0~{0:013{4:3765m0
(b) For femalesloge5p0~{0:012{4:4365m0
The other life table functions have been calculated in the usual manner. The number of person years lived between the age x and x+n have been obtained by the relation
nLx~
lx{lxzn nmx
Results and Discussions
Table 1provides the estimated values of age specific constants axand bx,where axcoefficient describes the average shape of the age schedule of mortality and coefficient bx shows the speed of decline of the nmx values. The ax values can be considered as approximate indicator of level of mortality decline. The axvalues are constant for the particular age group. Starting from the lowest age group, the axvalues continues to decline upto 25–29 and then increased upto maximum value of 4.45 for the age group 70+. For females also the axdecreases upto the age-group (20–24) and then increases thereafter and reach to a maximum value of 4.35 for last age group. In comparison to male axvalues, the female axvalues
Table 1.Estimated values of axand bxfor males and females for India.
Age Group Males Females
ax bx ax bx
0–4 3.18258 0.167421 3.27694 0.10662
5–9 0.75033 0.174153 0.94346 0.12761
10–14 0.23408 0.102773 0.31963 0.07205
15–19 0.50479 0.063267 0.79077 0.06393
20–24 0.79864 0.049129 1.05457 0.06884
25–29 0.94551 0.011702 1.02698 0.06560
30–34 1.16234 0.013489 1.04804 0.06490
35–39 1.42516 0.016473 1.16079 0.06020
40–44 1.74872 0.035294 1.3827 0.06366
45–49 2.13219 0.052644 1.71023 0.05448
50–54 2.55527 0.062898 2.16092 0.06595
55–59 2.95287 0.016848 2.60667 0.04682
60–64 3.39943 0.065659 3.12556 0.05864
65–69 3.80441 0.050237 3.54627 0.04515
70–74/70+ 4.45976 0.073013 4.35898 0.04498
are found to be higher for lower age groups 5–9 to 25–29, indicating high level of female mortality in these age groups. The coefficient bxshows the speed of decline of the nmxvalues. It is clear from the table that the death rates in the age group 0–4 and 5–9 decline much faster than other age groups. The decline in the coefficient bxfor females is found to be less in comparison to males in the age group 0–4, 5–9, and 10–14. Whereas the speed of decline for females is higher from the age groups 15–19 till the age 55–59. This may be accredited to improvement in maternal mortality due to advancement in health facility and special care given to women.
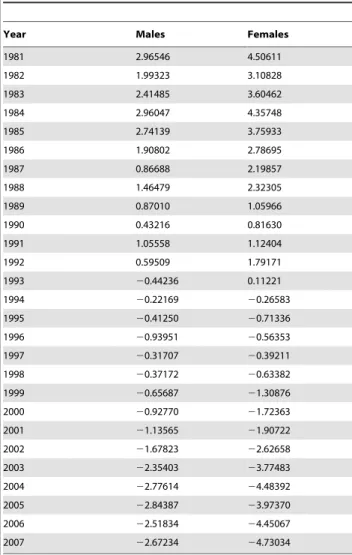
Table 2gives the estimated values of kt(index of the level of mortality) separately for males and females. It is clear that index of level of mortality has gone down over the year for both sexes. The decline in the index of level of mortality is more prominent in the case of females than males.
Table 3presents the observed (SRS) and expected (calculated) age specific death rates for males and females. After estimating the parameter ax, bxand kt, the age specific death rates are estimated for four periods namely 1990, 1995, 2000 and 2005. It can be seen that there is not much difference in the expected and observed values but there is slight difference in the last age group. One important fact that has been done in the table is that, an adjustment has been felt necessary given the problem of the age
break up. Prior to 1995, age specific break up is upto 70+but the subsequent years the break up has been increase to 85+, which result in minor difference in the last age group. It indicates the suitability of the model for India. The Graphical presentation of age specific death rates (both observed and expected) are shown in the figure and for the most of the age groups the fit seems to be reasonably good.
The forecasted values of ktare given in the table 4. The 95 percent confidence interval is also given in the same table. The forecasted values are given up to the year 2025. It is clear from the table that the level of mortality will decline for both sexes, but the decline in the level of mortality is likely to be higher in the case of females in comparison to males. The age specific death rates have been forecasted using the estimated values of ax, bxand forecasted values of ktusing autoregressive integrated moving average model.
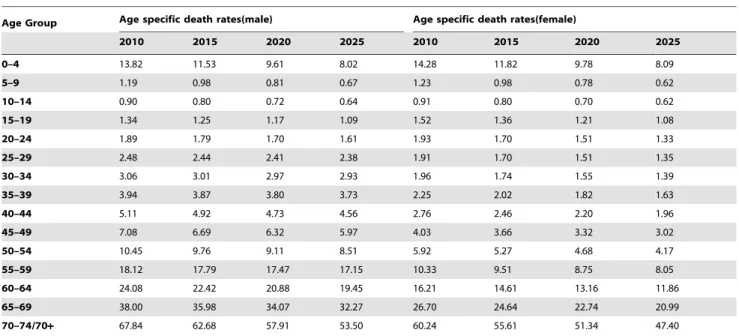
Table 5reveals the forecasted age specific death rates for the year 2010, 2015, 2020 and 2025 for both sexes. The age specific death rates have been forecasted using the estimated values of ax, bx and forecasted values of kt using autoregressive integrated moving average model. The death rates in India as a whole are expected to decline rapidly. Under five mortality is expected to decline to 8 per thousand for both the sexes by the year 2025.Overall the death rates for the age group 5–9 and 10–14 are expected to go below one per thousand by the year 2025 for both the sexes. The age specific death rates are lower for females as compared to males in all the age groups except 0–4 age group.
Table 6present the number of serving to exact age for both sexes. The lx values have been constructed for the years 2010, 2015, 2020 and 2025. In 2010, about 51 percent of the male births and 62 percent of the female birth are expected to survive up to age 70. By 2025, this percentage is forecasted to increase to 57 percent and 71 percent respectively. About 95 percent of the total live births are forecasted to survive to age five by the year 2025.
Life expectancy at birth is important function of a life table. Table 7present the forecasted life expectancies at birth by using Lee-Carter and life expectancies at birth for India as projected by Registrar General of India. The e0uvalue for India is forecasted to be 72.71 years for males and 79.27 for females by the year 2025.Comprison with the level of e0u given by the Registrar General of India reveal that the e0ugiven by Lee-carter model is higher than that of Registrar General of India.
The Life Table Aging Rate (LAR) has been calculated for India separately for male and female. For understanding of mortality decline and changes, last 15 years data has been considered i.e.1993–2007. LAR has been calculated for older age, generally, age 60 and above for male and female as mentioned methodology.
Figure 2gives the rate of mortality change (may be accelerating or decelerating) for male and female, 1993. Overall the result seems compatible, it has been observed that LAR is decelerating, up to age 70 and after that it slightly increase for the oldest age. This means that mortality has been decreasing upto age 70 and later on mortality is increasing with constant rate i.e. mortality is accelerating for age 75 and above. However, it has been clearly seen that the pace of mortality decline is more pronounced for female against male counterpart. Also the age pattern for mortality acceleration for male remain slightly higher than female for age 80, beyond that its value become stagnant.
Again LAR has been calculated separately for male and female for the year 1999. Also fromfigure 3, it has been observed that age related mortality continue to decrease i.e. mortality is decelerating although LAR decline is more prominent in male as compared to female upto age 70. However, for female in age 75, there is decrease in mortality as compared to male after that LAR for female has been increasing for oldest age. It is clearly Table 2.Estimated ktvalues during 1981–2007 for India.
Year Males Females
1981 2.96546 4.50611
1982 1.99323 3.10828
1983 2.41485 3.60462
1984 2.96047 4.35748
1985 2.74139 3.75933
1986 1.90802 2.78695
1987 0.86688 2.19857
1988 1.46479 2.32305
1989 0.87010 1.05966
1990 0.43216 0.81630
1991 1.05558 1.12404
1992 0.59509 1.79171
1993 20.44236 0.11221
1994 20.22169 20.26583
1995 20.41250 20.71336
1996 20.93951 20.56353
1997 20.31707 20.39211
1998 20.37172 20.63382
1999 20.65687 21.30876
2000 20.92770 21.72363
2001 21.13565 21.90722
2002 21.67823 22.62658
2003 22.35403 23.77483
2004 22.77614 24.48392
2005 22.84387 23.97370
2006 22.51834 24.45067
2007 22.67234 24.73034
visible from the figure that mortality is accelerating with constant rate beyond age 80. And this is true for both male and female.
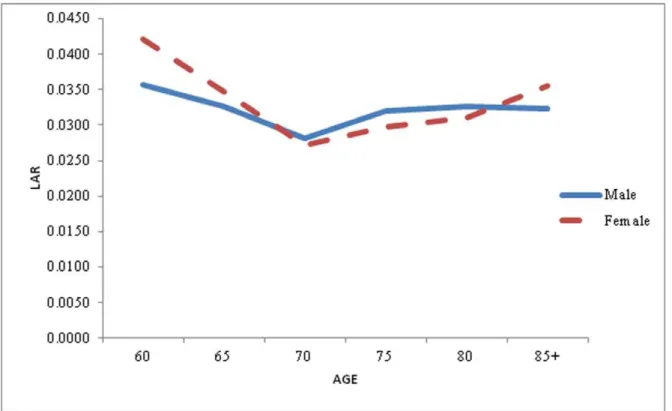
For the better understanding of pattern and prospects of mortality acceleration and deceleration, Again LAR has been calculated separately for male and female for the year 2006.
Figure4 gives the same pattern has been seeing here what the previous two graph shows. Here also Mortality is decelerating, for both male and female, upto age 70 after that mortality is accelerating for age 75 and above. But the pace of mortality decline is more prominent in male compared to female. For instance in case male the LAR for age 70 is 0.0333 means that death rate rising at an exponential rate of 3.33 percent where as for female, LAR for same age is 0.0433 means that death rate is rising at an exponential rate of 4.33. Here the rising of mortality is more in female as compared to male. The only exception is for age 75 where LAR is less for female as compared to male.
The above discussion clearly pointed out that mortality rate is declining with constant rate upto age 70 after that mortality is accelerating beyond age 70 and this holds true for both sexes i.e. male and female. The rates of mortality increase at oldest of old group because this age group is more vulnerable to chronic disease and epidemiological studies have shown that there are identifiable risk factors for virtually every disease, marked by senility. Also, the risk factor vary across the populations, some persons are more vulnerable to the disease than others. It follows that if the overall adult mortality declines, then the pattern of mortality deceleration should shift to older ages. This relationship between the mortality level and the mortality deceleration was dominated in an earlier simulation study [22].
Why does the deceleration occur? Although an apparent slowdown can be attributed to inaccurate data for some human populations [23,24], the trend has been observed using accurate data as well. There at least two possible explanations for this Table 3.Observed and expected age specific death rates for India.
Age Group Males Females
1990 1995 2000 2005 1990 1995 2000 2005
Obs Exp Obs Exp Obs Exp Obs Exp Obs Exp Obs Exp Obs Exp Obs Exp
0–4 24.8 25.9 23.2 22.5 18.6 20.6 16.4 15 27.9 28.9 25.3 24.6 20.6 22 18.2 17.3
5–9 2.3 2.5 2.2 1.8 1.5 1.7 1.5 1.4 2.8 3 2.7 2.4 2 2 1.7 1.5
10–14 1.4 1.3 1.3 1.2 1.2 1.1 1.1 1 1.4 1.6 1.4 1.3 1.3 1.1 1.1 1
15–19 1.7 1.6 1.7 1.6 1.6 1.4 1.5 1.7 2.5 2.2 2 2.1 2.2 1.7 1.9 2.2
20–24 2.4 2.2 2.1 2.2 2.2 1.9 2 2.2 3.1 2.8 2.7 2.6 2.7 2.1 2.1 2.9
25–29 2.5 2.6 2.6 2.5 2.9 2.5 2.3 2.6 2.8 2.7 2.6 2.5 2.7 2.2 2.2 2.8
30–34 3.1 3.2 3.1 3.1 3.3 3.1 3 3.2 2.9 2.7 2.7 2.5 2.8 2.1 2 2.9
35–39 3.9 4.1 3.7 4 4.4 4 3.9 4.2 3.2 3.1 3.1 2.7 3 2.4 2.4 3.2
40–44 5.7 5.7 5.5 5.3 5.5 5.7 5 5.7 4.4 3.8 3.8 3.1 3.3 4 3 4
45–49 9 8.1 8.1 7.3 8.1 8.4 7 8.4 6.3 5.1 5.2 4.3 5.3 5.5 4.4 5.5
50–54 13.2 12.1 12 10.8 12.2 12.9 10.8 12.9 9 7.7 8.5 6.7 7.4 8.7 6.4 8.7
55–59 20.9 18.8 17.5 18.4 19.1 19.2 15.4 19.2 14.4 12.4 11.8 11 13.4 13.6 10.9 13.6
60–64 28.9 26.8 28 25.1 26.6 29.9 24.2 29.9 23 19.5 21.5 17.3 19.7 22.8 18.2 22.8
65–69 47.3 39.9 41.6 44.9 44.2 44.9 37.7 44.9 37.8 29.2 30.5 34.7 32.3 34.7 27.7 34.7
70–74/70+ 81.4 70.6 97.2 86.5 73.8 86.5 76.7 86.5 79.4 73.9 81 68.2 64.1 78.2 68.2 78.2
Note:Obs – Observed. Exp - Expected.
doi:10.1371/journal.pone.0050941.t003
Table 4.Forecasts of mortality index k from (0, 1, 0) model, India.
Year Male Female
kt LCL UCL kt LCL UCL
2008 22.89 23.97 21.81 25.09 26.43 23.75
2009 23.11 24.66 21.55 25.44 27.37 23.51
2010 23.32 25.26 21.38 25.80 28.20 23.39
2011 23.54 25.82 21.26 26.15 28.98 23.33
2012 23.76 26.34 21.17 26.51 29.72 23.30
2013 23.97 26.85 21.09 26.86 210.43 23.29
2014 24.19 27.35 21.03 27.22 211.14 23.30
2015 24.41 27.83 20.98 27.57 211.82 23.32
2016 24.62 28.31 20.94 27.93 212.50 23.35
2017 24.84 28.78 20.90 28.28 213.17 23.39
2018 25.06 29.25 20.86 28.64 213.84 23.44
2019 25.27 29.71 20.84 28.99 214.50 23.49
2020 25.49 210.17 20.81 29.35 215.15 23.54
2021 25.71 210.63 20.79 29.70 215.81 23.60
2022 25.92 211.08 20.77 210.06 216.45 23.67
2023 26.14 211.53 20.75 210.41 217.10 23.73
2024 26.36 211.98 20.74 210.77 217.74 23.80
2025 26.58 212.42 20.73 211.12 218.38 23.87
Note:ktvalues at 95% confidence intervals.
phenomenon: the heterogeneity hypothesis and the individual -risk hypothesis [25].
According to the heterogeneity hypothesis, the deceleration is a statistical effect of selection through the attrition of mortality. Because the frailer tend to die at younger ages, survivors to older age tend to have more favorable health endowments and/or healthy lifestyles. This argument has been supported by several studies based on mathematical models [26,27] and simulations [28–30]. Some parametric models on relationship between physiological changes and mortality pattern suggest that selection
survival should cause decelerations of age-related increases in both mortality and disability at very old ages [31,32].
According to the individual-risk hypothesis, the age related increase of mortality risk for individuals slow down at older ages for one or more reasons. There are three versions of the individual-risk hypothesis: physiological, evolutionary and reliabil-ity-theoretical. First, if the ‘‘rate of living’’ is slower in older age, so may be the ‘‘rate of aging’’. For example, there is much direct and indirect evidence of negative correlations, both between and within species, between rate-of-living measures and life expectancy [33,34]. Furthermore, declines in the rate of living at old ages have Table 5.Forecasts of age specific death rates for India.
Age Group Age specific death rates(male) Age specific death rates(female)
2010 2015 2020 2025 2010 2015 2020 2025
0–4 13.82 11.53 9.61 8.02 14.28 11.82 9.78 8.09
5–9 1.19 0.98 0.81 0.67 1.23 0.98 0.78 0.62
10–14 0.90 0.80 0.72 0.64 0.91 0.80 0.70 0.62
15–19 1.34 1.25 1.17 1.09 1.52 1.36 1.21 1.08
20–24 1.89 1.79 1.70 1.61 1.93 1.70 1.51 1.33
25–29 2.48 2.44 2.41 2.38 1.91 1.70 1.51 1.35
30–34 3.06 3.01 2.97 2.93 1.96 1.74 1.55 1.39
35–39 3.94 3.87 3.80 3.73 2.25 2.02 1.82 1.63
40–44 5.11 4.92 4.73 4.56 2.76 2.46 2.20 1.96
45–49 7.08 6.69 6.32 5.97 4.03 3.66 3.32 3.02
50–54 10.45 9.76 9.11 8.51 5.92 5.27 4.68 4.17
55–59 18.12 17.79 17.47 17.15 10.33 9.51 8.75 8.05
60–64 24.08 22.42 20.88 19.45 16.21 14.61 13.16 11.86
65–69 38.00 35.98 34.07 32.27 26.70 24.64 22.74 20.99
70–74/70+ 67.84 62.68 57.91 53.50 60.24 55.61 51.34 47.40
doi:10.1371/journal.pone.0050941.t005
Table 6.Forecasts of numbers surviving to exact ages for selected years, India.
Age Group lx(male) lx(female)
2010 2015 2020 2025 2010 2015 2020 2025
0–4 100000 100000 100000 100000.00 100000 100000 100000 100000
5–9 92916 93852 94643 95304 92742 93760 94612 95324
10–14 92364 93393 94261 94985 92173 93301 94244 95029
15–19 91950 93020 93922 94682 91755 92929 93915 94735
20–24 91336 92440 93374 94167 91060 92299 93348 94225
25–29 90476 91616 92584 93412 90185 91518 92646 93600
30–34 89361 90505 91474 92307 89328 90743 91949 92970
35–39 88003 89152 90125 90963 88456 89956 91239 92326
40–44 86285 87442 88428 89281 87466 89052 90412 91576
45–49 84106 85316 86359 87267 86267 87963 89422 90683
50–54 81177 82506 83670 84698 84545 86367 87949 89323
55–59 77037 78569 79938 81164 82076 84119 85913 87479
60–64 70342 71861 73230 74474 77937 80205 82230 84022
65–69 62329 64210 65944 67548 71852 74540 76981 79174
70–74/70+ 51473 53572 55554 57426 62830 65862 68674 71257
been observed for a number of physiological functions [35,36], including fundamental processes such as cell division [37]. In addition, the development of some disease is slower at older ages [38–40].
Conclusions
In general, the results of the study appear broadly consistent with the heterogeneity hypothesis. It is possible, however, that they are also compatible with specific versions of the individual risk hypothesis. Finally, a shift in the pattern of deceleration to older ages might have been caused by a delay of senescent processes, brought about by improvement in the health of the elderly during the recent decades [32].
Life expectancy is increasing linearly overtime at the rate of 0.45 per year, which is fluctuating but periodic in nature. Partially the periodic nature is attributed to the level of heterogeneity and the extent of vulnerability of the group. For all younger and older age group, the trend is almost linear however, for 0–4 age group the trend is steeper. It is seen that the life expectancy for females is
considerably higher as compared to males. It is clearly pointed out that level of mortality is not declining but the mortality rate is decelerating and is further expected to decelerate in future. The process of deceleration is clearly visible in older ages. Our estimates are higher than SRS estimates which is further underpinned by deceleration of mortality acceleration in older age group.
The estimates revealed that in past decades the mortality rates for females is higher compared to males in adult age group. For children and older age group, mortality rate for males were higher than for females. In contrast, in projected years, the decline in the death rates for the age groups 0–4 and 5–9 are much faster than those in the higher age groups and the decline for females is higher than those of males in the reproductive ages which may be due to decline in maternal mortality and utilization of health care services.
Life tables were constructed using the forecasted death rates from the Lee-Carter model. By the year 2025, the death rates for age groups 5–9 and 10–14 will go below one per thousand. Table 7.Comparative forecasted life expectancy at birth between Lee-Carter model and Registrar General of India by sex, India.
Year
Forecast of life expectancies at birth by sex using Lee Carter model for India
Life expectancies at birth for India as projected by Registrar General of India
Male Female Male Female
2010 66.62 71.1 65.8 68.1
2015 68.63 73.81 67.3 69.6
2020 70.65 76.52 68.8 71.1
2025 72.71 79.27 69.8 72.3
doi:10.1371/journal.pone.0050941.t007
Figure 3. Life Table Aging Rate (LAR) for Male and Female in the older age, India, 1999. doi:10.1371/journal.pone.0050941.g003
Analysis revealed that, 71 percentage of the total female birth and 57 percentage of total male birth will survive up to age 70 and above. The life expectancy at birth obtained from Lee-Carter model is higher than from those obtained from the estimates provided by Registrar General of India. The life expectancy at birth for females is higher than males by 6 years, signifying the increasing gap between both sexes.
The above discussion ascertained that mortality rate is decelerating with constant rate upto age 70, and thereafter, the rate is accelerating for oldest of old. This holds true for both sexes i.e. male and female. The rise in mortality rates in oldest of old group is attributable to chronic disease and epidemiological studies have ascertained that there are identifiable risk factors for virtually every disease, marked by senility in the older age group.
This paper explores some policy implication of declining mortality among the elderly population. There are two views of how health program will affect the social burden of caring for the aged. One holds that prolonging the lives of frail individuals will
result in rapidly increasing medical and other costs per aged person. A second view suggests that health progress and behavioral changes will reduce both mortality and morbidity rates, lowering the average cost per person of caring for the aged.
Acknowledgments
An earlier version of this paper was presented at the Bhopal seminar 2011, India. The authors gratefully acknowledge the Prof. (Rtd.) Subrata Lahiri, Department of Public Health and Mortality Studies, International Institute for Population Sciences, Mumbai, India for rendering their useful comments and suggestions. The authors are grateful to the two reviewers whose comments helped immensely in improving the quality of the paper.
Author Contributions
Conceived and designed the experiments: AY SY. Performed the experiments: AY. Analyzed the data: AY. Contributed reagents/materi-als/analysis tools: AY SY RK. Wrote the paper: AY SY RK.
References
1. Kingsley D (1956) The Amazing Decline of Mortality in Under Developed Areas. The American Economic Review 46: 305–318.
2. WHO mortality database; Genva, World Health Organization, 2007 (Available: http://www.who.int/healthinfo/morttables/en/index.html, Accessed: 12 Jan 2012).
3. Heligman l, Pollard JH (1980) The age pattern of mortality. Journal of the Institute of actuaries, Part 1, 107 (434): 49–80.
4. McNown R, Rogers A (1989) Forecasting Mortality: A Parameterized Times Series Approach. Demography 76(4): 645–660.
5. Lee RD, Carter LC (1992) Modeling and Forecasting U.S. Mortality. Journal of the American Statistical Association 87 (419): 659–675.
6. Lee R, Miller T (2000) Assessing the Performance of the Lee-Carter Approach to Modeling and Forecasting Mortality, paper presented at the Annual Meeting of the Population of America, Los Angles, March 23–25, 2000.
7. Roy TK, Lahiri S (1987)Recent levels and Trends in Mortality in India and its Major States: An Analysis of SRS Data, in K. Srinivasan and others (eds., Dynamics of population and Family welfare, Mumbai: Himalaya publishing House. 8. United Nations (1982)Model Life Tables for Developing Countries. United Nations
Publication, New York, Sales No. E.1981.XIII.7.
9. Coale AJ, Demeny P (1966)Regional Model Life tables and Stable Populations. New Jersey: Princeton University Press.
10. Bhat PNM, Navaneetham K (1991) Recent trends in age-specific mortality in India. Journal of Institute of Economic Research 26(1–2): 49–69.
11. Horiuchi S (1997) Postmenopausal Acceleration of Age related mortality increase. Journal of Gerontology: Biological Science 52A: B78–92.
12. Registrar General of IndiaSample Registration System 1981–2006, (2011) Office of Registrar General, Ministry of Home Affairs, Government of India, New Delhi. 13. Bhatt PNM (2000) Completeness of India’s Sample Registration System: An Assessment using the General Growth Balance Method. Population Studies 56: 119–134.
14. (2004) Registrar General IndiaSRS-based abridged life tables(1988–2004) India: Registrar General, New Delhi.
15. Carey JR, Liedo P (1995) Sex-Specific Life Table Aging Rates in Larger Medfly Cohorts. Experimental Gerontology 30: 315–325.
16. Horiuchi S (1983) The long-term impact of War on Mortality: Old age mortality of world war I, Survivors in The federal Republic of Germany. Population Bulletin of the United Nations 15: 80–92.
17. Houriuchi S, Coale AJ (1990) Age Pattern of Mortality for older Women: An Analysis using the Age-specific Rate of Mortality changes with Age. Mathematical Population studies 2: 245–67.
18. Horiuchi S, Wilmoth JR (1998) Deceleration in the Age Pattern of Mortality at Older Ages. Demography 35 (4).
19. Kannisto V, Lauristen J, Thatcher AR, Vaupel JW (1994) Reduction in mortality at advanced ages. Population and Development Review 20: 793–810. 20. Wilmoth JR (1995) Are mortality Rates Falling at Extremely High Ages? An Investigation Based on a model proposed by Coale and Kisker. Population Studies 49: 281–295.
21. Greville TNE (1943) Short methods of constructing Abridged Life Tables. The Record of American Institute of Actuaries part 1 32(65): 29–42.
22. Vaupal JW and Yashin AI (1986) Cancer rate over age, Time and Place: Insights from stochastic Models of Heterogeneous Population. IIASA working paper wp: 86–59. Laxenburg, Austria: International Institute for Applied System Analysis. 23. Coale AJ, Shaomin L (1991) The Effect of Age Misreporting in china on the Calculation of Mortality Rates at Very High Ages. Demography 28: 293–301. 24. Elo IT, Preston SH (1992) Effect of Early Life-life conditions on Adult Mortality:
A Review. Population Index 58: 186–212.
25. Khazaeli AA, Xiu L, Curtsinger JW (1995) Stress Experiments as a Means of investigating Age-Specific Mortality in Drosophila Melongaster. Experiment Gerontology 30: 177–84.
26. Beard RE (1959) Note on some mathematical Mortality Models. 302–11 in CIBA foundation Colloquia on Ageing, the Life Span of Animals 5, edited by G.E.W. Wolstenholme and M.O’connor. Boston: Little, Brown and Company. 27. Vaupel JW, Manton KG, Stallard E (1979) The Impact of Heterogeneity in Individual Frailty on the Dynamics of Mortality. Demography 16: 439–454. 28. Redington FM (1969) An Exploration into Patterns of Mortality. Journal of the
institute of Actuaries 95: 243–298.
29. Strehler BL, Mildvan AS (1960) General Theory of Mortality and Aging. Science 132: 14–21.
30. Vaupel JW, Carey JR (1993) Compositional Interpretation of Medfly Mortality. Science 260: 1666–1667.
31. Manton KG, Corder LS, Stallard E (1994) Chronic Disability Trends in Elderly United States Populations: 1982–1994. Proceeding of the National Academy of Sciences 94: 2593–2598.
32. Manton KG, Stallard E, Corder LS (1997) Changes in the Age Dependence of mortality and Disability: Cohort and other Determinants. Demography 34: 135– 158.
33. Finch CE (1990) Longevity, Senescence and the Genome. Chicago: the University of Chicago Press.
34. Sohal RS (1986) The Rate of living Theory: A Contemporary Interpretation. PP 23–44 in Insect Aging: Strategies and Mechanics, edited by KG Collatz and RS Sohal. Berlin: Springer.
35. Masoro EJ (1981) Handbook of Physiology of Aging. Boca Raton, FL: CRC Press.O’Rourke MA, JR Feussner, P Feigl and J Laszlo. (1987). ‘‘Age Trend of lung Cancer stage at diagnosis.’’ Journal of American Medical Association, 258: 921–926.
36. Masoro EJ (1985)Metabolism. Handbook of the Biology of Ageing, 2nd
edition, edited by C E Finch and EL Scnnider, New York: Van Nostrand Reinnold. 37. Grove GL, Kligman AM (1983) Age-associated Changes in Human Epidermal
Cell Renewal. Journal of Gerontology 38: 137–142.
38. Kaesberg PR, Ershler WB (1989) The Change in Tumor Aggressiveness with Age: Lessons from Experimental Animals. Seminars in Oncology 16: 28–33. 39. O’Rourke MA, Feussner JR, Feigl P, Laszlo J (1987) Age Trends of Lung
Cancer Stage at Diagnosis. Journal of American Medical Association 258: 921– 926.