1 THIAGO BARROS BRITO
Agent-Based Simulation for Yard Management in Container Terminal
Operations
2 THIAGO BARROS BRITO
Agent-Based Simulation for Yard Management in Container Terminal
Operations
Tese apresentada ao Departamento de
Engenharia Naval e Oceânica para obtenção do título de Doutor em Ciências
4 THIAGO BARROS BRITO
Agent-Based Simulation for Yard Management in Container Terminal
Operations
Tese apresentada ao Departamento de
Engenharia Naval e Oceânica para obtenção do título de Doutor em Ciências
Área de Concentração: Engenharia Naval e Oceânica
Orientador: Prof. Dr. Rui Carlos Botter
5 AGRADECIMENTO
Ao Prof. Dr. Rui Carlos Botter, pela orientação, incentivo e oportunidades oferecidas. Ao Prof. Dr. Ralf Elbert, pela oportunidade acadêmica propiciada durante o doutorado. Aos amigos e amigas dos caminhos da pós-graduação da USP, companheiros de momentos alegres e difíceis, e aos novos amigos da TU Darmstadt, que me impulsionaram nesse caminho.
Aos amigos da Galápagos e agregados, cuja importância é dispensável de comentários. A todos que, de uma forma ou outra, transformaram todos esses anos na Politécnica nos melhores anos da minha vida.
À Ingrid Fang, pelo amor, carinho e compreensão durante o tempo de elaboração desse trabalho.
6 RESUMO
Terminais de contêineres (TC) e sistemas logísticos em geral, estão atualmente imersos em estruturas de negócio e ambientes operacionais altamente complexos e dinâmicos. Nesse ambiente, pesquisadores e usuários das ferramentas de PO são requisitados a resolver novos tipos de problemas, que surgem a partir de uma crescente complexidade interativa entre os elementos que constituem esses sistemas. Entretanto, parece estar faltando aos tomadores de decisão ferramentas capazes de lidar com sistemas que necessitam a consideração de processos interdependentes, compostos por elementos interagindo e tomando decisões de maneira descentralizada. Neste cenário, a simulação baseada em agentes (SBA) é tida como uma ferramenta potencial para o desenvolvimento e análise de sistemas logísticos, uma vez que ela é capaz de construir análises de sistemas cujo comportamento está associado a propriedades emergentes decorrentes das interações entre seus componentes (agentes). Assim, a SBA é considerada uma possibilidade de abordagem para sistemas logísticos, capaz de tratar questões complexas ainda não tangenciadas por metodologias de simulação tradicionais. Apesar do potencial alegado, a aplicação da SBA ainda é incipiente no campo logístico, representada com baixo nível de maturidade na literatura. Dessa forma, o objetivo do trabalho é desenvolver uma aplicação SBA representando uma operação
full-scale do pátio de um TC, a fim de confirmar a SBA como uma ferramenta potencial
para representar sistemas logísticos , capaz de apoiar processos de tomada de decisão maduros. Com base no desenvolvimento proposto foi possível, metodologicamente e de maneira prática, avaliar a utilização de SBA, seus benefícios, dificuldades, desdobramentos técnicos e outras questões. Essa avaliação permitiu concluir que a SBA cumpre as promessas de flexibilidade, representatividade e potencial de sofisticação para representação de sistemas logísticos. Além disso, observou-se que a metodologia foi capaz de estender sua contribuição no sentido de expandir algumas das fronteiras conceituais da metodologia de simulação, tais como a discussão sobre o conceito de modelagem genérica e a integração entre simulação-otimização.
7 ABSTRACT
Container terminals (CTs), and logistics systems in general, are nowadays immersed in a dynamic and highly complex business and operational environment. Thus, researches and users of OR are being called to solve new types of logistics system problems, born from this growing interactive complexity between the system’s elements. However, what seems to be missing in the decision-makers OR toolbox are tools able to deal with systems that need to consider several interconnected and interdepend functions and process. In this scenario, agent-based simulation (ABS) is considered to hold high promises for developing complex logistics systems, based on the fact that it is able to build analysis of systems whose behavior is associated to emergent properties deriving from interactions between its basic constituent elements (agents). ABS is considered rather a new approach for simulating systems, able to challenge more complex questions, not answered by traditional simulation methodology. Despite the advocate potential of ABS, its application still incipient within the logistic field, lacking in terms of maturity in literarture. In that way, the objective of the work is to develop an ABS application representing a full-scale CT yard management operation, in order to confirm ABS as a potential tool to represent logistics systems and support mature decision making processes. Based on the proposed development, the work is be able to conceptually, methodologically and practically evaluate the utilization of ABS – its benefits, difficulties, application unfolding, new representation boundaries and other possibilities. This evaluation allowed concluding that the ABS fulfills the high flexibility, representability and promises for logistics systems, even extending its contribution to some of the conceptual frontiers of the simulation methodology, such as generic modeling methodology discussion and simulation-optimization integration.
8 CONTENTS
LIST OF FIGURES ... 13
LIST OF TABLES ... 17
LIST OF ACRONYMS ... 22
1 INTRODUCTION ... 23
1.1 Motivation and objectives ... 23
1.2 The ABS methodology ... 26
1.3 Scientific contributions ... 29
1.4 Objectives roadmap ... 30
1.5 Thesis structure ... 31
2 CONTAINER TERMINAL AS A COMPLEX LOGISTIC SYSTEM ... 33
2.1 Containerization and global trade trends ... 33
2.2 Compendious overview of container terminals ... 34
2.3 CT management and decision-making ... 39
2.3.1 Container terminal management objectives and tools ... 41
2.4 OR Application to CT operations ... 43
2.4.1 Simulation application to CT operations ... 44
3 OVERVIEW ONTO AGENT-BASED SIMULATION IN LOGISTIC SYSTEMS ... 50
3.1 ABS review guideline ... 50
3.1.1 ABS methodology ... 51
3.1.2 ABS background ... 52
3.1.3 Thinking trough ABS ... 52
3.1.4 Agent concept ... 53
3.2 ABS application potential ... 54
9
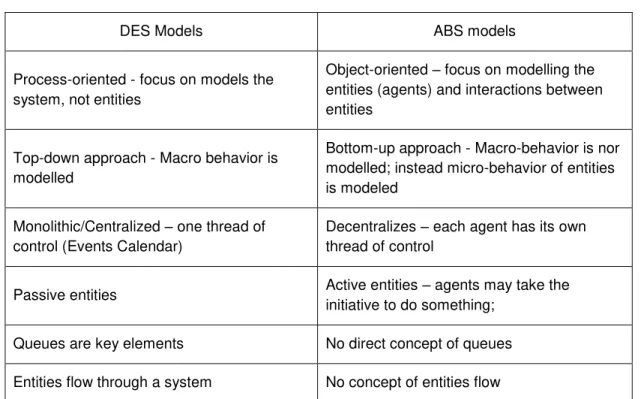
3.3.1 ABS versus DES ... 58
3.3.2 ABS as DES replacement ... 61
3.3.3 ABS purity ... 64
3.3.4 Evoking good modeling practices ... 65
3.4 Defining ABS utility to logistic systems ... 65
3.4.1 Measuring ABS utility ... 66
3.4.2 Proposing ABS utility to logistic systems ... 69
3.5 Conclusion on the call for ABS in logistic system ... 70
4 REVIEW ON ABS IN LOGISTICS SYSTEMS ... 71
4.1 Relative ABS positioning versus DES ... 71
4.2 ABS maturity taxonomy ... 73
4.2.1 Problem categorization ... 73
4.2.2 Implementation complexity ... 74
4.2.3 Results evaluation ... 74
4.2.4 Literature type ... 75
4.2.5 Taxonomy structure ... 75
4.2.6 Analysis of survey ... 75
4.3 Conclusion on ABS maturity logistic-related application... 80
5 FRAMEWORK FOR THE DEVELOPMENT OF A MATURE ABS APPLICATION IN CT OPERATIONS ... 84
5.1 Defining the research application gap ... 84
5.2 Narrowing the ABS model scope within CT management environment ... 86
5.2.1 Yard management operations modelling proposal ... 86
5.3 Yard management operations problem definition ... 87
10
5.5 Formalizing the topic for an ABS development ... 91
6 PROBLEM DESCRIPTION AND CONCEPTUAL MODEL ... 92
6.1 Model application goals ... 92
6.2 Model scope definition ... 93
6.3 System description ... 97
6.4 System conceptualization ... 98
6.5 ABS Model Development Methodology ... 101
7 ABS STRUCTURAL MODEL ... 102
7.1 Agents definition ... 102
7.2 Relational model ... 107
7.3 Class diagram ... 109
7.4 Class instances descriptions, methods, state diagrams ... 111
7.4.1 Road Class ... 111
7.4.2 Road Connection Class ... 114
7.4.3 Gate Class ... 118
7.4.4 Process Machine Class ... 122
7.4.5 Parking Lot Class ... 124
7.4.6 Yard Block Class ... 126
7.4.7 Handling Equipment Class ... 128
7.4.8 Berth Class ... 132
7.4.9 Maritime Service Class ... 133
7.4.10 Vessel Class ... 137
7.4.11 Quay Crane Class ... 140
7.4.12 Horizontal Transportation Class ... 142
11
7.4.14 Flow Order Class ... 150
7.5 Flows Quantification ... 155
8 ABS MODEL DEVELOPMENT ... 157
8.1 Base Scenario – Verification & Validation ... 157
8.1.1 KPIs definition ... 158
8.1.2 Validation ... 158
9 EXPERIMENTS:... 163
9.1 Experiment 1 – New layouts testing ... 163
9.1.1 Results for Experiment 1 ... 172
9.2 Experiment 2 – Yard Balancing Optimization ... 181
9.2.1 Results for Experiment 2 ... 184
9.3 Experiment 3 – Routing Algorithm ... 189
9.3.1 Results for Experiment 3 ... 191
10 CONCLUSIONS AND FURTHER STUDIES ... 194
10.1 Suggestion for further works ... 202
11 REFERENCES ... 203
12 ANNEX A – ABS METHODOLOGICAL SCOPE ... 227
12.1 easyABMS ... 227
12.1.1 System Analysis ... 229
12.1.2 Conceptual System Modeling ... 230
12.1.3 Simulation Design ... 231
12.1.4 The other simulation related phases ... 233
12.2 AnyLogic ... 233
13 ANNEX B - CLASS INSTANCES FULL LIST ... 235
12
13.2 Road Connection Class Intances List ... 237
14 ANNEX C - CT MARITIME SERVICE SCHEDULE ... 239
15 ANNEX D - DIJKSTRA ALGORITHM ... 240
16 ANNEX E - EXAMPLE OF THE BASE SCENARIO ROUTES ... 242
17 ANNEX F - FLOW TYPE ROUTE POINT COLLECTION ... 246
18 ANNEX G - BASE SCENARIO RESULTS ... 255
18.1 Truck Cycle – Times ... 255
18.1.1 Truck Cycle – Times Histograms ... 256
18.2 Yard Container Stock ... 259
18.2.1 In the CT ... 259
13 LIST OF FIGURES
Figure 1 – Generic conceptual structure of the ABS CT representation ... 25
Figure 2 - Logical and orderly steps to fulfill the final goal ... 31
Figure 3 - Number of container handlings worldwide (2000-2012) (THE WORLD BANK, 2013) ... 34
Figure 4 – Container terminal representation and its interfaces (GUDELJ; KRčUM; TWRDY, 2010) ... 35
Figure 5 – Subsystems of a container terminal (based on (SHARIF, 2011) and (HENESEY, 2006)) ... 36
Figure 6 – CT utilization rates in the world in 2010 and 2016 forecast (DREWRY MARITIME RESEARCH, 2010) ... 37
Figure 7 – Physical expansion restriction at (a) Porto de Santos (Brazil) and (b) Long Beach Port (USA) (adapted from GoogleMaps) ... 38
Figure 8 – Main elements of the subsystem of a CT (BIELLI; BOULMAKOUL; RIDA, 2006) ... 40
Figure 9 – Planning problems in container terminal (BIERWIRTH; MEISEL, 2010) ... 41
Figure 10 – Number of journal papers by sub-set problem (based on (ISLAM; OLSEN, 2013)) ... 45
Figure 11 – Typical agent characteristics (based on (MACAL; NORTH, 2010)) ... 54
Figure 12 – Conversion of a DES model into an ABS model (BORSHCHEV; FILIPPOV, 2004) ... 59
Figure 13 – Redefinition of the model including events associated with entities (BORSHCHEV; FILIPPOV, 2004) ... 60
Figure 14 – Evolution of number of logistic-related works in DES and ABS ... 72
Figure 15 – Percentage distribution of evaluation and validation processes ... 82
Figure 16 – Percentage distribution of literature type analysis ... 82
Figure 17 – Framework of the research development proposal ... 85
Figure 18 – “Yard Management Operations” framework of the research development proposal ... 87
Figure 19 – Logical and functional yard management model architecture ... 94
14
Figure 21 – Landside loading and unloading operation representation ... 95
Figure 22 – Yard Stacking operation representation ... 96
Figure 23 – Horizontal transportation flow representation ... 97
Figure 24 – Terminal market-share evolution 2006-2015 ... 97
Figure 25 – ABS conceptual model ... 99
Figure 26 – Relational model of the system ... 108
Figure 27 – System Class Diagram ... 110
Figure 28 – Road class diagram ... 111
Figure 29 – Evolution of the (Wang, 2010) speed x density function to the proposed three-behavioral- segmented-linear function ... 112
Figure 30 –‘calculateSpeed’ action chart function ... 113
Figure 31 –‘calculateSpeed’ table (speedFactor,density) ... 113
Figure 32 – Road Connection class diagram... 114
Figure 33 – Road Connection inheritance ... 115
Figure 34 – Train Crossing class diagram ... 115
Figure 35 –‘blockTrain’ state chart ... 116
Figure 36 – Simple Crossing class diagram ... 116
Figure 37 – X Crossing class diagram ... 117
Figure 38 –‘sharingRule’ action chart function... 117
Figure 39 – Gate Class diagram ... 118
Figure 40 – Gate class inheritance ... 118
Figure 41 – Gate In class diagram ... 119
Figure 42 – Gate In class diagram ... 120
Figure 43 – ‘getGateInProcessTime’ and ‘getGateOutProcessTime’ action chart function ... 121
Figure 44 – Process Machine class diagram ... 122
Figure 45 – Process Machine class inheritance ... 122
Figure 46 – Scale diagram ... 123
Figure 47 – Scanner class diagram ... 123
15
Figure 49 – Parking Lot class diagram ... 125
Figure 50 – Parking Lot action chart function ... 126
Figure 51 – Yard Block class diagram ... 126
Figure 52 – Handling Equipment class diagram ... 128
Figure 53 – Handling Equipment class inheritance ... 128
Figure 54 – RTG class diagram ... 129
Figure 55 –RTG ‘calculateHandlingTime’ function ... 130
Figure 56 – Reach Stacker class diagram ... 130
Figure 57 – Reach Stacker ‘calculateRSHandlingTime’ function... 131
Figure 58 – ‘calculateRTGHandlingTime’ and ‘calculateRSHandlingTime’ action chart function ... 131
Figure 59 – Berth class diagram ... 133
Figure 60 – Maritime Service class diagram... 134
Figure 61 –‘createVessel’ action chart function ... 136
Figure 62 – Vessel class diagram ... 137
Figure 63 –‘assignBerth’ action chart function ... 138
Figure 64 –‘generateFlow’ action chart function ... 139
Figure 65 – Quay Crane class diagram ... 140
Figure 66 –‘calculateHandlingProductivity’ action chart function ... 141
Figure 67 – Horizontal Transportation class diagram ... 142
Figure 68 – Horizontal Transportation class inheritance ... 142
Figure 69 – Relationship between the Horizontal Transportation class and the Flow Order child class instances in order to share information to the ‘createRoute’ method ... 144
Figure 70 –‘requestNextConnection´ action chart function ... 146
Figure 71 – Internal Truck child class diagram ... 146
Figure 72 – External Truck child class diagram ... 147
Figure 73 – Container class diagram ... 149
Figure 74 – Flow Order class diagram ... 150
Figure 75 – Flows quantification diagram ... 156
Figure 76 – CT yard occupancy in percentage ... 161
16
Figure 78 – Scenario 1 yard blocks occupancy % during average week ... 178
Figure 79 – Scenario 2 yard blocks occupancy % during average week ... 179
Figure 80 – Scenario 3 yard blocks occupancy % during average week ... 179
Figure 81 – Flow order class diagram revisited ... 181
Figure 82 –Attractiveness parameter for the ‘balanceFlow’ function ... 184
Figure 83 –Yard blocks occupancy % during average week, for scenario 1 regular and with ‘balanceFlow’ method ... 188
Figure 84 – ‘createRoute’ and ‘requestNextPoint’ methods retro-alimentation process in (1) regular routing and (2) dynamic routing process ... 190
Figure 85 – New data exchange process for dynamic routing ... 190
Figure 86 – Identification of the methodological boost provided by the ABS model, , in the proposed development context ... 197
Figure 87 – ABS x DES total development cost, considering multiple experiments proposition, in the proposed development context ... 198
Figure 88 – ABS x DES experiment unitary cost, considering multiple experiments proposition, in the proposed development context ... 198
Figure 89 – Classification according to the interaction between simulation and optimization: simulation purpose and hierarchical structure ... 201
Figure 90 – The reference process of the easyABMS methodology (GARRO; RUSSO, 2010) ... 228
Figure 91 – CT maritime service schedule ... 239
Figure 92 – Flow times histograms – Flow 1.1 to 3.2 ... 256
Figure 93 – Flow times histograms – Flow 4.1 to 7.1 ... 257
Figure 94 – Flow times histograms – Flow 7.2 to 10.4 ... 258
Figure 95 – Quantity of containers in the CT in base scenario ... 259
17 LIST OF TABLES
Table 1 – Example of relevant works using an inter-related subsystem environment
simulation approach ... 46
Table 2 – Main attributes of ABS and DES models – based on (SIEBERS et al., 2010) . 58 Table 3 – Intersections between the proposed characteristics of ABS application candidate systems/problems and logistic systems ... 68
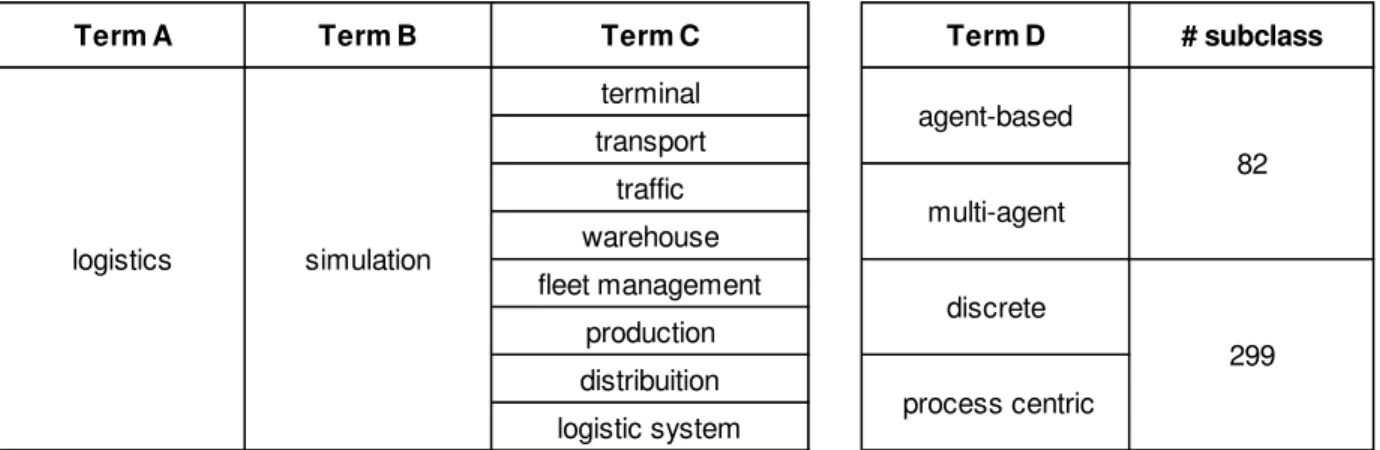
Table 4 – Research mapping in Web of Science ... 71
Table 5 – List of logistic domains ... 73
Table 6 – Maturity taxonomy structure ... 76
Table 7 – Maturity analysis survey (1 of 3) ... 77
Table 8 – Maturity analysis survey (2 of 3) ... 78
Table 9 – Maturity analysis survey (3 of 3) ... 79
Table 10 – ABS application covering into logistic domains ... 81
Table 11 – Maturity level analysis ... 81
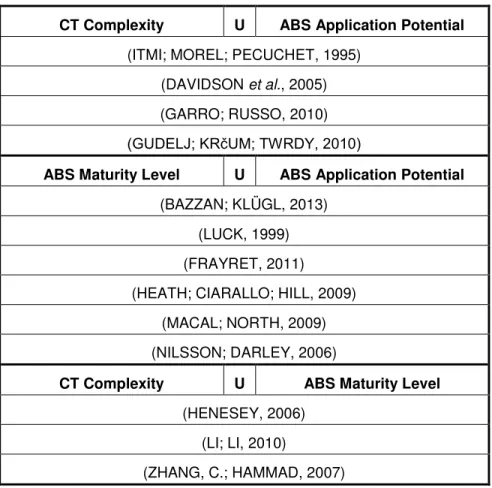
Table 12 – Examples of works tangential to CT complexity, ABS application and ABS maturity ... 85
Table 13 – Main selected studies in the yard management area (1 of 3) ... 88
Table 14 – Main selected studies in the yard management area (2 of 3) ... 89
Table 15 – Main selected studies in the yard management area (3 of 3) ... 90
Table 16 – Recommended ratio area/berth (DUCRUET; ITOH, 2014) ... 98
Table 17 – Definition of the conceptual elements of the ABS application ... 100
Table 18 – Definition of the model’s agents ... 103
Table 19 – List of representative container flows to the CT yard management operation ... 107
Table 20 – Road instances list example ... 114
Table 21 – Road connection instances example ... 118
Table 22 – ‘getGateInProcessTime’ an ‘getGateOutProcessTime’ tables function ... 120
Table 23 – Gates instances ... 121
Table 24 – ‘getGateInProcessTime’ an ‘calculateScanTime’ tables function ... 124
Table 25 – Process machines instances ... 124
18
Table 27 – Yard block instances ... 127
Table 28 – Handling equipment instances ... 132
Table 29 – Berth instances ... 133
Table 30 – Maritime services instances ... 137
Table 31 – Vessel Class instances ... 140
Table 32 – Quay Crane Class instances ... 142
Table 33 – Internal Truck child class instances ... 147
Table 34 – External Truck instances weekly arrival schedule ... 148
Table 35 – External Truck instances daily arrival schedule ... 148
Table 36 – External Truck child class instances ... 148
Table 37 – Container Class instances ... 150
Table 38 – Description of flows within the CT yard management ... 151
Table 39 – Flows Types fragmentation (1 of 2) ... 152
Table 40 – Flows Types fragmentation (2 of 2) ... 153
Table 41 – Flow type 1.1 fragmentation structure and routePoints collection possibilities ... 154
Table 42 – Main system KPIs description ... 158
Table 43 – Truck cycle KPIs validation ... 159
Table 44 – Vessel productivity KPIs validation ... 160
Table 45 – Most congested roads in the CT (< 60% of maximum speed) ... 161
Table 46 –New road connection instances in scenario 2 ... 165
Table 47 – Road connection that no longer exist in scenario 2 ... 165
Table 48 – Road connection instances with new parameters in scenario 2 ... 165
Table 49 –New road instances in scenario 2 ... 166
Table 50 – Road instances with new parameters in scenario 2... 166
Table 51 – Road instances that no longer exist in scenario 2 ... 167
Table 52 –New yard block instances in scenario 2 ... 168
Table 53 – Yard block instances with new parameters in scenario 2 ... 168
Table 54 – Yard block instances that no longer exist in scenario 2 ... 168
Table 55 – Quay crane equipment instances in scenario 2 ... 168
19
Table 57 – New handling equipment block instances in scenario 2 ... 169
Table 58 – Handling equipment instances that no longer exist in scenario 2 ... 169
Table 59 - Berth instances with new parameters in scenario 2 ... 169
Table 60 - Flow instances with new parameters in scenario 2 (1 of 2) ... 170
Table 61 - Flow instances with new parameters in scenario 2 (2 of 2) ... 171
Table 62 - Flow instances that no longer exit in scenario 2 ... 171
Table 63 - Average truck cycle flows (in minutes), for all critical layout scenarios... 172
Table 64 - Average truck cycle flow (in % compared to ‘as is’), for all critical layout scenarios ... 173
Table 65 – Aggregated analysis of average truck cycle (in minutes), for all critical layout scenarios ... 174
Table 66 – Aggregated analysis of average truck cycle (% compared to ‘as is’), for all critical layout scenarios ... 174
Table 67 – Services average operation time (in hours and relative %), for all critical layout scenarios ... 175
Table 68 – Services average handling productivity (in mph and relative %), for all critical layout scenarios ... 176
Table 69 –Scenario ‘As Is’ services time line ... 176
Table 70 – Scenario 1 services time line ... 177
Table 71 – Scenario 2 services time line ... 177
Table 72 – Scenario 3 services time line ... 177
Table 73 – Average yard blocks and total CT occupancy levels (in %) ... 180
Table 74 – Identification of the yard block attractiveness index and final routePoint attraction... 183
Table 75 - Flows average truck cycle (in minutes and %), for scenario 1 regular and with ‘balanceFlow’ method ... 185
Table 76 – Consolidated flows average times (in minutes) for scenario 1 regular and with ‘balanceFlow’ method ... 186
20 Table 78 – Service average productivity (in mph), for scenario 1 regular and with
‘balanceFlow’ method ... 187
Table 79 –Average yard blocks occupancy, for scenario 1 regular and with ‘balanceFlow’ method ... 188
Table 80 - Flows average truck cycle (in minutes and %), for scenario 1 with ‘balanceFlow’ method and dynamic routing system ... 191
Table 81 – Consolidated flows average times (in minutes) for scenario 1 with ‘balance flow’ method and dynamic routing system ... 192
Table 82 – Services average operational times (in hours), for scenario 1 with ‘balanceFlow’ method and dynamic routing ... 193
Table 83 – Service average productivity (in mph), for scenario 1 with ‘balanceFlow’ method and dynamics routing ... 193
Table 84 – Road class instances list (1 of 2) ... 235
Table 85 – Road class instances list (2 of 2) ... 236
Table 86 – Road Connection class instances list (1 of 2) ... 237
Table 87 – Road Connection class instances list (2 of 2) ... 238
Table 88 – Shortest routes departing from node n1 to all nodes in the system (1 of 4) . 242 Table 89 – Shortest routes departing from node n1 to all nodes in the system (2 of 4) . 243 Table 90 – Shortest routes departing from node n1 to all nodes in the system (3 of 4) . 244 Table 91 – Shortest routes departing from node n1 to all nodes in the system (4 of 4) . 245 Table 92 – Flow type 1.1 fragmentation structure and routePoints collection ... 246
Table 93 – Flow type 1.2 fragmentation structure and routePoints collection ... 247
Table 94 – Flow type 2.1 fragmentation structure and routePoints collection ... 248
Table 95 – Flow type 2.2 fragmentation structure and routePoints collection ... 248
Table 96 – Flow type 3.1 fragmentation structure and routePoints collection ... 249
Table 97 – Flow type 3.2 fragmentation structure and routePoints collection ... 250
Table 98 – Flow type 4.1 fragmentation structure and routePoints collection ... 251
Table 99 – Flow type 4.1 fragmentation structure and routePoints collection ... 251
Table 100 – Flow type 5.1 fragmentation structure and routePoints collection ... 251
Table 101 – Flow type 5.2 fragmentation structure and routePoints collection ... 251
21
Table 103 – Flow type 7.1 fragmentation structure and routePoints collection ... 252
Table 104 – Flow type 7.2 fragmentation structure and routePoints collection ... 252
Table 105 – Flow type 8.0 fragmentation structure and routePoints collection possibilities ... 252
Table 106 – Flow type 9.0 fragmentation structure and routePoints collection ... 253
Table 107 – Flow type 10.1 fragmentation structure and routePoints collection ... 253
Table 108 – Flow type 10.2 fragmentation structure and routePoints collection ... 254
22 LIST OF ACRONYMS
ABS – Agent Based Simulation CT – Container Terminal
DES – Discrete Event Simulation DSS – Decision Support System
HTOp- Horizontal Transportation Operations IOS – Iterative Optimization-based Simulation KPI – Key Performance Indicator
MPH – Moves per Hour OR – Operations Research QC – Quay Crane
QCA - Quay Crane Assignment Problem RS – Reach-Stacker
RTG – Rubber Tyred Gantry Crane SD – System Dynamics
S-O – Simulation Optimization
23 1 INTRODUCTION
1.1 Motivation and objectives
In recent years container traffic has been growing steadily and this trend is expected to continue. Concomitantly, container vessels are becoming larger in size, in order to handle the increasing volume of containers (HAN et al., 2008). As a consequence,
current container terminals (CTs) handling and storage capacity in many parts of the world is becoming insufficient to handle this growing volume of cargo (HENESEY, 2006). Expected consequences are the depletion of the service level provided to container vessels and other interconnection transportation modes (i.e. longer turn around processing time, longer queues, higher utilization rates, etc.) and many other direct and indirect consequences.
In order to meet the increasing container handling demand, CTs will have no option but to increase capacity. That possibility may rely on either physical expansion or on improvement on the management of CT logistics activities processes. Physical expansion however relies on a number of external factors (such as land availability, politics, financial viability, massive capital availability, etc.), that may influence investments decision non-predictably. Therefore, improvements in the performance of CTs would potentially better rely on the improvement on CT logistics management processes, naturally characterized by a more rational resources rates utilization and/or new technologies/equipment employment.
24 that interact, whose overall performance depends upon a wide mix of factors affecting the individual subsystems, but also is determined by the interaction process between the subsystems.
In addition, there has been in recent years a growing interest in decentralized OR approaches, especially regarding agent-based technologies. The agent-approach is considered to hold high promises for developing complex logistics systems (JENNINGS, 2000) such as CTs: agent-based solutions, due to concept of agent – an independent, autonomous, goal-seeking, reactive, social and adaptive element, are alleged to be able to efficiently handle the complexity of those dynamic and multi-part systems.
Bearing in mind that simulation is the forefront OR applied methodology in complex logistics systems, as stated by Siebers et al. (2010), Davidson (2001), Brito; Botter and
Trevisan (2011), this work proposes the implementation of an agent-based simulation (ABS) approach to represent the yard management logistics processes in a CT. The yard management issue comprises a couple of CT planning problems, such as the horizontal transportation operations and yard cranes (RTG, reach-stackers, etc.) schedule, faceted with the quay crane (QC) and the intermodal operations.
The proposition is to develop an approach that will be able to proper represent the system operation, and through a decentralized decision system - the ABS model - build strategies and policies that may increase the performance of the CT yard, incurring in a general better CT performance. For that, the work will describe and represent a variety of inter-related yard management decisions made during daily operations at a CT, such as container retrieving/positioning, container re-balancing, horizontal transportation resources routing and availability, yard handling equipment operation, and others that will be introduced during the model development phase. Based on that representation, general yard management policies may the proposed and tested. The conceptualization of the generic-proposed CT ABS model is represented in Figure 1, representing the main components and relationships of the system.
25 representation boundaries and other possibilities. This evaluation will allow concluding whether or not the ABS fulfills the high flexibility, representability and promises for logistics systems.
Figure 1 – Generic conceptual structure of the ABS CT representation
(.
..)
S
ta
te
1
S
ta
te
2
S
ta
te
3
C
ontaine
r
Population
S
ta
te
1
S
ta
te
2
S
ta
te
3
H
andling
Equipem
ent
F
leet
Env
iron
26 It is important to contextualize that the ABS proposed approach totally differs from the traditional approach applied to complex logistics systems, based on process-centric representation (i.e. traditional simulation approach – Discrete Event Simulation (DES), optimization/heuristic routines and analytical propositions). In that sense, it is relevant to bring that discussion to light, in order to understand ABS and DES relationship - complementarity and conflicting points, becoming able to propose a more suitable methodology to represent CT operation (and similar logistic systems).
Finally, the goal of the proposed simulation model is also to experiment with the system, being able to evaluate the main CT KPIs, such as vessel´s operation (loading/unloading) times, planning and utilization container handling resources fleet, horizontal transportation flow times and queue times, etc., in order to improve CT performance. This experimentation process possibility represents in fact the purpose of building a mature CT management ABS tool, able to be applied to a full-scale problem.
1.2 The ABS methodology
ABS is considered rather a new approach for simulating systems, able to challenge more complex questions that were not until now answered by traditional simulation methodologies and OR in many research fields (social science, economics, biology, financial and business application fields (GILBERT, 2008) (CHAN; SON ; MACAL, 2010) (MACAL; NORTH, 2007) (BONABEAU, 2002).
Meanwhile traditional simulation models (i.e. DES models) have proven to be a reliable and convenient tool to support decision process-based making in complex logistics systems, and have been already extensively used to study CT operations - (SUN et al.,
2012) (LI; LI, 2010) (GAMBARDELLA; RIZZOLI ; ZAFFALON, 1998), while ABS methodology are still starting to find its way within the logistics domain.
27 measurement (RUSSEL; NORVIG, 2003), are able to jointly produce emergent phenomena and represent complex systems of challenging and/or limited representation based on traditional simulation approaches (FEBBER, 1995). This concept is extensible to a general ABS framework definition proposition.
Nowadays logistics systems are settled in dynamic and complex business and operational environments. Inevitably immersed in that complexity, the “modern” logistics domain offers challenging problems characterized by specific properties that transmute into arduously solvable problems through traditional approaches (POKAHR et al., 2009):
High complexity: numerous components, complex behavior and interconnected in various ways.
Large decision spaces: solutions have a multitude of options and multiple decision variables need to be taken into account.
Real-time data: fast changing world needs processing of up-to-date data;
Uncertainty: usually partial or incomplete knowledge is available and decision have to be taken, making robustness in decision making relevant;
Numerous decision makers: offer distinguished priorities about the performance of the logistic system, regarding their responsibilities in the logistic process;
Highly constrained: many constrains (either hard or soft) need to be fulfilled in order to plan logistics activities;
In this increasingly complex scenario, it is credible that solutions will tend not to show up in a deliberate way, but in an emergent one (WHTTINGTON, 2002). In that sense, what seems to be missing in the decision-makers OR toolbox are methods and tools able to deal with systems that need to include several logistics functions or process which are interconnected and interdependent (NILSSON; DARLEY, 2006). Thus, ABS, as previously introduced, can be considered as a potential methodology to support this new era for logistics-OR decision tools building.
28 methodologies employment. In that sense, prior to the development of an ABS logistic system representation, some key point need to be explored.
Firstly regarding the interaction, substitutability and conjunction of the two most traditional simulation paradigms (i.e., DES and the ABS). This work strives for the characterization of ABS and DES as complementary methodologies, and not as competitive. Despite a wealth of academic works suggesting ABS as a reinvigorated OR cornerstone methodology, able to replace DES, there are still few examples of genuine practical applications where ABS might be recalled as an unequivocally central piece in complex OR system modelling (BRAILSFORD, 2012). Rather, it is observed that OR possibly combines the two methodologies to create more efficient models.
Secondly, regarding the lack of maturity of ABS development and application in logistic systems. Despite the advocate advantages of ABS and its potential application in logistics systems, its application is still incipient in terms of sophistication, extensibility and representability. The methodology is still trying to build a rigorous conceptual foundation within OR domain, and meanwhile application is mostly based on partially-implemented and theoretical models.
Thus, two considerations should be incorporated in this work and somehow discussed and fulfilled, providing richer insights and discernment on the real possibilities of the application of ABS to complex logistics systems:
understanding how and when it should or need to interact with DES, proposing and effective interchangeability between methodologies;
pursuing a higher development maturity level of ABS models within logistics field – i.e. being able to propose a full-scale deployed system, considering proper representation, validation and application processes of the model;
29 1.3 Scientific contributions
At this point, it is possible to describe the main expected academic contributions of the research:
the first main academic contribution derives from the effort to introduce ABS as a potential tool to represent logistics systems and support real decision making processes in the research field. There exist already ABS applications into logistics systems, but most of them lack in maturity level (BAZZAN; KLÜGL, 2013): real-world cases pose the main challenge with their size, complexity, and issues related to robustness to potential failure. This work proposes an effort to close the gap between theory and practice in ABS logistic-related research field, with the proposition and development of a mature ABS application in logistic systems.
the second one is related with the methodological comparison between ABS and DES. There is no work in the literature that compiles a comprehensive literature review on the commutability and complementarity of both methodologies. In fact, most authors (particularly in the logistics-related field), tend to perceive methodologies as totally apart. What this work proposes is a methodological and practical investigation that classifies ABS and DES as complimentary methodologies, more specifically DES as a proper subset of ABS. Methodologies need to be understood not as competitive, but as coexisting and cooperative methodologies, that are able together to deliver a more powerful modeling tool to logistics systems;
the third main contribution of the work is inherent to its development: the fact that the proposed ABS model – the representation of the management process of yard operations in CTs, in terms of sophistication, extensibility and representability, as it is being proposed – aiming at evaluating the container handling processes, equipment processes and utilization rates and others KPIs in order to improve the general performance of the CT, is an absolute novel approach to the problem.
30 characteristics such as the ABS models flexibility and extensibility. The two possible powered research fields in this research are the ‘Generic Modeling Development’ and the ‘Simulation-Optimization’ (S-O), more specifically the ‘Simulation with Optimization-based Iterations’ (SOI). The ‘Generic Modeling’ research field is boosted by the ABS re-usability potential, based on the methodology capacity to build up a system (and the relationships of the elements) and on the components extensibility. In that way, repeating structures within the model is straightforward. The S-O research field is boosted by ABS model level of representation potential: using the agent level representation, makes it possible to address problems so far handled only by optimization techniques (reshuffling, remarshaling, container handling minimization, etc.) in a more realistic way - employing a simulation methodology, an thus taking into consideration the ‘reality’ of the system – its variability, randomness, subsystems interdependences, etc. So far, the complexity of representation of CT yard operations (i.e. based on the container element) has been being neglected, either by traditional simulation approach (unable to represent the central figure of the model – the container, or if able to, at a significant development effort) or the optimization approach (unable to represent the variability and randomness of the process).
1.4 Objectives roadmap
As previously stated, and for the sake of formalization, the objective of this work is to develop a Decision Support System (DSS), based on ABS model, in order to represent a CT yard operation and evaluate possible benefits in the yard-management performance derived from the ABS-model propositions and from the methodology itself.
31
Figure 2 - Logical and orderly steps to fulfill the final goal
1.5 Thesis structure
Based on Figure 2, the structure of this thesis is proposed as following:
Chapter 2 defines the object of study of this work, the CT. It goes through its main characteristics, defining it as a complex logistic system and configuring the
Methodological academic contribution propositions mapping
Conceptual evaluation of the ABS model development process
Development of an Yard Management ABS Yard management definition
Identification of the call for ABS is logistic systems/CTs Overview of the application of OR
to CT operations
ABS methodological application scope (EasyABS)
Overview of the application of OR to logistics systems
Framework of the development of a mature ABS application in CT operations ABS maturity evaluation CT problems categorization
ABS Model Experimentation & Results Evaluation
32 management implications, opening field to explore the main OR applications in CTs.
Chapter 3 presents the agent based simulation (ABS) methodology characteristics and main concepts. The ABS is also characterized as potential methodology to logistic systems representation. Also a comparison with the traditional discrete-event (process-centric) simulation is build, in order to understand how they may interact.
Chapter 4 characterizes the ABS as a narrowly explored methodology into logistic systems, revealing its gaps in definition and application in the research field. It is proposed to explore and formalize the maturity level of ABS in logistics systems.
based on the identified gaps, Chapter 5 proposes a general framework for the development of an ABS model to CTs, aiming at creating a mature application that fulfills the previously identified gaps in research;
in Chapter 6 the proposed framework is described into a problem definition and the conceptual ABS model is proposed;
Chapter 7 creates the ABS structural model of the system, with the definition of its main elements, relational model and class diagram, formalizing the structure of the ABS developed tool;
Chapter 8 proposes comments on the model development and validation processes;
after the model development, Chapter 9 runs the proposed experiments with model, created in order to try to assess the claimed ABS representation and sophistication potential;
33 2 CONTAINER TERMINAL AS A COMPLEX LOGISTIC SYSTEM
The perspective of this chapter is to explore the object of study of this work – the CT, and compile elements to define it as a complex logistic system of relatively independent parts that need to work in cooperation to succeed.
The first proposed step is to contextualize the containerization process, from which it derives a compendious overview on CT and its current challenges, as well as an overview of CT management objectives and tools, among which OR represents one of the most important alternative tools.
Following, the chapter aims to provide a broad overview of the application of OR methodologies to CT operations in order to understand both the profusion and the deficiencies in OR CT management research, as well as how the main OR methodologies are employed. As a conclusion, it is possible to identify simulation, specifically agent-based, as a potential methodology to enhance CT management.
2.1 Containerization and global trade trends
The standardized steel shipping container has its origins in the 1950s, and since then has caused deep impact on the global economy. Yet, the functionality and structure that containerization has brought to the economic and transport landscape has not been fully recognized (RODRIGUE; NOTTEBOOM, 2009). Global container fleet reached 35 million TEUs in 2015 (DREWRY MARITIME RESEARCH, 2013). Even more interesting is the observation of the number of times that containers are handled worldwide: an estimated 572 million TEUs were lifted in 2011 (Figure 3) (THE WORLD BANK, 2013), which means more than 18 TEUs handling movements per second.
34 Of course, this trend is influenced by many factors such as world economy geographical distribution, economy of scale, diseconomy of scale, cost reductions, environmental pressures, container shipping companies’ alliances, and others.
Figure 3 - Number of container handlings worldwide (2000-2012) (THE WORLD BANK, 2013)
Evocative to this work is the fact that the development of container shipping industry has also brought impacts to the whole maritime logistic supply chain, which core component is the CT. The increasing demand for container handling results in direct impact to CT management, such as risk of terminal congestion, delivery delay and economic losses. In this sense, this work pledges efforts to understand the impacts and challenges of this remarkable growth of container transportation in CTs.
2.2 Compendious overview of container terminals
In general terms, CT may be described as open systems of material flow with two external interfaces (STEENKEN; VOß; STAHLBOCK, 2004). Those interfaces are:
the quayside - with loading and unloading operations of vessels;
the landside where containers are loaded and unloaded on/off trucks and trains (Figure 4).
376,27
416,75
489,82 516,15
472,18
542,25
580,02 601,77
0,00 100,00 200,00 300,00 400,00 500,00 600,00 700,00
2005 2006 2007 2008 2009 2010 2011 2012
M
il
li
o
n
35
Figure 4 – Container terminal representation and its interfaces (GUDELJ; KRčUM; TWRDY, 2010)
Every maritime CT performs three basic functions: receiving, storing and loading both import (entering the terminal by sea and leaving by land) and export (entering the terminal by land and leaving by sea) containers. Each of these basic functions is described as follows:
receiving process involves the container arrival at the terminal, either as import or as export, recording its arrival, retrieving relevant logistics data and adding it to the current inventory.
storage process is the function of placing the container in a known and recorded location, so it may be retrieved when it is needed.
finally, the loading function involves placing the correct container on the vessel, truck, or other mode of transportation.
36
Figure 5 – Subsystems of a container terminal (based on (SHARIF, 2011) and (HENESEY, 2006))
The flow of containers inside a CT, represent by the arrows in Figure 5, is thus directed related (and restricted) to the throughput capacity of each identified subsystems, therefore determining the whole CT throughput capacity. As stated by Henesey(2006), the performance of a CT depends upon a wide mix of factors affecting the individual subsystems. Thus, much co-ordination between the subsystems is required to ensure a seamless flow of container can be achieved.
However, as common practice, most CT managers and decision-makers are unaware and not capable of planning holistically, failing in adopting an integrated managerial view. In addition and not surprisingly, much effort on research has focused on the subsystems individually, rather than adopting an integrated decision-making view (ZENG; YANG, 2009).
Associated with that flaw, the pressure generate by the increasing container transportation demand in word-wide maritime supply chain, have exposed many problems for CTs, leading to higher requirements on terminals operational capacities (HENESEY, 2006).
Analysis of technical reports of relevant ports around the world, such as Rotterdam - 80% utilization average rate (PORT OF ROTTEDAM, 2013), Hamburg – 75% (HAMBURG
Ship-to-Shore
•(un)loading movement of containers from ship to berth.
Transfer
•movement of containers between berth and storage area
Storage
•temporary storage of stacked containers
Delivery/Receipt
37 PORT AUTHORITY, 2013), Antwerp – 82% (PORT OF ANTWERP, 2013), Santos - 85% (PORT OF SANTOS, 2013) and Genoa - 82% (GENOA PORT AUTHORITY, 2013), confirms that most CTs are operating at a struggling capacity level, leading to terminal congestions. World widely, an evaluation of CT utilization rates reveals that global CT utilization is forecast to grow by 17.7% over the years 2012-2018 (DREWRY MARITIME RESEARCH, 2010) (Figure 6).
Figure 6 – CT utilization rates in the world in 2010 and 2016 forecast (DREWRY MARITIME RESEARCH, 2010)
Congestion affects all involved in CT operation, causing (based on Fiata, (2007)): - to shipping lines: vessel delays, extra fuel costs, missed feeders, etc. - to terminal operators: extra work force, yard congestion, etc.
- to truck and railway companies: longer waiting time, fleet lower productivity rate, etc.
- to shippers: delayed inventories, longer lead times, etc.
Thus, in order to meet the increasing container handling demand, CTs will have no option but to increase capacity: that may rely on either physical expansion or on improvement of the management of CT logistics activities processes.
0.0% 10.0% 20.0% 30.0% 40.0% 50.0% 60.0% 70.0% 80.0% 90.0% 100.0% Far East
South East Asia South America Middle East Central America Africa North America North Europe South Asia World
38 According to Lazic (2007), physical expansion is an option that should be seen as a step that is able to increment capacity, but that alone does not result into maximizing the capacity of the CT. Besides, many seaports around the world do not have the space to physically expand - space is limited due terminal confinement (see Figure 7 to check situations of Porto of Santos and Port of Long Beach, 36th and 21st biggest container ports in the world respectively), and the question is not if CTs are going to run out of space, but rather when. In addition, physical expansion projects costs are usually prohibitive. As an example, the expansion project of Santos Port in Brazil, will spend a total R$ 10 billion (US$ 3 billion) in infrastructure investment, in order to be able to meet demand by the year 2024 (CODESP, 2012).
(a) (b)
Figure 7 – Physical expansion restriction at (a) Porto de Santos (Brazil) and (b) Long Beach Port (USA) (adapted from GoogleMaps)
Even if sufficiently funded to afford physical investments, expansion projects such as the mentioned examples may be not realized due to various other reasons, such as environmental issues, political questions, etc. In addition, the timespan between the project planning and the capacity increase may vary from a couple of years to decades. In that scenario, it is clear that the need for capacity throughput increment in the short-medium time horizon should not be fulfilled only by physical expansion plans, but mainly by management enhancement alternatives, able to provide “optimized” handling and capacity solutions to CTs.
39 level. In a demand increasing scenario (as expected), the terminal needs to be able to handle more containers but keeping operational conditions stable (i.e. keep CT KPI’s service level). That means, in general aspects, being able to better manage logistics resources and processes. Therefore, improvements in the performance of CTs would potentially better rely on the improvement of the management of CT logistics processes, which may be typified by more rational resources utilization.
This rationale discloses a worldwide call for alternative methods for challenging the deterioration of CT performance (LI; LI, 2010). The works of Daganzo (1990), Taleb-Ibrahimi; De Castilho and Daganzo (1993), Legato and Mazza, (2001) and Zeng and Yang (2009), corroborate with this conclusion, suggesting that investment in CT management and strategy is the key element in pursuing capacity maximization.
Not surprisingly, the optimization of CT operations has received increasing interest in the scientific literature over the last years (VACCA; BIERLAIRE; SALANI, 2007). Researchers and practitioners have been trying to improve CT’s operations efficiency from different aspects, from vessel’s arrival process to yard operations.
The works of Vis and De Koster, (2003), Voß (2012), Steenken; Voß and Stahlbock, (2004) and Stahlbock and Voß (2008) provide a comprehensive review of literature on the topic, presenting quantitative and qualitative models, focused on improving CT logistic management and decision-making processes. There are, however, relevant shortcuts on how those models are generally built in the perspective of the decision-making process, which will be discussed next.
2.3 CT management and decision-making
Taking into considerations its subsystems (Figure 5), CTs can be classified as multipart organizations. Consequently - and unfortunately, that is the way that management and decision-making is usually led: management process of CTs is very often fragmented, with differing organizations/decision-making groups handling specifics tasks within the terminal (MURTY et al., 2005).
40
Figure 8 – Main elements of the subsystem of a CT (BIELLI; BOULMAKOUL; RIDA, 2006)
Based on Figure 8 it is easy to identify that most of the CT’s components are shared across two or more subsystems. In that sense, the combined use and planning of several (and expensive) components (resources), such as berths, gates, quay cranes (QC), yard trucks (YT), automated guided-vehicle (AGV), gantry cranes (GC), etc., is a demand that illustrates CT multi-parts interactions, characterizing logistics activities in CTs as particularly complex. Dealing with the complexity that exists in the planning, scheduling and controlling tasks of those resources is therefore a huge challenge.
41
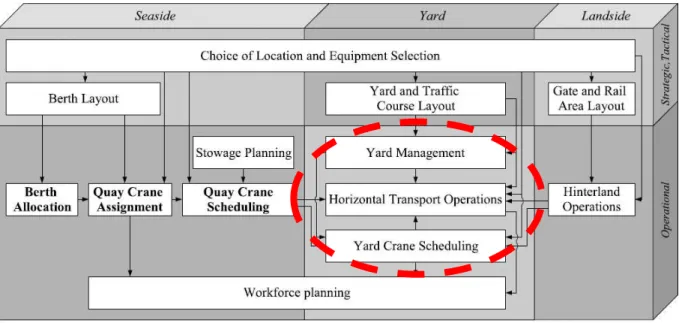
Figure 9 – Planning problems in container terminal (BIERWIRTH; MEISEL, 2010)
Conclusion is that decision-making, in order to fulfill the global objectives of a given CT, must be an integrated task. CT decision-makers must be able to understand their resource availability and characteristics, operational costs, schedules, regulations, and many others (FRANKEL, 1987), as well as contextualizing it in the inherent interdependent network of CT subsystems, in order to be able to achieve rightful benefits and results in the decision-making processes.
2.3.1 Container terminal management objectives and tools
42 CTs may be large, but is particularly determined in terms of an adequate service level offered to shipping companies.
Thus, even though the competitiveness of a container seaport is marked by different success factors, particularly the time in port for ships (turn-around or service time), combined with low rates for loading and discharging (ZHAO; CHENG, 2009) (STEENKEN; VOß; STAHLBOCK, 2004) (GOLIAS; BOILE; THEOFANIS, 2009) and reliability, are crucial factors. In that way, a crucial competitive operational advantage, that encompasses the main success factors, is the fast turnover of containers. It allows reducing the time in port of the container vessels and reduction of the costs of the transshipment process itself (VOß, 2012). That turns into shipping lines having its ships to sail more often.
Additionally, the works of Henesey (2006) and Murty et al. (2005), summarize other
indicators that are used as CT performance measure:
service time – period of time that a vessel is berthed (operating or not);
CT capacity – maximum throughput generated at a CT given a resource configuration;
berth utilization – percentage of time that berth is actually busy (proportionally to the available time);
waiting time – time that vessel waits for available berth;
Clearly, those goals cannot be achieved at the expense of a lower utilization of CT resources. Instead, better capacity and balanced utilization of current CT resources are imperative to assure proper levels of the allegedly CT KPIs. Moreover, global KPIs often propose conflicting circumstances between subsystems, leading to unavoidable trade-offs evaluation requirement. In that sense, world-class research has been trying to fulfill this quest through the proposition of comprehensive OR-based DSSs (LEGATO; MAZZA, 2001) (VAN HEE; HUITINK; LEEGWATER, 1988) (VOß, 2012).
43 between its core planning problems (Figure 9) and other relevant factor such as uncertainty, randomness, etc., derived from its intricate logistics constituent.
In this scenario, in recent years, a large number of techniques from the OR domain have been proposed as CT DSS’s cornerstones, such as optimization, heuristics, linear and non-linear programming, stochastic processes and simulation (BRITO; BOTTER, 2014). Specifically in CT operations management, a number of publications accomplish comprehensive reviews over OR methods applications, such as Bierwirth and Meisel (2010), Vis and De Koster (2003), Vacca; Bierlaire and Salani (2007), Steenken; Voß and Stahlbock (2004), Stahlbock and Voß (2008) and Meersmans and Dekker (2001). the next section proposes a brief overview on how research employs OR methodologies to build DSS in the CT management context.
2.4 OR Application to CT operations
The works of Stahlbock and Voß (2008) and Voß (2012) provide an extensive review on CT management problems and OR application, analyzing together more than 250 works. The works conclude that the increasing number of publications in the last decade indicates the importance of OR methods in the field of optimizing logistic operations at CTs.
However, both works also conclude that most of existing researches mainly focus on a special sub-process of a given CT, not aiming at optimizing the system as a whole but at optimizing several individual parts of the system. As previously discussed, this approach in quite comprehensible, once CTs are easily separated and classed into subsystems (Figure 5) that engage different types of equipment and physical area, and face different challenges in management, thus aiming at different goals.
As an example, one can mention the case presented by Legato et al. (2008): the Quay
44 QCA solution may possibly draw in and suboptimal HTOp solution, generating a poor CT overall performance.
Similar problems can be found for most transport and/or stowage processes at CTs Crainic and Kim (2007) and Monaco; Moccia and Sammara (2009), highlighting the need for efficient and coordinated management of subsystems activities in CT (VIS; DE KOSTER, 2003), (STEENKEN; VOß; STAHLBOCK, 2004) , (STAHLBOCK; VOß, 2008). Therefore, one can conclude that there is a prompt call for management performance coordination and planning tools that can effectively capture the complex nature of the subsystems interrelation of a CT.
It is relevant to emphasize that from all current available OR techniques, the works of Sun et al. (2012), ISL (2012) and (Li and Li (2010) suggest simulation as the unique
methodology able to somehow cover all the spectrum of problem categories in a CT, being able to work with problems that encompass different level of details and different planning horizons. Simulation has been fundamental part of research and development work in CT operations (ANGELOUDIS; BELL, 2011), and has proven to be a convenient tool to support the decision makers.
All other methodology bump into one or more aspects such as the humongous size of the facilities/number of elements; the complexity of equipment/resource utilization process and interactions, the dynamic behavior of equipment/resource, stochastic influence and interdependencies within the sub-systems and resources, or others.
2.4.1 Simulation application to CT operations
Simulation is therefore classified as a well-suited decision support technique for all types of CT planning problems (SAANEN; VERBRAECK; RIJSENVRIJ, 2000), providing room for the development of the so evoked ‘integrated approach’– an approach that reproduce and capture the interaction of multiple subsystems of a CT.
decision-45 making simulation community. Also the work of Li and Li (2010) states that sub-systems simulation integration is currently a favorable study trend for CTs. Likewise, Vacca; Salani and Bierlaire, (2010) claims to have identified a new research trend: the integrated simulation-optimization CT management.
The work of Bruzzone; Giribone and Revetria (1999) goes further and argues that isolated CT system models are likely to produce useless simulation results, as sub-system interdependencies are neglected. The work suggests that full-terminal CT simulation models should be the tonic for realistic developments – one should at least consider the interfaces of single-system models as realistic as possible.
However, despite the simulation integration methodological capability and the holistic approach identified trend, it is possible to select from relevant literature only a small number of works using simulation approach in which the proposition is to create an inter-related subsystem environment, covering multiple aspects of CTs.
To corroborate with that discussion, the work of Islam and Olsen (2013) provides an extensive review of OR application to CT considering the different dimensions (sub-set of decision making problems) and conclude that, from 243 relevant papers, only 21 (8%) present some kind of integrated approach.
Figure 10 – Number of journal papers by sub-set problem (based on (ISLAM; OLSEN, 2013))
Table 1 also summarizes efforts to find examples of relevant CT simulation works in literature that propose some kind of integrated approach.
73
47
41
36
25
21
0 10 20 30 40 50 60 70 80
Horizontal
Transportation Berth AllocationProblem Crane Alocation Storage SpaceAlocation Empty ContainerMovement Integrated Approach
Numb
e
r
of
J
ou
rnal
P
a
per
s
,
n =
2
4
46
Table 1 – Example of relevant works using an inter-related subsystem environment simulation approach
SOURCE SPlan BAP QCA QCSP YM HTOp
YC-Sch HOp WPlan
(ITMI; MOREL; PECUCHET, 1995) X X X
(NEVINS; MACAL; JOINES, 1998) X X X
(MERKURYEV et al., 1998) X X X
(GAMBARDELLA; RIZZOLI ; ZAFFALON,
1998) X X
(DUINKERKEN; EVERS; OTTJES, 2001) X X X
(REBOLLO, JULIAN, et al., 2001) X X X X
(SHABAYEK; YEUNG, 2002) X X
(HARTMANN, 2004) X X
(ROSA; SCHNEEBELI, 2005) X X X
(BIELLI; BOULMAKOUL; RIDA, 2006) X X X
(OTTJES et al., 2006) X X
(SU e BO, 2006) X X
(HENESEY, DAVIDSSON e PERSSON,
2006) X X X X
(PETERING, 2007) X X
(LEGATO et al., 2008) X X X
(HENESEY, L., DAVIDSSON e
PERSSON, 2008) X X X X
(YUN e CHOI, 2009) X X X
(GUO et al., 2009) X X X X
(GUDELJ; KRčUM; TWRDY, 2010) X X X X
(HUYNH; VIDAL, 2010) X X X
(LI; LI, 2010) X X X X
(GARRO e RUSSO, 2010) X X X X
(MUSTAFEE e BISCHOFF, 2011) X X X
(WINIKOFF, WAGNER, et al., 2011) X X X
(BOER; SAANEN, 2012) X X X
(CARTENI; DE LUCA, 2012) X X X X
47 From this overview, it is possible to identify an increasing number from 2006 on (although not representative if compared to the number of OR-based CT published researches) of models that employ a holistic engaging approach, aiming to accomplish an integrated system performance enhancement. Hypothesis is that the research field is slowly moving towards ‘integrated approach’ direction boosted by a number of factors:
the new and compelling demands in CT management (discussed in section 2.3);
the maturity level in research accomplishment regarding single-subsystem simulation/optimization problem, as exposed in the work of Vacca; Salani; Bierlaire (2010);
the new possibilities in methodology application in simulation, boosted by either computational power improvement or by related research fields methodological approaches re-assessment and incorporation (BRITO; BOTTER, 2015);
Thus, the proposed rationale at this point is:
research suggests that is hard to improve CT management with ‘isolated single sub-system models’, requiring the development of ‘integrated approaches’ able to connect and simultaneously evaluate a cluster of CT management problems, or at least the sub-systems interfaces.
simulation is the only OR methodology able to deliver the possibility of an integrative approach, once it is the only methodology able to deal with the humongous number of CT elements, the complexity of equipment/resource utilization process and interactions, and the stochastic behavior of equipment/resources;
48 The fact is that the traditional simulation methodologies, despite its potential, is also under relevant representation potential shortcuts due its centralized process-centric decision-making structure process: once representing systems operation through straightforward process logic, it lacks flexibility in introducing local sub-systems decision processes and interactions, as well as sub-systems interdependencies relationships that may be absolutely relevant.
As an example, the CT yard allocation logic (i.e. how to rationally allocate containers in a limited available space) is one of the most complicated problems in CTs: it is interconnected to all the resources in terminal operations, including quay cranes, yard cranes, storage area, horizontal transportation resources, etc., and has direct impact in the CT overall performance. In most CT simulation models it is greatly simplified (even omitted), due its complex elements and sub-system procedures and interaction representativeness: the process of positioning a specific container in a specific slot is dependent of the characteristic of the container(s) that might be positioned right under or over the current handled container, the expected container departure time, the contract that the terminal has with the container owner, and many others. Considering all those possible decision-making elements (or even only the most representative) will certainly be a development hassle using traditional process-centric simulation approach.
Thus, forefront research indicates that the current integrative approach trend is seriously dependent on the possibility of employing decentralized decision-making methodologies (HENESEY, 2006) (STAHLBOCK; VOß, 2008) (VACCA; SALANI; BIERLAIRE, 2010) (MES; VAN DER HEIJEN; VAN HARTEN, 2007) (MES; VAN DER HEIJDEN; VAN HILLEGERSBERG, 2008) (WINIKOFF et al., 2011). Because independencies between
sub-systems need to deal with higher levels of elements and sub-systems iteration, the proposed representation methodology should be able to solve issues locally (demanding less information exchange with central control methods) while able to represent local interactions, characteristics and roles, and consequently respond quickly to randomness and unexpected events.