* Corresponding author.
E-mail addresses: [email protected] (A. Atafar)
© 2013 Growing Science Ltd. All rights reserved. doi: 10.5267/j.dsl.2013.06.004
Contents lists available at GrowingScience
Decision Science Letters
homepage: www.GrowingScience.com/dsl
Evaluation of university performance using BSC and ANP
Ali Atafara*, Mohsen Ameri Shahrabib and Mohammad Javad Esfahanic
a
Department of Management, University of Isfahan, Isfahan, Iran
b
Department of English and Management, Islamic Azad University, Naragh Branch, Naragh, Iran
c
Department of Industrial Engineering, Islamic Azad University, Naragh Branch, Naragh, Iran C H R O N I C L E A B S T R A C T
Article history:
Received October 2, 2012 Accepted June 3, 2013 Available online June 16 2013
Measuring the relative performance of universities play important role on better educational planning. During the past few years, balanced scorecard (BSC) has become popular among researchers as a technique for measuring the performance of business units. This method studies a particular firm in terms of four different perspectives including internal processes, learning and growth, customer and financial figures. One primary concern on using such method is that this method does not consider the relative importance of these components. In this paper, we present a hybrid of BSC with analytical network process to measure the relative performance of an educational unit in Iran.
© 2013 Growing Science Ltd. All rights reserved.
Keywords: Balanced Score Card BSC
ANP
1. Introduction
According to Khosroabadi et al. (2012), one of the most popular techniques to increase the performance of educational services such as public or private universities is to make performance measurement. This could be accomplished using the people who work for these organizations since they are the best people to judge about the performance of a workplace and they know most existing weakness points in their workplace. Khosroabadi et al. (2012) looked into a university performance in three inside, process and outside’s perspectives. They designed and distributed a questionnaire among 69 university professors and 295 students and asked them how they evaluated university in terms of different criteria such as educational and research facilities, etc. The results of their survey indicated that the university was not in good condition in terms of research activities but it had maintained good condition in terms of other perspectives such as educational, infrastructure, etc.
Shojaee et al. (2012) presented a study to setup appropriate strategies using the implementation of BSC in four perspectives of customers, processes, learning and financial. They gathered important factors through three various brainstorming sessions and prioritized them using TOPSIS method. Based on the results of MCDM technique, selecting appropriate target market for penetration was the number one priority followed by having good accounting system and preparing for more diversified production. Alvandi et al. (2012) provided some key performance indicators through literature reviews and experts’ idea in SAPCO, which is one of the biggest vehicle spare suppliers in Iran. The proposed study uses decision making trial and evaluation laboratory (DEMATEL) and analytic network process (ANP) developed by Saaty (2004), respectively to measure the casual relationship between the perspectives as well as the relative weights. The results based on ANP method indicated that ‘‘Customer’’ was the most influential factor. In addition, internal process, financial and learning and growth were in two to four positions. The proposed model of this paper uses the similar approach used by Avandi et al (2012) to measure the relative performance of an educational unit.
2. The proposed model
The proposed model of this paper uses ANP and BSC and therefore, we briefly describe these two methods in this paper.
2.1. BSC method
BSC approach is a popular strategic planning system used in business and industry and it is actually a management system, which helps organizations clearly define their objectives and strategies (Olson & Slater, 2002). Kaplan and Norton (1992) are believed to be the first who introduced the concept of BSC. The primary objective of BSC is to replace and to change the traditional performance evaluation model, which solely concentrated on financial indexes to obtain more complete and efficient evaluation of organizational performance.
1. Financial aspect: This perspective considers how organizations benefit from their strategic activities.
2. Customer aspect: This perspective concentrates on the issue that organizations should benefit of their inherent and available resources for the distinction among their competitors.
3. Internal business process aspect: All the strategic activities within an organization performed for satisfying stockholder and customer’s expectations are considered in this part. General process is started by perception of customer’s requirements and the operational and sale processes are executed after that.
and Norton “organizations have to emphasize on some principals such as promotion of employee’s capabilities and abilities, information system performance, persuasion and etc.”.
2.2. ANP method
The BSC is an MCDM problem since it involves various criteria and there are literally various MCDM techniques for ranking various alternatives. However, many MCDM methods do not deal with the interdependences among elements and to handle such problem, the analytical network process (ANP) as a new MCDM method was proposed by Saaty (1996). Saaty (1999) has demonstrated different types of ANP models, such as the Hamburger Model, the Car Purchase BCR model, and the National Missile Defense model. However, from the viewpoint of Kinosita (2003), the ANP can be differentiated into two practical types of techniques: the Feedback System model and the Series System model. According to the Feedback System model, clusters link one by one in turn as a network system. This type of model can capture effectively the complex impacts of interplay in human society, especially when risk and uncertainty are involved (Saaty, 2004). However, it is usually difficult to obviate the possibility of interactions within the criteria cluster. Therefore, the proposed model of this paper suggests a modified Feedback System model (Fig. 1) that allows inner dependences within the criteria cluster, in which the looped are signifies the inner dependences.
Fig.1. Feedback system model
To determine the relative importance among elements, decision makers are requested to respond through a series of pair-wise comparisons. These pair-wise comparisons are based on the Saaty’s nine-point scale ranging from 1 (equal) to 9 (extreme). For evaluating the weights of elements, the AHP uses the principal eigenvector of comparison matrix, whereas the ANP employs the limiting process method of the powers of the super-matrix (Sekitani & Takahashi, 2001).
3. The case study
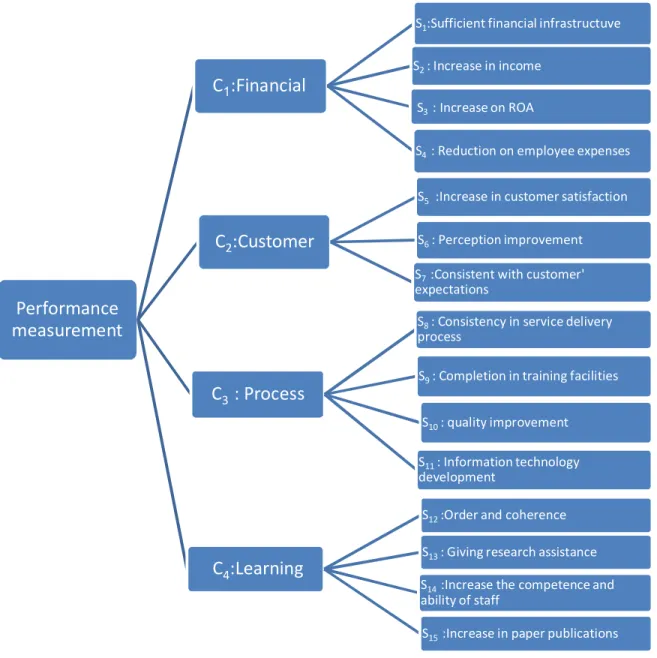
As we explained earlier, the proposed study of this paper has been implemented in one of Islamic Azad Universities in Iran. Fig. 2 demonstrates details of criteria used for this study. As we can observe from the this figure, the BSC structure consists of four perspectives of financial (C1),
customer (C2), process (C3) and learning and growth (C4). The first perspective, financial, includes
four sub-criteria including sufficient financial infrastructure, increase in income, increase in return on assets (ROA) and reduction on employee expenses. The second perspective, customer, includes three perspectives including increase in customer satisfaction, perception improvement and consistent with customer's expectations. The third item, process, incorporates four sub-criteria including consistency in service delivery process, completion in training facilities, quality improvement and information technology development. Finally, the last perspective, learning and growth, consists of four elements, which are order and coherence, giving research assistance, increase the competence and ability of staff and increase in research paper publications. The next step is to prepare Wij with i=2,3 and
j=1,2,3 associated with the implementation of ANP. In order to do this part, we ask decision
Fig. 2. The proposed framework of the study
Table 1
The summary of W23 matrix and W21 vector
) (W32 (W21)
C4 C3
C2
C1
0 0
0
0.239
S1
0.279 C1
S2 0.295 0 0 0
0 0
0
0.243
S3
0 0
0
0.223
S4
0 0
0.436
0
S5
0.262
C2
S6 0 0.298 0 0
0 0
0.266
0
S7
0 0.224
0
0
S8
0.243 C3
S9 0 0 0.235 0
0 0.303
0
0
S10
0 0.238
0
0
S11
0.241 0
0
0
S12
0.216 C4
S13 0 0 0 0.227
0.262 0
0
0
S14
0.270 0
0
0
S15
Performance
measurement
:Financial
1
C
S1:Sufficient financial infrastructuve
S2 : Increase in income
S3 : Increase on ROA
S4 : Reduction on employee expenses
C
2:Customer
S5 :Increase in customer satisfaction
S6 : Perception improvement
S7 :Consistent with customer'
expectations
: Process
C
3S8 : Consistency in service delivery
process
S9 : Completion in training facilities
S10 : quality improvement
S11 : Information technology
development
C
4:Learning
S14 :Increase the competence and
ability of staff
S12 :Order and coherence
S13 : Giving research assistance
Table 2
Internal relationship between four BSC perspectives
Criteria Financial (C1) Customer (C2) Process (C3) Learning and growth (C4)
Financial (C1) √ √ √
Customer (C2) √ √ √
Process (C3) √ √ √
Learning and growth (C4) √ √ √
Table 3
Internal relationship between sub-criteria associated with four main BSC perspectives
S15 S14 S13 S12 S11 S10 S9 S8 S7 S6 S5 S4 S3 S2 S1 √ √ √ √ √ √ √ √ √ S1 √ √ √ √ √ √ √ √ S2 √ √ √ √ √ √ √ √ √ S3 √ √ √ √ √ √ √ √ S4 √ √ √ √ √ √ √ S5 √ √ √ √ √ √ √ S6 √ √ √ √ √ √ √ S7 √ √ √ √ √ √ √ √ S8 √ √ √ √ √ √ √ √ S9 √ √ √ √ √ √ √ √ √ S10 √ √ √ √ √ √ √ √ √ S11 √ √ √ √ √ √ √ √ √ S12 √ √ √ √ √ √ √ √ S13 √ √ √ √ √ √ √ √ √ S14 √ √ √ √ √ √ √ √ √ S15
The relative weight for the main criteria are calculated and summarized in Table 4 as follows,
Table 4
The summary of relative weights for different criteria
Criteria Financial (C1) Customer (C2) Process (C3) Learning and growth (C4)
Financial (C1) 0.423 0.303 0.279
Customer (C2) 0.428 0.345 0.429
Process (C3) 0.275 0.285 0.292
Learning and growth (C4) 0.297 0.292 0.352
Similarly, we have computed the relative weights of all sub-criteria and the results are summarized in Table 5 as follows,
Table 5
The summary of relative weights for sub-criteria
S15 S14 S13 S12 S11 S10 S9 S8 S7 S6 S5 S4 S3 S2 S1 0.123 0.131 0.097 0.116 0.124 0.134 0.145 0.126 0.106 S1 0.101 0.128 0.115 0.109 0.141 0.144 0.153 0.114 S2 0.123 0.132 0.106 0.128 0.139 0.159 0.146 0.135 0.125 S3 0.095 0.113 0.123 0.134 0.12 0.157 0.121 0.103 S4 0.089 0.115 0.112 0.133 0.13 0.101 0.121 S5 0.116 0.124 0.122 0.101 0.139 0.148 0.124 S6 0.102 0.102 0.125 0.153 0.161 0.115 0.136 S7 0.128 0.111 0.116 0.131 0.148 0.144 0.103 0.128 S8 0.112 0.105 0.102 0.102 0.107 0.122 0.117 0.119 S9 0.132 0.122 0.112 0.103 0.118 0.112 0.145 0.143 0.095 S10 0.105 0.11 0.111 0.14 0.129 0.151 0.096 0.1 0.099 S11 0.099 0.126 0.099 0.123 0.118 0.139 0.136 0.1 0.085 S12 0.104 0.109 0.098 0.148 0.158 0.103 0.134 0.105 S13 0.125 0.132 0.114 0.12 0.104 0.135 0.141 0.126 0.112 S14 0.107 0.136 0.109 0.108 0.092 0.136 0.11 0.145 0.111 S15
2 2
3 3
4
. .
.
. .
Goal I cariteria W W
W W sub cariteria
W I Alternetive
and provide the final ranking based on ANP process. Table 6 shows details of the results of the restricted super matrix associated with four alternatives.
Table 6
The summary of restricted super matrix associated with four alternatives
S15
S14
S13
S12
S11
S10
S9
S8
S7
S6
S5
S4
S3
S2
S1
C4 C3 C2 C1 G
0.31 0.35
0.27 0.21
0.29 0.22 0.28
0.25 0.28 0.26
0. 23
0.29 0.37 0.3 0
0.27
0.27 0.26 0.27 0.27 0.27
A1
0.28 0.24
0.33 0.19
0.21 0.32
0.24
0.24 0.29
0.30 0.32
0.32 0.13 0.19
0.3
0.31 0.32 0.32 0.31 0.32
A2
0.23 0.26
0.21
0.26
0.29 0.25 0.22 0.21 0.26
0.22
0.26
0. 28
0.21
0.35
0.22
0.21 0.19 0.20 0.20 0.20
A3
0.18 0.15
0.19
0.34 0.21 0.21 0.26 0.30
0.17 0.23 0.19
0.11
0.3
0.15
0.19
0.21 0.21 0.22 0.21 0.21
A4
As we can observe from the results of Table 6, the second alternative (A2) has received the
highest priority, 0.32, followed by the first alternative (A1), 0.27, the fourth (A4), 0.21 and the
third one, (A3) with the relative weight of 0.20. In addition, we have computed the relative
weights of all criteria and they are summarized in Table 7 as follows,
Table 7
The summary of weights associated with different criteria
) 0.265 (
Financial Customer(0.375) Process(0.145) Learning and growth(0.215)
S1 0.012 S5 0.185 S8 0.054 S12 0.018
S2 0.203 S9 0.003 S13 0.055
S6 0.035
S3 0.014 S10 0.111 S14 0.023
S7 0.068
S4 0.085 S11 0.009 S15 0.125
According to the results of Table 7, customer plays the most important role followed by financial, learning and growth and process.
4. Conclusion
In this paper, we have presented a multiple criteria decision making method for strategic planning of some Islamic Azad University branches. The proposed study of this paper has implemented balance scorecard along with analytical hierarchy process to investigate the university in terms of four different perspectives. We have also used analytical hierarchy process to rank various components of each perspective. Based on the results of this survey, we can conclude that customer has been the most important component of this university followed by financial, learning and growth and process.
References
Alvandi, M., Fazli, S., Yazdani, L & Aghaee, M. (2012). An integrated MCDM method in ranking BSC perspectives and key performance indicators (KPIs). Management Science Letters, 2(3), 995-1004.
Kaplan, R. S., & Norton, D. (1992). The balanced scorecard measures that drive performance. Harvard Business Review, 70(1), 71–79.
Kaplan, R.S., & Norton, D. (1996a). Using the balanced scorecard as a strategic management system. Harvard Business Review, 74(1), 75-85.
Kaplan, R.S., & Norton, D.P. (1996b). The Balanced Scorecard: Translating Strategy into Action. Harvard Business School Press.
Kaplan, R.S., & Norton, D.P. (2004). Strategy maps: Converting intangible assets into tangible outcomes. Boston, MD: Harvard Business Press.
Khosroabadi, S., Monfaredi raz, B., & Bahramzadeh, H. (2012). A survey for assessing university performance. Management Science Letters, 2(8), 3061-3066.
Kinosita. E. (2003). From AHP to ANP. Operations Research of Japan, 48(9), 677–683.
Mozaffari, A., Karkehabadi, H., Kheyrkhahan, M & Karami, M. (2012). A development in balanced scorecard by designing a fuzzy and nonlinear Algorithm (case study: Islamic Azad university of Semnan). Management Science Letters, 2(5), 1819-1838.
Olson, E.M., & Slater, S.F. (2002). The balanced scorecard, competitive strategy, and performance.
Business Horizons, 45, 11–16.
Saaty, T. L. (1996). The analytic network process-decision making with dependence and feedback. Pittsburgh, PA: RWS Publications.
Saaty, T. L. (2004). Decision making—the analytic hierarchy and network processes (AHP/ANP). Journal of systems science and systems engineering, 13(1), 1-35.
Sekitani, K., & Takahashi, I. (2001). A unified model and analysis for AHP and ANP. Journal of the
Operations Research Society of Japan, 44(1), 67–89.
Shojaee, M., Fallah, M & Fallah, M. (2012). A hybrid TOPSIS-BSC method for strategic planning.