* Corresponding author. Tel: +982188872548 E-mail addresses: [email protected] (M. Aghaee) © 2012 Growing Science Ltd. All rights reserved. doi: 10.5267/j.msl.2012.01.024
Contents lists available at GrowingScience
Management Science Letters
homepage: www.GrowingScience.com/msl
An Integrated MCDM Method in Ranking BSC Perspectives and key Performance Indicators (KPIs)
Mohsen Alvandia, Safar Fazlia, Leila Yazdaniaand Milad Aghaeeb*
a
Faculty of Social Science, Department of Industrial Management, Imam Khomeini University, Qazvin, Iran b
Faculty of Logistics and Administrative Science, Logistics Department, Police University, Tehran, Iran
A R T I C L E I N F O A B S T R A C T
Article history:
Received September 10, 2011 Received in Revised form October, 30, 2011 Accepted 10 January 2012 Available online 23 January 2012
The balanced scorecard (BSC) approach is an effective technique for performance evaluation. BSC can better reflect the dependence and feedback problems of each factor in real world situations. This study aims at developing a set of appropriate key performance indicators according to (BSC) approach for SAPCO using multiple criteria decision making(MCDM) method. We provide key performance indicators through literature reviews and experts' idea in SAPCO, which is one of the biggest vehicle spare suppliers in Iran. The proposed study uses decision making trial and evaluation laboratory (DEMATEL) and analytic network process (ANP), respectively to measure the casual relationship between the perspectives as well as the relative weights. The results based on ANP method shows that ‘‘Customer’’ is the most influential factor. In addition, internal process, financial and learning and growth are in two to four positions. Three important key performance indicators are as bellow: Total price of parts, Customer satisfaction and Lack of parts in production.
© 2012 Growing Science Ltd. All rights reserved.
Keywords:
Balanced Scorecard Perspectives Key Performance Indicator (KPI) Decision Making Trial and Evaluation Laboratory (DEMATEL)
Analytic Network Process (ANP)
1. Introduction
evaluation into key performance indicators. Key performance indicators are correlated items, which are measurable and translate mission statements to clarified objectives (Oakland, 1999).
SAPCO Company is one of the biggest suppliers in the field of spare supplying in Iran. The main mission of SAPCO is to supply the needed raw materials of vehicle industry, especially for Iran Khodro Company in Iran. During the last few years, SAPCO has put tremendous efforts to prepare its strategies and key performance indicators. The most important problem is now to prioritize the factors. Ranking is a kind of multi criteria decision making (MCDM) problem with different criteria and objectives.
Many conventional MCDM techniques are based on the additive idea along with the independence assumption, but each individual criterion is not often independent (Leung et al., 2003).To solve the interactions among elements, the analytic network process (ANP) as a relatively new MCDM method was introduced by Saaty (1996). The ANP is a mathematical theory, which deals with all kinds of dependence systematically (Saaty, 2004). The ANP has already been successfully implemented in many areas (Agarwal & Shankar, 2002; Chung et al., 2005; Coulter & Sarkis, 2005; Kahraman et al., 2006; Karsak et al., 2003; Lee & Kim, 2001; Meade & Presley, 2002; Niemira & Saaty, 2004; Partovi, 2001; Partovi & Corredoira, 2002; Partovi, 2006; Shang et al., 2004; Tesfamariam & Lindberg, 2005; Yurdakul, 2004). However, the treatments of inner dependences in those ANP works may suffer from some issues, which motivate us to use Decision Making Trial and Evaluation Laboratory (DEMATEL) method (Gabus & Fontela, 1972, 1973; Fontela & Gabus, 1976; Hori & Shimizu, 1999).
MCDM techniques such as AHP, ANP, DEMATEL, etc. have been extensively utilized in the performance evaluation and other fields for many years such as high-tech selection problem (Erdogmus et al., 2005), airline safety measurement using a hybrid model (Liou et al., 2007), marketing strategy based on customer behavior for the LCD-TV (Chiu et al., 2006), corporate social responsibility programs choice and costs assessment in the airline industry (Tsai & Hsu, 2008). Tsai
and Chou (2009) proposed a novel hybrid MCDM model based on the BSC perspectives for selecting
optimal management systems. Performance evaluation can be performed using the cause and effect relationships among various items using DEMATEL. Followed by this, ANP is utilized to get the relative weight of each performance index to establish performance indicators and evaluation model, which helps the performance audition of SAPCO reach the expectation of industry corporations.
The rest of this paper is organized as follow: In Section 2, a literature review is presented, In Section 3, evaluation methods are presented. In Section 4, the findings are illustrated. Finally, according to the findings of this research, conclusions and suggestions are depicted.
2. Literature review
This section discusses the strategic model of strategic planning balanced scored card.
2.1. Balance Scored Card (BSC) Concept
M. Alvandi et al. / Management Science Letters 2 (2012)
997
considered as the most important aspect of organizational performance evaluation in BSC. However, other aspects of traditional model should also be considered, aspects such as customer, internal business processes and employee’s growth and learning, so that performance evaluation model can achieve more balance and efficiency compared with past performance. The concept and meaning of the four aspects are as following:
1. Financial aspect: This aspect considers how organizations benefit from their strategic activities.
2. Customer aspect: This aspect pays attention to the issue that organizations should benefit of their
inherent and available resources for the distinction among their competitors.
3. Internal business process aspect: All the strategic activities in an organization performed for
satisfying stockholder and customer’s expectations are investigated in this aspect. General process is started by perception of customer’s needs and the operational and sale processes are performed after that.
4. Growth and learning aspect: if organizations want to maintain permanent activity and
development, they should always rely on constant growth and innovation. Kaplan and Norton have expressed their opinions in this way: "organizations have to emphasize on some principals such as promotion of employee’s capabilities and abilities, information system performance, persuasion and etc.". Performance indexes must be unbiased and measurable based on organizational objectives. Index selection plays an important role for investigation of required industry performance, since we can enhance efficiency of manufacturing operations and create a lot of advantages for company by accurate investigation of these indexes. Performance key indexes should be investigated for achievement of strategic objectives in every four aspects of BSC (Wu et al., 2007).
Kaplan and Norton believed BSC includes affecting and influenced relationships among different indexes in selected aspects. Other different researchers similarly expressed experimental evidences in support of causal relationship among different aspects of BSC (Schmidberger et al., 2009).
These relationships point to the dependence among financial and non-financial indexes. A structured BSC method should include mutual relations among various aspects and measuring indexes of these aspects (Wang et al., 2010).
2.2. Key Performance Indicators (KPI)
KPIs represent a set of measures focusing on those aspects of organizational performance, which are critical for the current and future success of the organization. KPIs are rarely new to the organization. They either have not been recognized or were “gathering dust” somewhere unknown to the current management team. From extensive analysis and from discussions with over 1,500 participants in KPI workshops, covering most organization types in the public and private sectors, I define seven KPI characteristics:
1. Nonfinancial measures (not expressed in Dollars, Yen, Pounds, Euros, etc.)
2. Measured frequently (e.g., daily or 24/7)
3. Acted on by the CEO and senior management team
4. Understanding of the measure and the corrective action required by all staff
5. Ties responsibility to the individual or team
6. Significant impact (e.g., affects most of the core critical success factors [CSFs] and more than one
BSC perspective)
In this section, some essentials of the ANP and the DEMATEL are briefly explained.
3.1. The ANP
The balance scored card and KPI ranking is an MCDM problem since it involves various criteria. There are several MCDM methods developed, such as the elimination and choice translating reality (ELECTRE), the technique for order preference by similarity to ideal solution (TOPSIS), and the analytic hierarchy process (AHP). However, these methods do not deal with the interdependences among elements. For dealing with the interdependences among elements, the ANP as a new MCDM method was proposed by Saaty (1996). Saaty (1999) has demonstrated several kinds of ANP models, such as the Hamburger Model, the Car Purchase BCR model, and the National Missile Defense model. However, from the viewpoint of Kinosita (2003), the ANP may simply be differentiated into two practical kinds of models: the Feedback System model and the Series System model (similar to the AHP model). In the Feedback System model, clusters link one by one in turn as a network system. This kind of model can capture effectively the complex effects of interplay in human society, especially when risk and uncertainty are involved (Saaty, 2003). However, it is usually hard to obviate the possibility of interactions within the criteria cluster. Thus, this paper suggests a modified Feedback System model (Fig. 1) that allows inner dependences within the criteria cluster, in which the looped are signifies the inner dependences.
Fig.1. Feedback system model
In order to determine the relative importance between elements, decision makers are asked to respond through a series of pair-wise comparisons. These pair-wise comparisons are based on the Saaty’s nine-point scale ranging from 1 (equal) to 9 (extreme). For evaluating the weights of elements, the AHP uses the principal eigenvector of comparison matrix, whereas the ANP employs the limiting process method of the powers of the super-matrix (Sekitani & Takahashi, 2001). For synthesizing overall priorities for the alternatives, it requires adjusting the un-weighted super-matrix to keep it to be column stochastic (Sarkis, 1999). Then, the weighted super-matrix (the adjusted un-weighted super-matrix) can be raised to limit powers to calculate the overall priorities. However, before forming the un-weighted super-matrix, the treatment of inner dependences needs to employ the DEMATEL. The treatment of inner dependences can theoretically use the ANP, but another alternative is to use the DEMATEL.
3.2. The DEMATEL
M. Alvandi et al. / Management Science Letters 2 (2012)
999
smoothly, this paper refines the version used by Fontela and Gabus (1976) and proposes four main steps as below.
Step 1: Generating the direct-relation matrix by measuring the relationship between criteria in four levels: 0 (no influence), 1 (very low influence), 2 (low influence), 3 (very high influence) and 4 (very high influence). Next, experts make sets of the pair-wise comparisons in terms of influence and direction between criteria. Then, as the result of these evaluations, the initial information can be
prepared as the direct-relation matrix, which is an n×n matrix A, in which aij is denoted as the degree
to which the criterion i affects the criterion j.
Step 2: Normalizing the direct-relation matrix. On the base of the direct-relation matrix A, the normalized direct-relation matrix X can be obtained as follows,
.
X=k A (1)
1 1
1
, , 1, , .
max
n
ij j
i n
k i j n
a
= ≤ ≤
= =
∑
" (2)Step 3: Attaining the total-relation matrix. Once the normalized direct-relation matrix X is obtained,
the total relation matrix T is calculated as follows,
1
( ) ,
T=X I−X − (3)
Where I is identity matrix.
Step 5: Set a threshold value and obtain the network relationship map (NRM). In order to explain the structural relation among the criteria and keep the complexity of the system to a manageable level at the same time, it is necessary to set a threshold value p to filter out some negligible effects in matrix T. Only some criteria, whose effect in matrix T is greater than the threshold value, should be chosen and shown in a network relationship map (NRM) for influence (Tzeng et al., 2007).In this paper,
experts decided the threshold value is arithmetic mean of T matrix numbers.
4. Empirical study and discussion
In accordance with the proposed performance evaluation model, this study conducts an empirical analysis gathering the feedbacks of 10 experts from SAPCO. On the basis of the collected professional questionnaires containing performance indices of SAPCO, the performance indices under each BSC perspective based on a Likert scale from one to ten are preserved. Twenty indices are selected from 40 evaluation indices of 4 perspectives. Because these relevant evaluation indices (i.e., KPIs) are summarized on the basis of associated work and consulted by experienced experts, it can have relatively high content validity and face validity Table 1 shows details of our indices.
4.1. Establishment of total influence of BSC perspective
Criteria with a mean of 7.5 and above
Financial (F) Customer (C)
Internal process(P) Learning and growth(L)
Total sale(F1) The rate of satisfied
customers(C1) The rate of multi-source spares
to total spares(P1) The average of leaders
competencies(L1)
Total sale to ISACO(F2) Total price of SAMAND
LC spares(C2) The rate of elimination from
package(P2) The percentage of significant
electronic exchange of information with Supply chain(L2)
Dollar volume of direct export(F3) RANA X12 total spare
price(C3) The percentage of Suppliers
satisfaction(P3) The rate of employee
perception from organization(L3)
Surplus total sale(F4) The return from production
line of Iran Khodro (PPM) (C4)
Average R&D ability of supply chain in SAPCO(P4)
The rate of changing in vehicle spare price(F5) The return from after sale
services(C5) The average of on-time payment
to manufacturer (P5)
The rate of production with shortage(C6)
Total price of motor spares(C7)
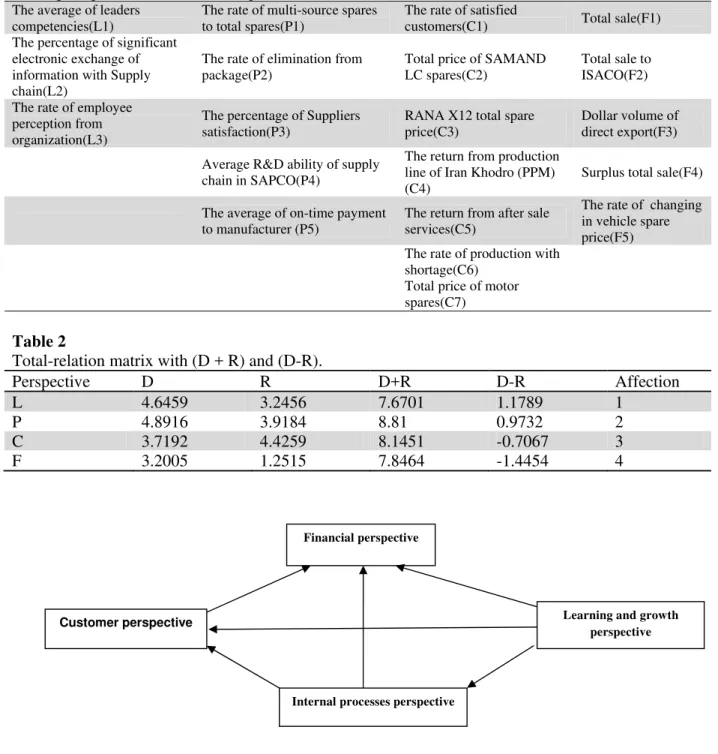
Table 2
Total-relation matrix with (D + R) and (D-R).
Perspective D R D+R D-R Affection
L 4.6459 3.2456 7.6701 1.1789 1
P 4.8916 3.9184 8.81 0.9732 2
C 3.7192 4.4259 8.1451 -0.7067 3
F 3.2005 1.2515 7.8464 -1.4454 4
Fig. 2. Casual evaluation structure for SAPCO
D+ R represents the important degree of factors, which means the sum of influence and being influenced degrees. As a result, it could be seen that ‘‘Internal process perspective (P)’’ is more important than the other three perspectives. As for the value of (D-R), the bigger the positive number is, the more effect the factor has on the other factors. It is prone to the factor of cause (cause factor). On the contrary, the bigger the negative number is, the more the factor is influenced by other factors.
It is inclined to the factor of effect (effect-factor). Therefore, it is shown in Table 2 that ‘‘Internal
process perspective (P)’’ is a central influential perspective; ‘‘Learning and growth perspective (L)’’ is the important cause-factor of affecting other perspectives; ‘‘Financial perspective (F)’’ is an
effect-Customer perspective
Financial perspective
Internal processes perspective
M. Alvandi et al. / Management Science Letters 2 (2012)
1001
factor since it is affected the most by other perspectives. This process for key performance indicators is summarized in Table 3.
Table 3
Total-relation matrix with (D + R) and (D-R) for Financial perspective
Financial R D D+R D-R Affection
F1 1.4413 1.6616 3.1029 -0.2203 4
F2 1.5418 1.0217 2.5635 0.5201 2
F3 1.1502 0.8862 2.0364 0.264 3
F4 0.9083 2.1611 3.0694 -1.2528 5
F5 1.4024 0.7134 2.1158 0.689 1
Fig.3.The causal diagram of BSC perspectives for SAPCO
Table 4
Total-relation matrix with (D+ R) and (D-R) for Customer perspective
Customer R D D+ R D- R Affection
C1 0.3462 1.1441 1.4903 -0.7979 7
C2 0.4652 0.3574 0.8226 0.1078 4
C3 0.2463 0.3103 0.5566 -0.064 6
C4 0.655 0.2889 0.9439 0.3661 1
C5 0.5043 0.3606 0.8649 0.1437 3
C6 0.3719 0.3852 0.7571 -0.0133 5
C7 0.5488 0.2912 0.84 0.2576 2
Fig.4.The causal diagram of Customer perspective for SAPCO
Fig.5.The causal diagram of Process perspective for SAPCO
Total-relation matrix with (D+ R) and (D-R) for Process perspective
Process R D D+ R D- R Affection
P1 1.6669 2.235 3.9019 -0.5681 3
P2 1.8131 2.4063 4.2194 -0.5932 4
P3 1.7539 2.426 4.1799 -0.6721 5
P4 1.9775 1.7395 3.717 0.238 2
P5 2.373 0.7785 3.1524 1.5954 1
Table 6
Total-relation matrix with (D+ R) and (D-R) for Learning and growth perspective
Learning and Growth R D D+ R D- R Affection
L1 4.3606 4.8572 9.2178 -0.4966 2
L2 3.1488 3.6883 6.8371 -0.5395 3
L3 4.9728 3.9367 8.9095 1.0361 1
Table 7
Finalrelative weights of key performance indicators
Rank Limited
Supermatrix Normalized
Weight Perspectives and Key performance indicator
4 0.0686
0.12407 Learning and growth(L)
8 0.02701
0.04885 L1: Employee perception from organization
15 0.02102
0.03801 L2: The percent of significant information exchange with supply chain
16 0.02057
0.03720 L3: The average level of leaders competencies
2 0.11807 0.21354 Internal process(P) 10 0.02406 0.04351 P1: The rate of multi-source spares to total spares
4 0.03210
0.05805 P2: The rate of elimination from surplus package
7 0.02850
0.05154 P3: The percentage of satisfied customers
19 0.01083
0.01958 P4: R&D competency in SAPCO
13 0.022258
0.04084 P5: The average days for manufacturers payment
1 0.2559 0.46282 Customer(C) 2 0.03660 0.06619 C1: The percentage of customers satisfaction
1 0.08276
0.1495 C2: Total price of SAMAND LX
12 0.02259
0.04085 C3: Total price of RANA X12 spare
9 0.02451
0.04433 C4: Return from Iran Khodro production line(PPM)
6 0.02861
0.05174 C5: Return from after sale services(PPM)
3 0.03214
0.05813 C6: Production with shortages rate
5 0.02869
0.05188 C7:Total price of motor spares
3 0.1134 0.19956 Financial(F) 11 0.2335 0.04223 F1: Rial volume of sale
9 0.2692
0.04868 F2:Rial volume of sale to ISACO
18 0.1849
0.03344 F3:The volume of SAPCO disrect export
14 0.2172
0.03928 F4: The rate of total sale
17 0.1989
0.03597 F5: The savings from special suggestions
M. Alvandi et al. / Management Science Letters 2 (2012)
1003
5. Conclusion
In this paper, we have developed a set of appropriate key performance indicators according to (BSC) approach for SAPCO using multiple criteria decision making (MCDM) method. We provided key performance indicators through literature reviews and experts' idea in SAPCO, which is one of the biggest vehicle spare suppliers in Iran. The proposed study implemented decision making trial and evaluation laboratory (DEMATEL) and analytic network process (ANP), respectively to measure the casual relationship between the perspectives as well as the relative weights. The results based on ANP method showed that ‘‘Customer’’ was the most influential factor. In addition, internal process, financial and learning and growth were in two to four positions. Three important key performance indicators are also as bellow: Total price of parts, Customer satisfaction and Lack of parts in production.
References
Abran. A., & Buglione. L. (2003). A multidimensional performance model for consolidating
Balanced Scorecards. Advances in Engineering Software, 34, 339–349.
Agarwal. A., & Shankar, R. (2002). Analyzing alternatives for improvement in supply chain
performance. Work Study, 51(1), 32–38.
Chung. S. H., Lee. A. H. I., & Pearn, W. L. (2005). Analytic network process (ANP) approach for
product mix planning in semiconductor fabricator. International Journal of Production
Economics, 96(1), 15–36.
Coulter. K, & Sarkis. J. (2005). Development of a media selection model using the analytic network
process. International Journal of Advertising, 24(2), 193–216.
Chiu, Y.J., Chen, H.C., Tzeng, G.H., & Shyu, J. Z. (2006). Marketing strategy based on customer
behavior for the LCD-TV. International Journal of Management and Decision Making 7 (2/3),
143–165.
Davis. S., & Albright. T. (2004). An investigation of the effect of Balanced Scorecard
implementation on financial performance. Management Accounting Research, 15, 135–153.
Erdogmus, S., Kapanoglu, M., & Koc, E. (2005). Evaluating high-tech alternatives by using analytic
network process with BOCR and multiactors. Evaluation and Program Planning, 28(4), 391–399.
Gabus, A., & Fontela, E. (1972). World problems and invitation to further thought within the framework of DEMATEL, Switzerland Geneva: Battelle Geneva Research Centre.
Gabus, A., & Fontela, E. (1973). Perceptions of the World problematic: Communication procedure, communicating with those bearing collective responsibility (DEMATEL Report No. 1). Switzerland Geneva: Battelle Geneva Research Centre.
Hori. S., & Shimizu, Y. (1999). Designing methods of human interface for supervisory control
systems. Control Engineering Practice, 7(11), 1413–1419.
Kahraman. C., Ertay, T., & Buyukozkan, G. (2006). A fuzzy optimization model for QFD
planningprocess using analytic network approach. European Journal of Operational Research,
171(2), 390–411.
Kaplan. R.S., & Norton. D.P (1992).The balanced scorecard – measures that drive performance,
Harvard Business Review, 70(1), 71-79.
Kaplan. R.S., & Norton. D.P (1996). The balanced scorecard: translating strategy into action.
Harvard Business School Press, Boston, MA.
Kaplan. R.S., & Norton. D.P. (2004). Strategy maps: converting intangible assets into tangible
outcomes, Harvard Business School Press, Boston, MA.
Karsak, E.E., & Tolga, E. (2001). Fuzzy multi-criteria decision making procedure for evaluating
advanced manufacturing system investments. International Journal of Production Economics, 69,
49–64.
project selection. International Journal of Project Management, 19(2), 111–118.
Leung. L. C., Hui, Y. V., & Zheng, M. (2003). Analysis of compatibility between interdependent
matrices in ANP. Journal of the Operational Research Society, 54(7), 758–768.
Meade. L. M., & Presley, A. (2002). R&D project selection using the analytic network process. IEEE
Transactions on Engineering Management, 49(1), 59–66.
Niemira, M. P., & Saaty, T. L. (2004). An analytic network process model for financial-crisis
forecasting. International Journal of Forecasting, 20(4), 573–587.
Oakland, J.S (1999). Total organizational excellence: Achieving world-class performance, Butterworth-Heinemann pub.
Olson, E.M., & Slater, S.F. (2002). The balanced scorecard, competitive strategy, and performance.
Business Horizons, 45, 11–16.
Parmenter. D (2007). Key performance indicator, John Willey incorporation.
Partovi, F. Y. (2001). An analytic model to quantify strategic service vision. International Journal of
Service Industry Management, 12(5), 476–500.
Partovi, F. Y., & Corredoira, R. A. (2002). Quality function deployment for the good of soccer.
European Journal of Operational Research, 137(3), 642–656.
Partovi, F. Y. (2006). An analytic model for locating facilities strategically. Omega, 34(1), 41–55.
Saaty, T. L. (1996). The analytic network process-decision making with dependence and feedback.
Pittsburgh, PA: RWS Publications.
Saaty, T. L. (2004). The analytic network process: Dependence and feedback in decision making (Part 1): Theory and validation examples, SESSION 4B: Theory and development of the analytic hierarchy process/analytic network process, In The 17th International Conference on Multiple Criteria Decision Making, August 6-11, 2004 at The Whistler Conference Centre, Whistler, British Columbia, Canada.
Sarkis, J. (1999). A methodological framework for evaluating environmentally conscious
manufacturing programs. Computers and Industrial Engineering, 36(4), 793–810.
Schmidberger, S., Bals, L., Hartmann, E., & Jahns, C. (2009). Ground handling services at European
hub airports: development of a performance measurement system for benchmarking. International
Journal of Production Economics, 117, 104–111.
Sekitani, K., & Takahashi, I. (2001). A unified model and analysis for AHP and ANP. Journal of the
Operations Research Society of Japan, 44(1), 67–89.
Shang, J. S., Tjader, Y., & Ding, Y. (2004). A unified framework for multi-criteria evaluation of
transportation projects. IEEE Transactions on Engineering Management, 51(3), 300–313.
Tesfamariam, D., & Lindberg, B. (2005). Aggregate analysis of manufacturing systems using system
dynamics and ANP. Computers and Industrial Engineering, 49(1), 98–117.
Tsai, W. H., & Hsu, J. L. (2008). Corporate social responsibility programs choice and costs assessment in the airline industry—A hybrid model. Journal of Air Transport.
Tsai, W.H., Chou, W.C., & Hsu, W. (2009). The sustainability balanced scorecard as a framework for
selecting socially responsible investment: an effective MCDM model. Journal of the Operational
Research Society, 60 (10), 1396–1410.
Tzeng, G.H., Chiang, C.H., & Li, C.W. (2007). Evaluating intertwined effects in e-learning programs:
a novel hybrid MCDM model based on factor analysis and DEMATEL. Expert Systems with
Applications, 32(4), 1028–1044.
Wang, C.H., Lu, I.Y., & Chen, C.B. (2010). Integrating hierarchical balanced scorecard with
nonadditive fuzzy integral for evaluating high technology firm performance. International
Journal of Production Economics, 128, 413–426.
Wu, W.W., & Lee, Y.T. (2007). Developing global managers’ competencies using the fuzzy
DEMATEL method. Expert Systems with Applications, 32 (2), 499–507.
Yurdakul, M. (2004). AHP as a strategic decision-making tool to justify machine tool selection.