Prognostic Significance of the Systemic
Inflammatory and Immune Balance in
Alcoholic Liver Disease with a Focus on
Gender-Related Differences
Beata Kasztelan-Szczerbińska1*, Agata Surdacka2, Krzysztof Celiński1, Jacek Roliński2, Agnieszka Zwolak3, Sławomir Miącz4, Mariusz Szczerbiński1
1Department of Gastroenterology with Endoscopy Unit, Medical University of Lublin, Lublin, Poland, 2Department of Clinical Immunology, Medical University of Lublin, Lublin, Poland,3Medical University of Lublin, Lublin, Poland,4Department of Gastroenterology, Provincial Specialist Hospital, Lublin, Poland
Abstract
Objectives
Mechanisms of immune regulation in alcoholic liver disease (ALD) are still unclear. The aim of our study was to determine an impact of Th17 / regulatory T (Treg) cells balance and its corresponding cytokine profile on the ALD outcome. Possible gender-related differences in the alcohol-induced inflammatory response were also assessed.
Materials and Methods
147 patients with ALD were prospectively recruited, assigned to subgroups based on their gender, severity of liver dysfunction and presence of ALD complications at admission, and followed for 90 days. Peripheral blood frequencies of Th17 and Treg cells together with IL-1beta, IL-6, IL-17A, IL-23, and TGF-beta1 levels were investigated. Flow cytometry was used to identify T cell phenotype and immunoenzymatic ELISAs for the corresponding cyto-kine concentrations assessment. Multivariable logistic regression was applied in order to select independent predictors of advanced liver dysfunction and the disease complications.
Results
IL-17A, IL-1beta, IL-6 levels were significantly increased, while TGF-beta1 decreased in ALD patients. The imbalance with significantly higher Th17 and lower Treg frequencies was observed in non-survivors. IL-6 and TGF-beta1 levels differed in relation to patient gender in ALD group. Concentrations of IL-6 were associated with the severity of liver dysfunction, development of ALD complications, and turned out to be the only independent immune pre-dictor of 90-day survival in the study cohort.
OPEN ACCESS
Citation:Kasztelan-Szczerbińska B, Surdacka A, Celiński K, Roliński J, Zwolak A, Miącz S, et al. (2015) Prognostic Significance of the Systemic Inflammatory and Immune Balance in Alcoholic Liver Disease with a Focus on Gender-Related Differences. PLoS ONE 10(6): e0128347. doi:10.1371/journal.pone.0128347
Editor:Golo Ahlenstiel, University of Sydney, AUSTRALIA
Received:February 15, 2015
Accepted:April 25, 2015
Published:June 24, 2015
Copyright:© 2015 Kasztelan-Szczerbińska et al. This is an open access article distributed under the terms of theCreative Commons Attribution License, which permits unrestricted use, distribution, and reproduction in any medium, provided the original author and source are credited.
Data Availability Statement:All relevant data are within the paper and its Supporting Information files.
Funding:This study was supported by the research grants from the Medical University of Lublin, Poland (PW445/2010-2011); BKS.
Conclusions
We conclude that IL-6 revealed the highest diagnostic and prognostic potential among stud-ied biomarkers and was related to the fatal ALD course. Gender-related differences in immune regulation might influence the susceptibility to alcohol-associated liver injury.
Introduction
Alcoholic liver disease remains a major health problem worldwide and its prevalence is increas-ing in Eastern, as well as some Western countries (eg. United Kincreas-ingdom, Ireland, Finland) [1]. Furthermore, alcohol consumption accounts for 3.8% of global mortality [2]. Consequently, ALD should remain in focus of extensive research in hepatology.
Significant progress has been made in our understanding of the role of inflammatory activa-tion and immune dysregulaactiva-tion in deterioraactiva-tion of the disease course and its outcome. Never-theless, the underlying mechanisms are still poorly understood. It is widely accepted that both acute and chronic ethanol consumption alters the immune system function [3,4,5,6]. Ethanol may impair antigen presentation by monocytes and dendritic cells, interfere with the expres-sion of adheexpres-sion molecules and decrease T cell proliferation [7]. In parallel with ALD progres-sion and increasing synthesis of pro-inflammatory cytokines/ chemokines by Kupffer cells, an immune response towards antigens derived from damaged hepatocytes and massive inflamma-tory cell recruitment into the liver may occur [8].
Accumulating evidence highlights the importance of two new subsets of CD4+T cells, Th17 and regulatory T (Treg) cells in the pathogenesis of several autoimmune and inflammatory dis-orders. We speculate that ALD might be one of them, but to date, the Th17/Treg balance has not been explored in patients with ALD yet. It is believed that Th17 and Treg cells are critically linked to inflammatory immune response [9–12]. While Th17 lymphocytes exert pro-inflam-matory effects, Treg cells are potent immune suppressors, and they may reciprocally control their function. Human Th17 differentiation is IL-1beta1, IL-6, IL-23 and IL-17A- dependent and suppressed by TGF-beta1. On the other hand TGF-beta1 enhances the differentiation of human Treg cells [13–17].
Moreover, clinical observations indicate that women develop more severe alcohol-associ-ated liver injury at lesser ethanol intake and fewer years of exposure. So far underlying mecha-nisms remain obscure. Females have a stronger inflammatory response in comparison to males [18,19]. These differences are believed to have an association with different hormone patterns (estrogens are immune stimulators, testosterone is rather immunosuppressive). Therefore, the inflammatory response in the course of ALD may differ in men and women.
Accordingly, we aimed to assess the significance of peripheral Th17/Treg balance and corre-sponding cytokine profile in the course of ALD. We hypothesized that their possible alterations (a consequence of the local and systemic inflammatory response) might affect the disease pro-gression and development of its complications. In addition, we investigated whether gender-related differences in the alcohol-induced inflammatory and immune response existed and how they might influence the disease course.
Materials and Methods
Patient characteristics
The study cohort has been described in detail in our previously published report concerning adipose tissue biomarkers [20].
Briefly, 147 unselected and consecutive adult inpatients (pts) (40 females, 107 males) with ALD were prospectively recruited over a 2-year period and followed for 90 days.
The control group consisted of 30 age- and sex-matched healthy volunteers (13 females, 17 males), who pledged abstinence or alcohol consumption as no more than 20 g ethanol per day. The diagnosis of ALD was established by combination of typical symptoms and physical find-ings of chronic liver disease, as well as laboratory results i.e. elevated aminotransferase activity (normal range: ALT<31IU/L; AST<34IU/L), the AST/ALT ratio above 2, and imaging studies in the setting of excessive alcohol intake. Other cofactors of chronic liver injury were excluded.
Alcohol abuse was confirmed by the AUDIT-C (Alcohol Use Disorders Identification Test
—Consumption) questionnaire [21]. The positive result of AUDIT-C, in addition to the amount of alcohol intake, was an inclusion criterion. The daily alcohol consumption in the study group ranged as follows: in females 40 g/d to more than 100 g/d, in males 50 g/d to more than 100 g/d.
Neither corticosteroids nor pentoxifylline were administered to any individuals at the time of enrollment.
Patients demographic data as well as all procedures were recorded and performed within 48 hours after hospital admission. Blood samples were collected at 07:30 am after a minimum 8-hour overnight fast.
The severity of liver failure at baseline was established using the Child-Turcotte-Pugh (CTP) [22] and MELD (the Model of End-Stage Liver Disease) [23] criteria. Patients were assigned into different subgroups according to their:
1. gender,
2. the severity of liver dysfunction according to the CTP (class A, B, C) and MELD (20 or<20) scores;
3. the presence of ALD complications at the time of hospital admission i.e. ascites, hepatic encephalopathy (HE), oesophageal varices, cholestasis, and renal impairment.
Subjects with severe comorbidities present at the time of enrollment i.e. malignancy, pulmo-nary insufficiency, heart failure or uncontrolled diabetes were excluded.
Symptoms of overt hepatic encephalopathy (HE) were classified according to West-Heaven criteria [24].
Abdominal ultrasonography was performed to confirm the presence of ascites and gastros-copy in order to identify esophageal varices.
The normal values for creatinine in the blood range from 0.6 to 1.3 milligrams per deciliter in our laboratory, therefore its level above 1.3 mg / dL (the upper limit of normal) was consid-ered a criterion of renal impairment.
Laboratory examinations
Analysis of basic laboratory tests included: liver function parameters, complete blood count, parameters of renal function and traditional markers of inflammation (neutrophils, neutrophil to lymphocytes count rate (NLR) and the level of C-reactive protein- CRP).
In addition, the evaluation of uncommon inflammatory indicators and immune regulators in peripheral blood was performed. We determined frequencies and the systemic balance of two new subsets of T helper cells: Th17 and regulatory T lymphocytes (Treg), as well as con-centrations of corresponding interleukins (IL) which were reported to be the hallmarks of human Th17 and Treg lymphocyte differentiation, this is IL-1beta, IL-6, IL-17A, IL-23 and Transforming Growth Factor beta 1 (TGF-beta1), respectively.
Cell isolation, culture and flow cytometric analysis
Peripheral blood mononuclear cells (PBMC) were isolated from 10 ml of heparinized venous blood samples. For Th17 frequency detection, four hour cultures of PBMC in the presence of stimulators i.e. ionomycin (1μg/ml) (Salt Cacium Ionomycin from Streptomyces, Sigma-Aldrich) and phorbol myristate acetate-PMA (50 ng / ml) (Sigma-Aldrich, USA), as well as 10μg/ml of brefeldin A (Sigma-Aldrich, UK), were employed. Cells were labeled with fluores-cein isothiocyanate (FITC)-conjugated anti-human CD 3 and CD4 antibodies directed against cell surface antigens (anti-human CD3 PE-Cy5, anti-human CD4 FITC, BD Biosciences). Then, the samples were fixed, permeabilized and stained with the intracellular phycoerythrin (PE)-conjugated anti-human IL-17A (anti-IL-17-PE, human, Miltenyi Biotec) according to the protocol provided by the manufacturer (eBiosciences, San Diego, USA).
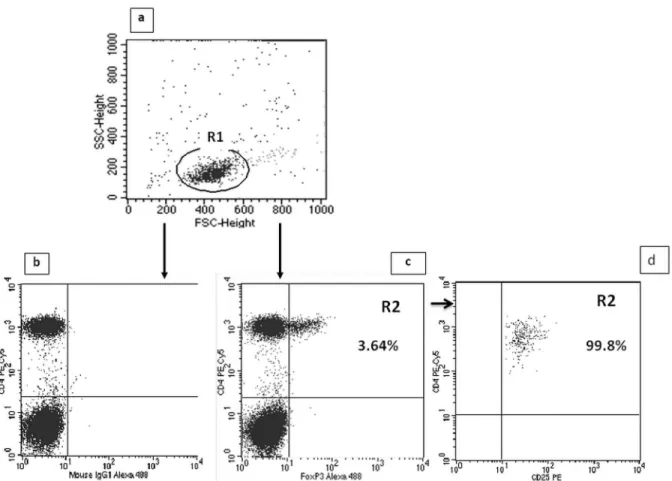
For determination of the Treg cell frequency (CD4+CD25highFoxP3+), Human Treg Flow TM Kit (FoxP3 Alexa Fluor 488/CD4 PE-Cy5/CD25 PE, BioLegend) was used in accordance with the recommendations of the manufacturer. Firstly, peripheral blood samples (100μL) were surface-stained with FITC-conjugated anti-human CD4 antibodies and allophycocyanin (APC)-conjugated anti-human CD25 antibodies for 30 minutes, then treated with Fix/Perm buffer (eBiosciences, USA) according to the manufacturer’s instructions. Intracellular FoxP3 expression was determined using mouse anti- FoxP3 Alexa Fluor 488 at concentration of 5 ml per tube, for 30 minutes, in the dark at room temperature. After the intracellular staining, cells were washed in 0.5 ml of buffer and evaluated for the expression of FoxP3 and CD25 on CD4+ cells by flow cytometry. Each sample was carried out in parallel to the negative control using isotypes for anti-FoxP3.
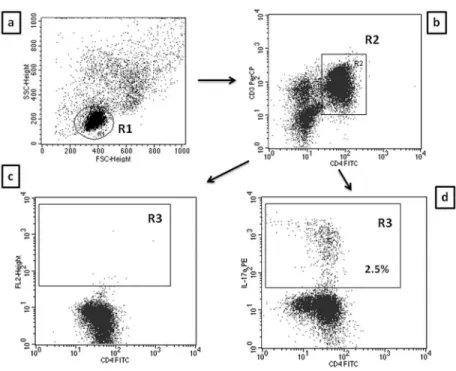
A FACSCalibur flow cytometer (Becton Dickinson, USA) with CellQuest Pro software was used to identify T cell phenotype and to perform analyses. Isotype-matched antibodies were used for verification of staining specificity and for setting the markers to delineate positive and negative populations. Percentage of cells positively labeled with monoclonal antibodies was estimated. Th17 cells were characterized as CD3+CD4+IL17+and Tregs as CD4 +-CD25highFoxP3+, and expressed as the percentage of all CD3+CD4+and CD4+CD25+ lym-phocytes, respectively. Examples of cytometric evaluation of Th17 and Treg cells are presented in Figs1and2.
Determination of serum interleukin concentrations
conducted according to the procedure recommended by the producer and described in the attached materials. Measurements were performed using VictorTM3 Reader (PerkinElmer, USA).
Statistical analysis
Statistical analysis was performed using the Statistica 10 software package (StatSoft, Poland). The distribution of the data in the groups was preliminarily evaluated by Kolmogorow and Smirnov test. A skewed distribution of checked values was found, so continuous variables were presented as medians with interquartile range and assessed using Mann-Whitney U test. Cate-gorical variables were described as numbers with percentage and compared using either Fish-er’s exact test or theχ2test as appropriate. The differences in inflammatory and immune
biomarker levels between CTP classes were analyzed using Kruskal-Wallis and multiple com-parisons post-hoc tests. Spearman’s rank correlation test was used for the assessment of associ-ation between parameters of liver function, traditional indicators of inflammassoci-ation and new immune biomarker plasma levels. The receiver operating curves (ROC) for significant factors were constructed and their areas under the curve (AUCs) checked in order to assess their accu-racy in predicting the degree of liver failure and the development of ALD complications. The method of DeLong et al. [25] for the calculation of the Standard Error of the AUC was used. The Youden index and its associated cutoff point was estimated for each marker [26]. Then, multivariable logistic regression was applied in order to select independent predictors of advanced liver dysfunction and the development of ALD complications with adjustment for
Fig 1. Evaluation of CD4/CD3+/IL-17A+ (Th17) cells frequency in ALD patients by flow cytometry.A. The lymphocyte subpopulation was gated (R1) based on linear forward vs. side scatter (FSC/SSC) characteristics. B. The R1 cells were further evaluated for CD3 PE-Cy5 and CD4 FITC staining with
subsequent CD4+/CD3+ cell identification (region R2). C. Dot plots of CD4FITC versus mouse IgG1 PE were established (controls). D. Dot plots of CD4FITC versus IL-17A PE were established by combined gating of R1 and R2 events. The R3 region represents the percentage of CD4+/CD3+/IL-17A+ (Th17) cells among all CD4 +CD3+ lymphocytes.
the patient background. A two- sided p- value of less than 0.05 were considered to be associated with statistical significance.
Ethical requirements
All individuals signed the written informed consent prior to their inclusion in the study and were free to withdraw at any time without providing a reason. Strict confidentiality was maintained throughout the process of data collection and analysis. The study protocol conforms to the ethi-cal guidelines of the 1975 Declaration of Helsinki (6th revision, 2008) as reflected in a priori approval by the institutional review board of Medical University of Lublin (KE-0254/141/2010).
Results
Significant differences in the basic characteristics between males and
females with ALD
One hundred and forty seven patients (pts) met the inclusion criteria, 107 males (72.8%) and 40 females (27.2%). Their mean age was 49.84 ± 11.53 and 48.82 ± 9.94, respectively. Twelve
Fig 2. Evaluation of CD4+CD25highFoxP3+(Treg) cells frequency in ALD patients by flow cytometry.A. The lymphocyte subpopulation was gated (R1) based on linear forward vs. side scatter (FSC/SSC) characteristics. B. Dot plots of CD4 PE-Cy5 versus mouse IgG1 Alexa Fluor 488 were established (controls). C. Dot plots of CD4 PE-Cy5 versus the intracellular expression of FoxP3 Alexa Fluor 488 in CD4+ T cells were established. The R2 region represents the percentage of CD4+CD25highFoxP3+ (Treg) cells among all CD4+CD25+ lymphocytes. D. 99.8% of cells gated as CD4+FoxP3+ (R2) were CD25high.
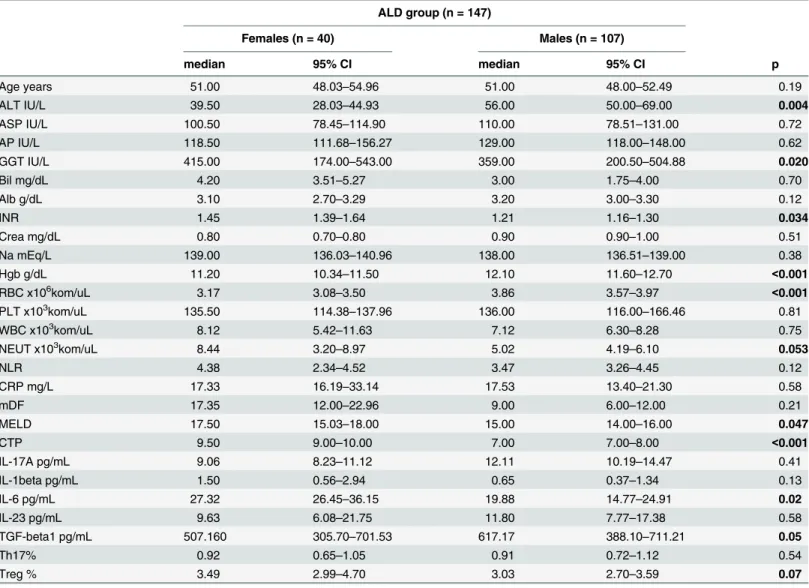
(8.16%) of 147 pts with ALD died from complications of liver failure within 90 days of follow up. The matching control group consisted of 17 (56.7%) males and 13 (43.3%) females aged 44.31 ± 10.23 and 43.11 ± 8.43, respectively. Several surveys have indicated that the relative risk of alcohol- associated liver injury is higher in females in comparison to males. [27–29]. Therefore, patients were assigned to two subgroups based on their gender. The baseline charac-teristics of ALD patients is summarized inTable 1.
Men and women in our cohort differed significantly with respect to liver function parame-ters. Females presented with significantly lower activity of ALT, but higher GGT and INR and consistently more severe liver dysfunction as indicated by both MELD and CTP scores. Also
Table 1. Demographic and laboratory data in patients with ALD.a
ALD group (n = 147)
Females (n = 40) Males (n = 107)
median 95% CI median 95% CI p
Age years 51.00 48.03–54.96 51.00 48.00–52.49 0.19
ALT IU/L 39.50 28.03–44.93 56.00 50.00–69.00 0.004
ASP IU/L 100.50 78.45–114.90 110.00 78.51–131.00 0.72
AP IU/L 118.50 111.68–156.27 129.00 118.00–148.00 0.62
GGT IU/L 415.00 174.00–543.00 359.00 200.50–504.88 0.020
Bil mg/dL 4.20 3.51–5.27 3.00 1.75–4.00 0.70
Alb g/dL 3.10 2.70–3.29 3.20 3.00–3.30 0.12
INR 1.45 1.39–1.64 1.21 1.16–1.30 0.034
Crea mg/dL 0.80 0.70–0.80 0.90 0.90–1.00 0.51
Na mEq/L 139.00 136.03–140.96 138.00 136.51–139.00 0.38
Hgb g/dL 11.20 10.34–11.50 12.10 11.60–12.70 <0.001
RBC x106kom/uL 3.17 3.08
–3.50 3.86 3.57–3.97 <0.001
PLT x103kom/uL 135.50 114.38
–137.96 136.00 116.00–166.46 0.81
WBC x103kom/uL 8.12 5.42
–11.63 7.12 6.30–8.28 0.75
NEUT x103kom/uL 8.44 3.20–8.97 5.02 4.19–6.10 0.053
NLR 4.38 2.34–4.52 3.47 3.26–4.45 0.12
CRP mg/L 17.33 16.19–33.14 17.53 13.40–21.30 0.58
mDF 17.35 12.00–22.96 9.00 6.00–12.00 0.21
MELD 17.50 15.03–18.00 15.00 14.00–16.00 0.047
CTP 9.50 9.00–10.00 7.00 7.00–8.00 <0.001
IL-17A pg/mL 9.06 8.23–11.12 12.11 10.19–14.47 0.41
IL-1beta pg/mL 1.50 0.56–2.94 0.65 0.37–1.34 0.13
IL-6 pg/mL 27.32 26.45–36.15 19.88 14.77–24.91 0.02
IL-23 pg/mL 9.63 6.08–21.75 11.80 7.77–17.38 0.58
TGF-beta1 pg/mL 507.160 305.70–701.53 617.17 388.10–711.21 0.05
Th17% 0.92 0.65–1.05 0.91 0.72–1.12 0.54
Treg % 3.49 2.99–4.70 3.03 2.70–3.59 0.07
aAlb- albumin (normal range (NR) 3.2
–4.8); ALD- alcoholic liver disease; ALT- alanine aminotransferase (NR)<31); AP- alkaline phosphatase (NR 45– 129); AST- aspartate aminotransferase (NR<34); Bil- bilirubin (NR 0.3–1.2); CI-Confidence Interval; Crea- creatinine (NR 0.5–1.1); CRP- C-reactive protein (NR 0.0–5.0); CTP- Child-Turcotte- Pugh score; GGT- gamma-glutamyl transpeptidase (NR<50.0); Hgb- hemoglobin (NR 14.0–18.0); IL-interleukin; INR- International Normalized Ratio (NR 0.8–1.2); MELD- Model for End-Stage Liver Disease; Na- sodium (NR 136–145); NEUT- neutrophils (NR 1.8–7.7); NLR- neutrophil to lymphocyte ratio; PLT- platelets (NR 130–400); RBC- red blood cells (NR 4.5–6.1); TGF- Transforming Growth Factor; Th- T helper cells; Treg- regulatory T cells; WBC- white blood cells (NR 4.8–10.8).
anemia was more prevalent in women with ALD in comparison with men. Moreover, signifi-cant differences of IL-6 and TGF-beta1 levels and the tendency to the higher percentage of Treg cells in females were observed.
Pro- inflammatory cytokine profile and its gender-related differences in
patients with ALD
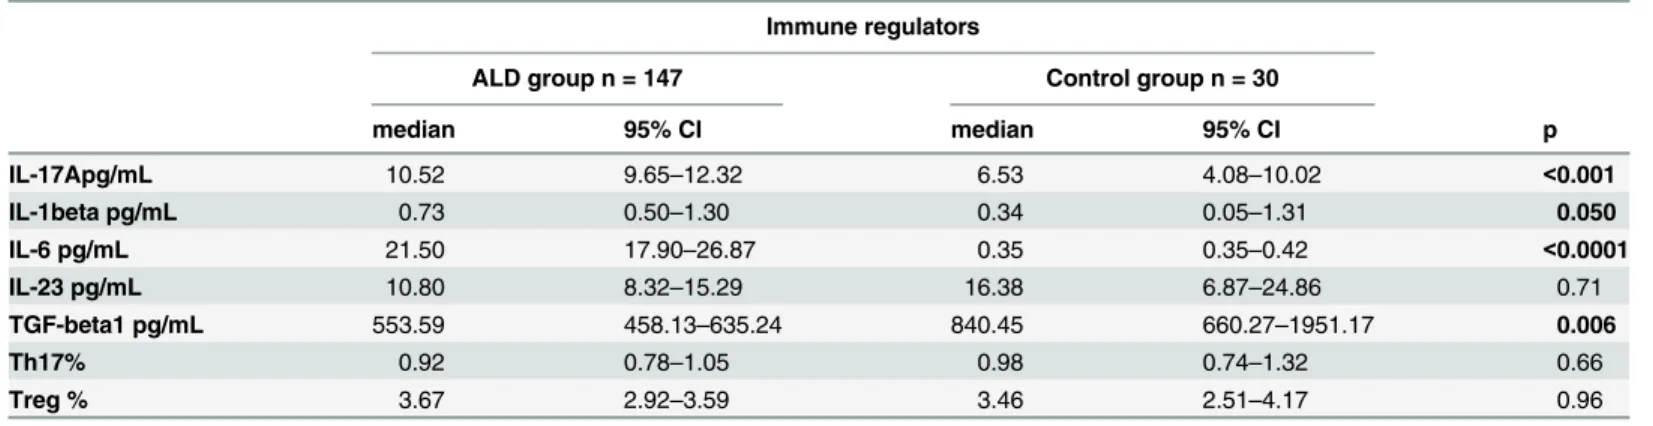
Concentrations of four tested cytokines in ALD group significantly differed in comparison to controls. Plasma IL-17A, IL-1beta, IL-6 levels were increased, while the level of TGF-beta1 was significantly lower. Results are presented inTable 2.
Subsequent analysis revealed no gender-related differences in the concentrations of inflam-matory and immune biomarkers in the control group. However, as mentioned above, in patients with ALD significant gender-related differences in IL-6 and TGF-beta1 levels and the tendency to the higher percentage of Treg cells in females were observed (Table 1andFig 3).
Inflammatory and immune regulator levels in ALD patients with different
stages of liver dysfunction
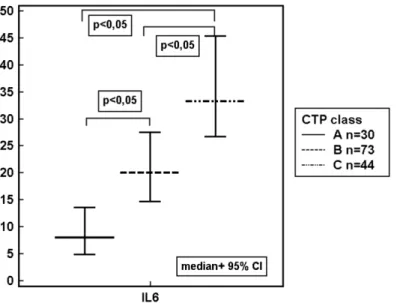
Our study revealed, that the level of IL-6 were increasing in parallel to the grade of liver failure classified according to the CTP and MELD score (Table 3,Fig 4).
Furthermore, the highest correlation was found between IL-6 and two parameters of liver function: positive for INR (S1 Fig) and inverse for serum albumin level (S2 Fig) (Rho 0.339; p<0.0001 and Rho—0.599; p<0.0001; respectively). A weak correlation between IL-1beta and AP, as well as IL-1beta and GGT was observed (Rho—0.20; p = 0.02; Rho—0.20; p = 0.01; respectively). Moreover, IL-6 correlated with all traditional indicators of inflammation: CRP level (Rho 0.48; p<0.0001) (S3 Fig), the white blood cell (Rho 0.19; p = 0.02) and neutrophil count (Rho 0.19; p = 0.02), and NLR (Rho 0.24; p = 0.004).
Then, we investigated concentrations of immune variables in ALD patients assigned accord-ing to the presence of the disease complications. Up-regulation of IL-6 was observed in sub-groups with all studied ALD complications. Multiple pro-inflammatory regulators were increased in the blood of patients with ascites, hepatic encephalopathy and non-survivors in comparison to patients without these complications. Immune imbalance with significantly
Table 2. Comparison of immune regulator levels in ALD patients and the control group.a
Immune regulators
ALD group n = 147 Control group n = 30
median 95% CI median 95% CI p
IL-17Apg/mL 10.52 9.65–12.32 6.53 4.08–10.02 <0.001
IL-1beta pg/mL 0.73 0.50–1.30 0.34 0.05–1.31 0.050
IL-6 pg/mL 21.50 17.90–26.87 0.35 0.35–0.42 <0.0001
IL-23 pg/mL 10.80 8.32–15.29 16.38 6.87–24.86 0.71
TGF-beta1 pg/mL 553.59 458.13–635.24 840.45 660.27–1951.17 0.006
Th17% 0.92 0.78–1.05 0.98 0.74–1.32 0.66
Treg % 3.67 2.92–3.59 3.46 2.51–4.17 0.96
aALD- alcoholic liver disease, CI- Con
fidence Interval, IL- interleukin, p- level of significance, TGF- Transforming Growth Factor, Th- T helper cells; Treg-regulatory T cells.
Fig 3. Gender- related differences in serum cytokine concentrations in ALD group.IL-6 pg/mL; TGF-beta1 ng/mL. ALD- alcoholic liver disease, 95% CI- Confidence Interval, IL- interleukin, TGF- Transforming Growth Factor, p- level of significance.
doi:10.1371/journal.pone.0128347.g003
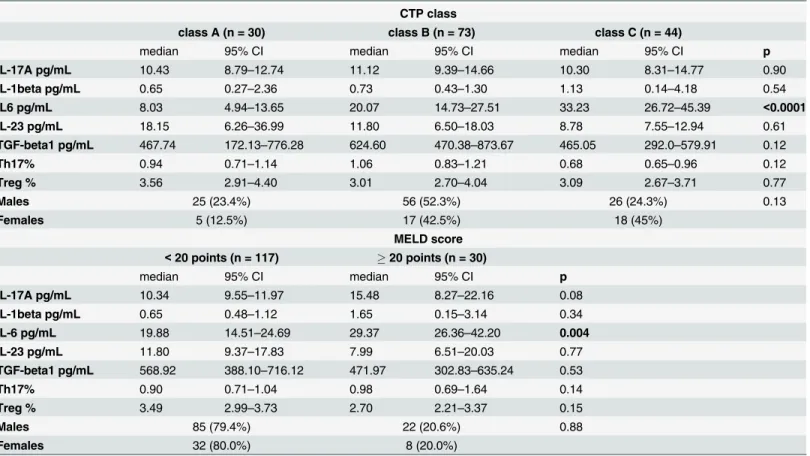
Table 3. Immune regulator levels in subgroups of ALD patients with different grade of liver failure.a
CTP class
class A (n = 30) class B (n = 73) class C (n = 44)
median 95% CI median 95% CI median 95% CI p
IL-17A pg/mL 10.43 8.79–12.74 11.12 9.39–14.66 10.30 8.31–14.77 0.90
IL-1beta pg/mL 0.65 0.27–2.36 0.73 0.43–1.30 1.13 0.14–4.18 0.54
IL6 pg/mL 8.03 4.94–13.65 20.07 14.73–27.51 33.23 26.72–45.39 <0.0001
IL-23 pg/mL 18.15 6.26–36.99 11.80 6.50–18.03 8.78 7.55–12.94 0.61
TGF-beta1 pg/mL 467.74 172.13–776.28 624.60 470.38–873.67 465.05 292.0–579.91 0.12
Th17% 0.94 0.71–1.14 1.06 0.83–1.21 0.68 0.65–0.96 0.12
Treg % 3.56 2.91–4.40 3.01 2.70–4.04 3.09 2.67–3.71 0.77
Males 25 (23.4%) 56 (52.3%) 26 (24.3%) 0.13
Females 5 (12.5%) 17 (42.5%) 18 (45%)
MELD score <20 points (n = 117) 20 points (n = 30)
median 95% CI median 95% CI p
IL-17A pg/mL 10.34 9.55–11.97 15.48 8.27–22.16 0.08
IL-1beta pg/mL 0.65 0.48–1.12 1.65 0.15–3.14 0.34
IL-6 pg/mL 19.88 14.51–24.69 29.37 26.36–42.20 0.004
IL-23 pg/mL 11.80 9.37–17.83 7.99 6.51–20.03 0.77
TGF-beta1 pg/mL 568.92 388.10–716.12 471.97 302.83–635.24 0.53
Th17% 0.90 0.71–1.04 0.98 0.69–1.64 0.14
Treg % 3.49 2.99–3.73 2.70 2.21–3.37 0.15
Males 85 (79.4%) 22 (20.6%) 0.88
Females 32 (80.0%) 8 (20.0%)
aALD- alcoholic liver disease, CI- Con
fidence Interval, CTP class- Child-Turcotte-Pugh class, IL- interleukin, MELD- Model for End-Stage Liver Disease, p- level of significance, TGF- Transforming Growth Factor, Th- T helper cells; Treg- regulatory T cells.
higher frequency of Th17 cells and the significantly lower percentage of Tregs in peripheral blood was found in non-survivors. The results are summarized inTable 4andFig 5.
In subgroups with oesophageal varices (n = 87) and renal impairment (n = 22), IL-6 was the only biomarker which concentrations significantly differed in comparison to ALD individuals without aforementioned complications (median; 95% CI: 24.63; 18.65–28.30 versus 15.92; 9.79–24.82; p = 0.04; and 31.14; 26.44–108.34 versus 20.07; 15.68–24.62; p = 0.003, respec-tively). No gender-related differences in the prevalence of both types of ALD complications were observed.
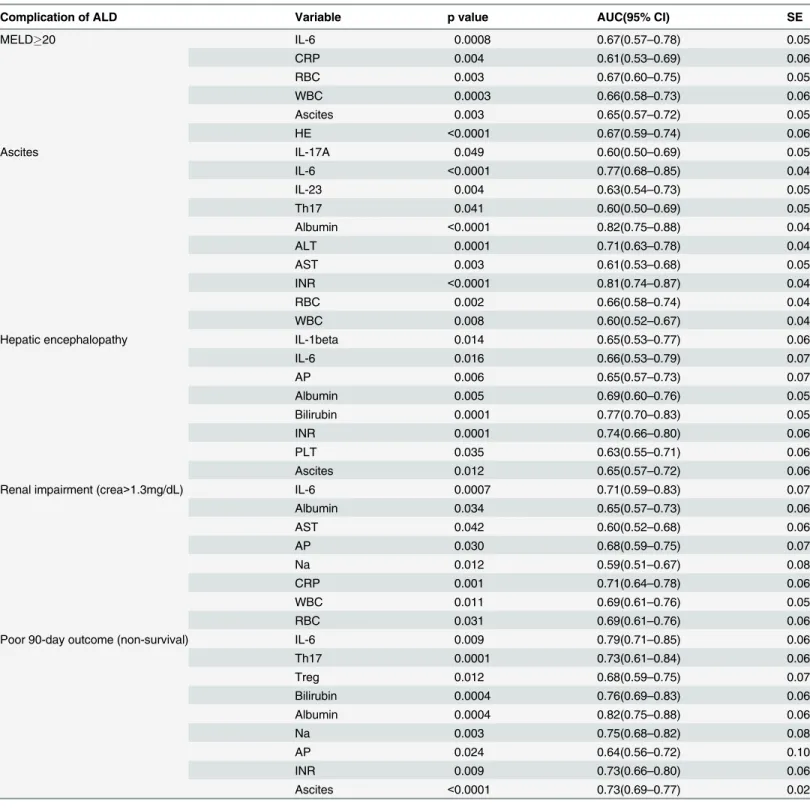
All traditional (Table 1) and immune variables (Table 2) were checked in univariate analysis for a possible association with the advanced liver dysfunction (MELD20) and ALD compli-cations in the studied cohort. For significant ones, the areas under the curve (AUCs) were assessed and their diagnostic accuracy was compared (Table 5).
Applications of ROC curves include assessment of the effectiveness of continuous diagnostic markers in distinguishing between diseased and non-diseased individuals. As reported else-where, AUC has a real clinical significance when its value exceeds 0.7 and AUC values between 0.8 and 0.9 demonstrate excellent diagnostic accuracy [30,31].
In our study, the highest AUCs were found for IL-6 in ascites (0.77) and non-survivor (0.79) subgroups, demonstrating moderate discriminatory power and, therefore potential util-ity as a diagnostic test in evaluation of ALD complications. However, AUC values for the tradi-tional liver function parameter, this is albumin concentrations, performed better in both aforementioned subgroups (0.82 and 0.82, respectively).
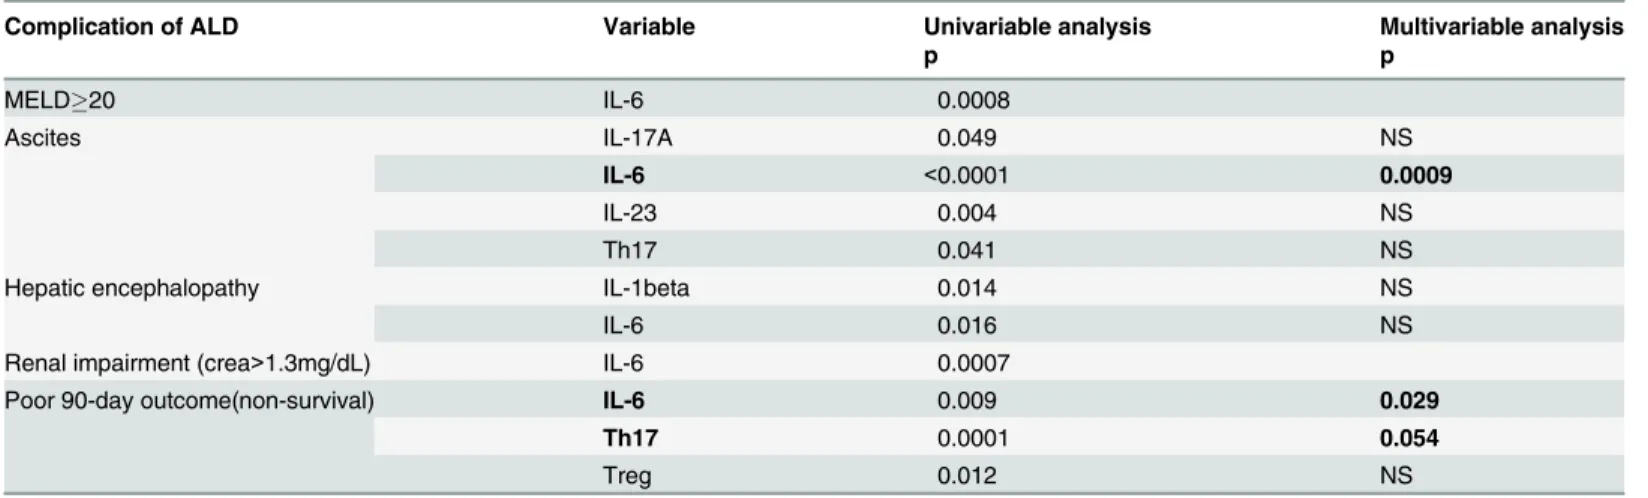
Selection of independent predictors of advanced liver dysfunction and/or
ALD complications
Finally, multivariable logistic regression was applied in order to select independent predictors of advanced liver failure and ALD complications. Multivariable analysis of significant, immune factors revealed independent association of IL-6 with the ascites development, as well as the
Fig 4. IL-6 concentrations (pg/mL) in ALD patients assigned according to the CTP class. ALD-alcoholic liver disease, 95% CI- Confidence Interval, CTP class- Child-Turcotte-Pugh class, IL- interleukin, p-level of significance.
poor 90 day prognosis. Furthermore, we also found the borderline significance of Th17 impact on the survival (Table 6).
When immune factors were adjusted to significant, traditional indicators of liver failure and analyzed together, only two variables revealed their independent association with ALD compli-cations. Plasma IL-6 and sodium levels influenced the mortality rate over a 90 day follow-up. The predictive power (AUC) of the complex statistical model constructed from the two signifi-cant parameters occurred to be superior to the power of either parameter alone (Table 7).
Table 4. Immune regulator levels in ALD patients assigned according to the presence of the disease complications.a
Ascites
absent (n = 58) persent (n = 89)
median 95% CI median 95% CI p
IL-17A pg/mL 11.69 9.75–19.383 10.19 8.41–12.04 0.053
IL-1beta pg/mL 0.47 0.25–1.54 0.97 0.59–2.33 0.48
IL-6 pg/mL 10.47 7.54–14.35 29.39 25.12–35.92 <0.0001
IL-23 pg/Ml 18.15 11.98–28.87 7.99 6.45–10.80 0.006
TGF-beta1 pg/mL 705.15 469.09–854.83 499.34 334.10–617.17 0.25
Th17% 1.08 0.93–1.15 0.85 0.65–0.93 0.04
Treg % 3.20 2.84–3.63 3.31 2.83–3.74 0.44
Males 49 (45.8%) 58 (54.2%) 0.02
Females 9 (22.5%) 31 (77.5%)
Hepatic encephalopathy
absent (n = 127) present (n = 20)
median 95% CI median 95% CI p
IL-17A pg/mL 10.34 9.52–12.02 20.11 8.99–24.15 0.07
IL-1beta pg/mL 1.10 0.59–1.65 0.07 0.00–0.93 0.03
IL-6 pg/mL 21.25 16.37–25.43 35.30 22.56–54.87 0.03
IL-23 pg/mL 10.80 7.99–14.54 12.55 6.30–31.72 0.53
TGF-beta1 pg/mL 554.32 458.13–706.09 471.97 263.57–707.05 0.28
Th17% 0.92 0.78–1.05 0.82 0.62–1.20 0.75
Treg % 3.37 2.91–3.67 3.03 2.48–3.59 0.74
Males 91 (85.0%) 16 (15.0%) 0.59
Females 36 (90.0%) 4 (10.0%)
90-day disease outcome
survivors (n = 135) non-survivors (n = 12)
median 95% CI median 95% CI p
IL-17A pg/mL 11.12 9.85–12.93 9.09 6.93–11.30 0.27
IL-1beta pg/mL 0.73 0.50–1.50 0.58 0.09–5.37 0.82
IL-6 pg/mL 20.49 16.23–26.47 41.20 24.42–91.76 0.006
IL-23 pg/mL 11.80 9.37–16.14 5.56 2.45–21.46 0.23
TGF-beta1 pg/mL 554.32 388.10–705.15 499.34 321.83–887.53 0.86
Th17% 0.90 0.69–0.99 1.33 0.98–1.73 0.009
Treg % 3.40 2.98–3.69 2.64 1.99–2.99 0.056
Males 99 (92.5%) 8 (7.5%) 0.73
Females 36 (90.0%) 4 (10.0%)
aALD- alcoholic liver disease, CI- Con
fidence Interval, IL- interleukin, p- level of significance, TGF- Transforming Growth Factor, Th- T helper cells; Treg-regulatory T cells.
High concentrations of IL6 turned out to be the only independent predictor of non-survival among studied immune regulators. No independent association of any other biomarker with any complication of ALD could be confirmed.
Discussion
Results of the present study support concepts that excessive alcohol consumption induces sys-temic inflammatory activation with a pro-inflammatory cytokine storm which may affect mul-tiple organs and tissues. Pro-inflammatory tumor necrosis factor alpha (TNF-alpha) has already been demonstrated to be one of the key factors in the pathogenesis of ALD [32]. Our study revealed significant over-expression of pro-inflammatory, Th17 lymphocyte-related cytokines: IL-17A, IL-1beta and IL-6 in coexistence with significant down-regulation of Treg lymphocyte-related TGF-beta1 in peripheral blood of ALD group in comparison to healthy controls. These data are consistent with results obtained by Lemmers et al. [33] who first reported the involvement of the IL-17 pathway in human alcoholic liver disease. Elevated IL-17 concentrations have been also reported in other liver diseases: autoimmune hepatitis, HBV and HCV infections, and primary biliary cirrhosis [34–36]. Surprisingly, no difference in plasma IL-23 levels, which is crucial for the differentiation and maintenance of Th17 cells, was found. Nevertheless, it was in agreement with results obtained by Stoy et al. [37] who also did not observed any changes in the blood concentrations of IL-23 in patients with alcoholic hepatitis. On the other hand the similar cytokine profile, this is decreased levels of TGF-beta1 in coexis-tence with increased IL-17 concentrations, was described by Xing et al. [38] in patients with lupus nephritis. Rollnik et al. [39] reported reduced TGF-beta1 levels in serum in multiple scle-rosis. Decreased concentrations of TGF-beta1 in inflammatory disorders may be explained by its other characteristics. In addition to the promotion of Treg cells differentiation, it can inhibit the secretion of many cytokines (eg. interferon-gamma, TNF-alpha), as well as the expression of cytokine receptors, (eg. IL-2 receptor), and as a consequence down-regulate the activity of immune cells [40]. On the other hand, decreased TGF-beta1 concentrations (also found in our patients with ALD) may contribute to perpetuation of inflammatory reactions.
Fig 5. Peripheral blood frequencies (%) of Th17 and Treg cells in ALD survivors and non-survivors. ALD- alcoholic liver disease, 95% CI- Confidence Interval, p- level of significance, Th- T helper cells, Treg-regulatory T cells.
Table 5. Comparison of the diagnostic accuracy (AUC) of single variables in the diagnosis of advanced liver dysfunction (MELD20) and ALD complications.a
Complication of ALD Variable p value AUC(95% CI) SE
MELD20 IL-6 0.0008 0.67(0.57–0.78) 0.05
CRP 0.004 0.61(0.53–0.69) 0.06
RBC 0.003 0.67(0.60–0.75) 0.05
WBC 0.0003 0.66(0.58–0.73) 0.06
Ascites 0.003 0.65(0.57–0.72) 0.05
HE <0.0001 0.67(0.59–0.74) 0.06
Ascites IL-17A 0.049 0.60(0.50–0.69) 0.05
IL-6 <0.0001 0.77(0.68–0.85) 0.04
IL-23 0.004 0.63(0.54–0.73) 0.05
Th17 0.041 0.60(0.50–0.69) 0.05
Albumin <0.0001 0.82(0.75–0.88) 0.04
ALT 0.0001 0.71(0.63–0.78) 0.04
AST 0.003 0.61(0.53–0.68) 0.05
INR <0.0001 0.81(0.74–0.87) 0.04
RBC 0.002 0.66(0.58–0.74) 0.04
WBC 0.008 0.60(0.52–0.67) 0.04
Hepatic encephalopathy IL-1beta 0.014 0.65(0.53–0.77) 0.06
IL-6 0.016 0.66(0.53–0.79) 0.07
AP 0.006 0.65(0.57–0.73) 0.07
Albumin 0.005 0.69(0.60–0.76) 0.05
Bilirubin 0.0001 0.77(0.70–0.83) 0.05
INR 0.0001 0.74(0.66–0.80) 0.06
PLT 0.035 0.63(0.55–0.71) 0.06
Ascites 0.012 0.65(0.57–0.72) 0.06
Renal impairment (crea>1.3mg/dL) IL-6 0.0007 0.71(0.59–0.83) 0.07
Albumin 0.034 0.65(0.57–0.73) 0.06
AST 0.042 0.60(0.52–0.68) 0.06
AP 0.030 0.68(0.59–0.75) 0.07
Na 0.012 0.59(0.51–0.67) 0.08
CRP 0.001 0.71(0.64–0.78) 0.06
WBC 0.011 0.69(0.61–0.76) 0.05
RBC 0.031 0.69(0.61–0.76) 0.06
Poor 90-day outcome (non-survival) IL-6 0.009 0.79(0.71–0.85) 0.06
Th17 0.0001 0.73(0.61–0.84) 0.06
Treg 0.012 0.68(0.59–0.75) 0.07
Bilirubin 0.0004 0.76(0.69–0.83) 0.06
Albumin 0.0004 0.82(0.75–0.88) 0.06
Na 0.003 0.75(0.68–0.82) 0.08
AP 0.024 0.64(0.56–0.72) 0.10
INR 0.009 0.73(0.66–0.80) 0.06
Ascites <0.0001 0.73(0.69–0.77) 0.02
a
ALD- alcoholic liver disease; ALT- alanine aminotransferase; AP- alkaline phosphatase; AST- aspartate aminotransferase; AUC- area under the ROC curve, CI- Confidence Interval, CRP- C-reactive protein; HE- hepatic encephalopathy, IL- interleukin; INR- International Normalized Ratio; Na- sodium; PLT- platelets; RBC- red blood cells; SE- Standard Error, Th- T helper cells; Treg- regulatory T cells; WBC- white blood cells.
Our data suggest that IL-6 have the highest diagnostic and prognostic value among all stud-ied biomarkers. Its increased concentrations were associated with all major ALD complications (ascites, hepatic encephalopathy, oesophageal varices, renal impairment and mortality). We also observed isolated over-expression of IL-6 increasing in parallel to the severity of liver dys-function defined according to the criteria of the CTP and MELD (Table 3,Fig 4). No other studied inflammatory and/or immune biomarker revealed association with above scores. Fur-thermore, IL-6, as well as sodium levels, turned out to be an independent predictor of poor 90-day prognosis (non-survival). The prognostic value of sodium in cirrhotics is well recog-nized [41,42]. Our results remain in accordance with Sheron et al. report [43] that found a cor-relation between elevated plasma IL-6 and increased severity and mortality in alcoholic hepatitis. Nevertheless, the role of IL-6 in ALD is complex and not quite clear. On the one hand, IL-6 may promote human Th17 differentiation and IL-17 production contributing to ethanol-induced liver inflammation. On the other hand, several recent experimental studies in animal models have suggested that IL-6 plays a crucial role in the protection against alcohol-induced liver damage [44,45]. It exerts this action via the activation of signal transducer and activator of transcription 3 (STAT3) and the subsequent induction of several hepatoprotective genes in hepatocytes [46,47]. Consistent with this, elevated IL-6 concentrations in our cohort might in part reflect mechanisms ameliorating alcoholic liver injury. All together, targeting IL-6 signaling represent a tempting option and might be a potential therapeutic strategy in ALD. Nevertheless, we have to keep in mind the anti-TNF-alpha experience where the initial results
Table 6. Immune predictors of advanced liver dysfunction (MELD20) and ALD complications.a
Complication of ALD Variable Univariable analysis Multivariable analysis
p p
MELD20 IL-6 0.0008
Ascites IL-17A 0.049 NS
IL-6 <0.0001 0.0009
IL-23 0.004 NS
Th17 0.041 NS
Hepatic encephalopathy IL-1beta 0.014 NS
IL-6 0.016 NS
Renal impairment (crea>1.3mg/dL) IL-6 0.0007
Poor 90-day outcome(non-survival) IL-6 0.009 0.029
Th17 0.0001 0.054
Treg 0.012 NS
aALD- alcoholic liver disease, IL- interleukin, MELD- Model for End-Stage Liver Disease, NS- not signi
ficant, p- level of significance, Th- T helper cells; Treg- regulatory T cells.
doi:10.1371/journal.pone.0128347.t006
Table 7. Independent predictors of poor ALD outcome (multivariable analysis).a
Complication of ALD Variable p value Adjusted OR (95% CI) AUC (95% CI) SE
Poor 90-day outcome (non-survival) IL-6 0.009 1.01 (1.00–1.01) 0.92(0.86–0.96) 0.02
Na 0.001 0.80 (0.70–0.91)
aALD- alcoholic liver disease, AUC- area under the ROC curve, CI- Con
fidence Interval, IL- interleukin, Na- sodium, OR- Odds ratio, p- level of significance, SE- standard error.
with the anti-TNF agent infliximab were also particularly promising [48], but subsequent increase in mortality and a high rate of infection led to trials termination [49].
The altered profile of studied cytokines suggested that defects in inflammatory regulation in the course of ALD might derive from impaired balance of T helper subsets. Our subsequent assessment of their blood frequencies revealed the systemic Th17/Treg imbalance present in the most severely ill patients who died within 90-day follow up. Recently, Ma et al. [50] have reported that oxidative stress in fatty liver induced apoptosis of Treg, reduced their hepatic content, and led to decreased suppression of inflammatory responses. It is likely that Th17/ Treg imbalance might contribute to the protraction of inflammation leading to the fatal disease outcome in our cohort. Nevertheless, multivariable logistic regression failed to show both Th17 and Treg cells independent impact on mortality in our cohort. The present study suggests that the imbalance of Th17/Treg cells, although present in the most severe stage of ALD, may not play a decisive role early in the disease course. Alterations in the Th17/Treg balance have also been confirmed in experimental liver fibrosis in mice [51], as well as in several autoimmune and inflammatory diseases and cancers [52–54].
Interestingly, analysis of data by gender showed the presence of significant differences in concentrations of some inflammatory and immune biomarkers between men and women with ALD. They were not found in healthy subjects. We observed significantly higher neutrophil counts and IL-6 concentrations, but lower TGF-beta1 levels and a tendency to the higher fre-quency of Treg cells in females in comparison with males. We are tempted to speculate that gender-related differences in the inflammatory and immune response in the course of ALD might influence different susceptibility to liver injury in both sexes.
Men and women in our ALD cohort differed significantly with respect to their liver function parameters (ALT and GGT activities, INR). Since females presented with more severe liver dys-function as indicated by higher CTP and MELD scores (what was in line with their higher GGT and INR), their lower ALT activities in this context might be explained by a reduced grade of inflammation in the more advanced disease stage. Our results are consistent with epi-demiological data indicating that women develop alcohol-related liver cirrhosis at earlier age [55,56]. Therefore, it is likely that in our study where both gender subgroups did not differ sig-nificantly with respect to their age (p>0.05), the extent of hepatic damage in females was greater.
Anemia and ascites were also more prevalent in women with ALD than in men. As a rule, women of reproductive age are at increased risk of iron deficiency anemia. In addition, it might be explained in part by the chronic inflammatory response in ALD. Moreover, a protein nutri-tion status might have an impact on ascites formanutri-tion in both sexes, although we could not confirm significant differences in peripheral blood albumin levels.
We did not find significant correlations between the number of drinks per day and cytokine concentrations and/or inflammatory parameter levels. It is likely that there is not a simple effect of an amount of alcohol consumption on the immune response. Although it is the most potent factor, ALD mechanisms seem to be more complicated and several host and environ-mental factors may account for variations in the intensity of liver inflammation as well as sus-ceptibility to alcohol-induced liver injury [57–60]. Our results are consistent with previous reports indicating that some heavy drinkers do not suffer from liver injury [61,62]. These aspects of ALD pathogenesis require further investigations.
concentration of beverages are not easy to estimate, the real ethanol intake may lack precision [63]. Also Stockwell and Stirling [64] reported that most individuals are not able to accurately assess the volume and power of one drink. In countries like Poland, alcohol intake patterns vary considerably by regions and beverage type, so special attention should be paid to the assessment of drink types and sizes for accurate alcohol consumption estimation.
Conclusions
Results obtained in the present study correspond to the general belief in the presence of periph-eral inflammatory activation during the course of ALD. We provide evidence that IL-6 revealed the highest diagnostic and prognostic value among all studied immune biomarkers. Its sys-temic concentrations were related to the severity of liver dysfunction, development of ALD complications and 90-day survival. The presence of systemic Th17/Treg imbalance might be a poor prognostic indicator associated with the fatal ALD course. Moreover, it seems that gen-der-related differences in the inflammatory and immune response might influence the suscep-tibility to alcohol-associated liver injury in males and females. Our results require further confirmation in multicenter studies.
Supporting Information
S1 Fig. Correlation between INR and serum IL-6 concentrations (pg/mL) in 147 patients with ALD.Rank correlation test. A logarithmic transformation was used for both variables. ALD- alcoholic liver disease, 95% CI- Confidence Interval, IL- interleukin, p- level of signifi-cance, Rho- Spearman's correlation coefficient.
(TIF)
S2 Fig. Correlation between serum albumin (g/dL) and IL-6 (pg/mL) concentrations in 147 patients with ALD.Rank correlation test. A logarithmic transformation was used for both var-iables. ALD- alcoholic liver disease, 95% CI- Confidence Interval, IL- interleukin, p- level of significance, Rho- Spearman's correlation coefficient.
(TIF)
S3 Fig. Correlation between serum CRP levels (mg/L) and IL-6 concentrations (pg/mL) in 147 patients with ALD.Rank correlation test. A logarithmic transformation was used for both variables. ALD- alcoholic liver disease, 95% CI- Confidence Interval, CRP- C-reactive protein, IL- interleukin, p- level of significance, Rho- Spearman's correlation coefficient.
(TIF)
Author Contributions
Conceived and designed the experiments: BKS. Performed the experiments: BKS AS AZ SM MS. Analyzed the data: BKS KC JR. Contributed reagents/materials/analysis tools: AS SM MS. Wrote the paper: BKS AZ MS. Supervised the study: BKS KC JR.
References
1. World Health Organisation. Global Status Raport on Alcohol and Health 2011. Geneva, Switzerland: World Health Organisation, 2011.
2. Paula H, Asrani SK, Boetticher NC, Pedersen R, Shah VH, Kim WR. Alcoholic liver disease-related mortality in the United States: 1980–2003 Am J Gastroenterol. 2010, 105(8):1782–7. doi:10.1038/ajg. 2010.46PMID:20179691
4. Ward RJ, Lallemand F, de Witte P. Influence of adolescent heavy session drinking on the systemic and brain innate immune system. Alcohol Alcohol 2014; 49(2):193–7. doi:10.1093/alcalc/agu002PMID: 24532587
5. Szabo G, Mandrekar P, Petrasek J, Catalano D. The unfolding web of innate immune dysregulation in alcoholic liver injury. Alcohol Clin Exp Res. 2011; 35(5):782–6. doi:10.1111/j.1530-0277.2010.01398.x PMID:21284666
6. Szabo G, Petrasek J, Bala S. Innate immunity and alcoholic liver disease. Dig Dis. 2012; 30 Suppl 1:55–60. doi:10.1159/000341126PMID:23075869
7. Szabo G, Mandrekar P. A recent perspective on alcohol, immunity, and host defense. Alcohol Clin Exp Res 2009; 33(2):220–232. doi:10.1111/j.1530-0277.2008.00842.xPMID:19053973
8. Viitala K, Makkonen K, Israel Y, Lehtimäki T, Jaakkola O, Koivula T et al. Autoimmune responses against oxidant stress and acetaldehyde-derived epitopes in human alcohol consumers. Alcohol Clin Exp Res. 2000; 24(7):1103–9. PMID:10924016
9. Li J, Qiu SJ, She WM, Wang FP, Gao H, Li L et al. Significance of the balance between regulatory T (Treg) and T helper 17 (Th17) cells during hepatitis B virus related liver fibrosis. PLoS One. 2012; 7(6): e39307. doi:10.1371/journal.pone.0039307PMID:22745730
10. Liu LL, Qin Y, Cai JF, Wang HY, Tao JL, Li H et al. Th17/Treg imbalance in adult patients with minimal change nephrotic syndrome. Clin Immunol. 2011; 139(3):314–20. doi:10.1016/j.clim.2011.02.018 PMID:21450528
11. Wang W, Shao S, Jiao Z, Guo M, Xu H, Wang S. The Th17/Treg imbalance and cytokine environment in peripheral blood of patients with rheumatoid arthritis. Rheumatol Int. 2012; 32(4):887–93. doi:10. 1007/s00296-010-1710-0PMID:21221592
12. Zhao L, Yang J, Wang HP, Liu RY. Imbalance in the Th17/Treg and cytokine environment in peripheral blood of patients with adenocarcinoma and squamous cell carcinoma. Med Oncol. 2013; 30(1):461. doi:10.1007/s12032-013-0461-7PMID:23335103
13. Korn T, Bettelli E, Oukka M, Kuchroo VK. IL-17 and Th17 Cells. Annu Rev Immunol. 2009; 27:485–517. doi:10.1146/annurev.immunol.021908.132710PMID:19132915
14. Corthay A. How do Regulatory T Cells Work? Scand J Immunol. 2009 Oct; 70(4): 326–336. doi:10. 1111/j.1365-3083.2009.02308.xPMID:19751267
15. Bettelli E, Carrier Y, Gao W, Korn T, Strom TB, Oukka M et al. Reciprocal developmental pathways for the generation of pathogenic effector TH17 and regulatory T cells. Nature. 2006; 441(7090):235–8. PMID:16648838
16. Piccioni M, Chen Z, Tsun A, Li B. Regulatory T-cell differentiation and their function in immune regula-tion. Adv Exp Med Biol. 2014; 841:67–97. doi:10.1007/978-94-017-9487-9_4PMID:25261205 17. Song X, Gao H, Qian Y. Th17 differentiation and their pro-inflammation function. Adv Exp Med Biol.
2014; 841:99–151. doi:10.1007/978-94-017-9487-9_5PMID:25261206
18. Durazzo M, Belci P, Collo A, Prandi V, Pistone E, Martorana M et al. Gender specific medicine in liver diseases: a point of view. World J Gastroenterol. 2014; 20(9):2127–35. doi:10.3748/wjg.v20.i9.2127 PMID:24605011
19. Kovacs EJ, Messingham KA. Influence of alcohol and gender on immune response. Alcohol Res Health. 2002; 26(4):257–63. PMID:12875035
20. Kasztelan-Szczerbinska B, Surdacka A, Slomka M, Rolinski J, Celinski K, Smolen A et al. Association of serum adiponectin, leptin, and resistin concentrations with the severity of liver dysfunction and the disease complications in alcoholic liver disease. Mediators Inflamm. 2013; 2013:148526. doi:10.1155/ 2013/148526PMID:24259947
21. Babor TF, Higgins-Biddle JC, Saunders JB, Monteiro MG. AUDIT The Alcohol Use Disorders. Identifi-cation Test Guidelines for Use in Primary Care. 2nd ed. World Health Organisation. Geneva, 2001. 22. Pugh RN, Murray-Lyon IM, Dawson JL, Pietroni MC, Williams R. Transection of the oesophagus for
bleeding oesophageal varices. Br J Surg 1973; 60: 649–9. PMID:4541914
23. Kamath PS, Kim WR. The model for end-stage liver disease (MELD). Hepatology. 2007; 45(3):797– 805. PMID:17326206
24. Ferenci P, Lockwood A, Mullen K, Tarter R, Weissenborn K, Blei AT. Hepatic encephalopathy— defini-tion, nomenclature, diagnosis, and quantification: final report of the working party at the 11th World Congresses of Gastroenterology, Vienna, 1998. Hepatology, 2002, 35 (3): 716–21. PMID:11870389 25. DeLong ER, DeLong DM, Clarke-Pearson DL. Comparing the areas under two or more correlated
26. Schisterman EF, Perkins NJ, Liu A, Bondell H. Optimal cut-point and its corresponding Youden index to discriminate individuals using pooled blood samples. Epidemiology 2005; 16(1):73–81. PMID: 15613948
27. Nolen-Hoeksema S. Gender differences in risk factors and consequences for alcohol use and prob-lems. Clin Psychol Rev. 2004; 24(8):981–1010. PMID:15533281
28. Dettling A, Fischer F, Böhler S, Ulrichs F, Skopp G, Graw M et al. Ethanol elimination rates in men and women in consideration of the calculated liver weight. Alcohol. 2007; 41(6):415–20. PMID:17936510 29. Eagon PK. Alcoholic liver injury: influence of gender and hormones. World J Gastroenterol. 2010; 16
(11):1377–84. PMID:20238405
30. Farcomeni A, Ventura L. An overview of robust methods in medical research. Stat Methods Med Res, 2012; 21(2):111–33. doi:10.1177/0962280210385865PMID:20974666
31. Qin G, Hotilovac L. Comparison of non-parametric confidence intervals for the area under the ROC curve of a continuous-scale diagnostic test. Stat Methods Med Res. 2008; 17(2): 207–21. doi:10.1177/ 0962280207087173PMID:18426855
32. McClain CJ, Barve S, Barve S, Deaciuc I, Hill DB. Tumor necrosis factor and alcoholic liver disease. Alcohol Clin Exp Res. 1998; 22(5 Suppl):248S–252S. PMID:9727645
33. Lemmers A, Moreno C, Gustot T, Maréchal R, Degré D, Demetter P et al. The interleukin-17 pathway is involved in human alcoholic liver disease. Hepatology. 2009; 49(2):646–57. doi:10.1002/hep.22680 PMID:19177575
34. Wang L, Chen S, Xu K. IL-17 expression is correlated with hepatitis B-related liver diseases and fibro-sis. Int J Mol Med. 2011; 27(3):385–92. doi:10.3892/ijmm.2011.594PMID:21225222
35. Chang Q, Wang YK, Zhao Q, Wang CZ, Hu YZ, Wu BY. Th17 cells are increased with severity of liver inflammation in patients with chronic hepatitis C. J Gastroenterol Hepatol. 2012; 27(2):273–8. doi:10. 1111/j.1440-1746.2011.06782.xPMID:21592230
36. Yang CY, Ma X, Tsuneyama K, Huang S, Takahashi T, Chalasani NP et al. IL-12/Th1 and IL-23/Th17 biliary microenvironment in primary biliary cirrhosis: implications for therapy. Hepatology. 2014; 59 (5):1944–53. doi:10.1002/hep.26979PMID:24375552
37. Støy S, Sandahl TD, Dige AK, Agnholt J, Rasmussen TK, Grønbæk H et al. Highest frequencies of interleukin-22-producing T helper cells in alcoholic hepatitis patients with a favourable short-term course. PLoS One. 2013; 8(1):55101.
38. Xing Q, Wang B, Su H, Cui J, Li J. Elevated Th17 cells are accompanied by FoxP3+ Treg cells decrease in patients with lupus nephritis. Rheumatol Int. 2012; 32(4):949–58. doi: 10.1007/s00296-010-1771-0PMID:21243492
39. Rollnik JD, Sindern E, Schweppe C, Malin JP. Biologically active TGF-beta1 is increased in cerebrospi-nal fluid while it is reduced in serum in multiple sclerosis patients. Acta Neurol Scand. 1997; 96(2):101– 5. PMID:9272186
40. Prud'homme GJ, Piccirillo CA. The inhibitory effects of transforming growth factor-beta-1 (TGF-beta1) in autoimmune diseases. J Autoimmun. 2000; 14(1):23–42. PMID:10648114
41. Leise MD, Kim WR, Kremers WK, Larson JJ, Benson JT, Therneau TM. A revised model for end-stage liver disease optimizes prediction of mortality among patients awaiting liver transplantation. Gastroen-terology. 2011; 140(7):1952–60. doi:10.1053/j.gastro.2011.02.017PMID:21334338
42. Lim YS, Larson TS, Benson JT, Kamath PS, Kremers WK, Therneau TM et al. Serum sodium, renal function, and survival of patients with end-stage liver disease. J Hepatol. 2010; 52(4):523–8. doi:10. 1016/j.jhep.2010.01.009PMID:20185195
43. Sheron N, Bird G, Goka J, Alexander G, Williams R. Elevated plasma interleukin-6 and increased severity and mortality in alcoholic hepatitis. Clin Exp Immunol. 1991; 84(3):449–53. PMID:2044224 44. Zhang X, Tachibana S, Wang H, Hisada M, Williams GM, Gao B et al. Interleukin-6 is an important
mediator for mitochondrial DNA repair after alcoholic liver injury in mice. Hepatology. 2010; 52:2137– 47. doi:10.1002/hep.23909PMID:20931558
45. El-Assal O, Hong F, Kim WH, Radaeva S, Gao B. IL-6-deficient mice are susceptible to ethanol-induced hepatic steatosis: IL-6 protects against ethanol-ethanol-induced oxidative stress and mitochondrial per-meability transition in the liver. Cell Mol Immunol. 2004; 1:205–11. PMID:16219169
46. Miller AM, Horiguchi N, Jeong WI, Radaeva S, Gao B. Molecular mechanisms of alcoholic liver disease: innate immunity and cytokines. Alcohol Clin Exp Res. 2011; 35(5):787–93. doi:10.1111/j.1530-0277. 2010.01399.xPMID:21284667
48. Tilg H, Jalan R, Kaser A, Davies NA, Offner FA, Hodges SJ et al. Anti-tumor necrosis factor-alpha monoclonal antibody therapy in severe alcoholic hepatitis. J Hepatol. 2003; 38(4):419–25. PMID: 12663232
49. Naveau S, Chollet-Martin S, Dharancy S, Mathurin P, Jouet P, Piquet MA et al. A double-blind random-ized controlled trial of infliximab associated with prednisolone in acute alcoholic hepatitis. Hepatology 2004; 39:1390–7. PMID:15122768
50. Ma X, Hua J, Mohamood AR, Hamad ARA, Ravi R, Li Z. A high-fat diet and regulatory T cells influence susceptibility to endotoxin-induced liver injury. Hepatology. 2007; 46(5):1519–29. PMID:17661402 51. Sun XF, Gu L, Deng WS, Xu Q. Impaired balance of T helper 17/T regulatory cells in carbon
tetrachlo-ride-induced liver fibrosis in mice. World J Gastroenterol. 2014; 28;20(8):2062–70. doi:10.3748/wjg. v20.i8.2062PMID:24616573
52. Alunno A, Bartoloni E, Bistoni O, Nocentini G, Ronchetti S, Caterbi S et al. Balance between regulatory T and Th17 cells in systemic lupus erythematosus: the old and the new. Clin Dev Immunol. 2012; 2012:823085. doi:10.1155/2012/823085PMID:22761634
53. Huang H, Lu Z, Jiang C, Liu J, Wang Y, Xu Z. Imbalance between Th17 and regulatory T-Cells in sar-coidosis. Int J Mol Sci. 2013; 14(11):21463–73. doi:10.3390/ijms141121463PMID:24177566 54. Li Q, Li Q, Chen J, Liu Y, Zhao X, Tan B et al. Prevalence of Th17 and Treg cells in gastric cancer
patients and its correlation with clinical parameters. Oncol Rep. 2013; 30(3):1215–22. doi:10.3892/or. 2013.2570PMID:23807713
55. Ashley MJ, Olin JS, Le Riche WH, Kornaczewski A, Schmidt W, Rankin JG. Morbidity in alcoholics: evi-dence for accelerated development of physical disease in women. Arch Intern Med. 1977; 137:883–7. PMID:879927
56. Loft S, Olesen K, Dossing M. Increased susceptibility to liver disease in relation to alcohol consumption in women. Scand J Gastroenterol. 1987; 22:1251–6. PMID:3433014
57. Zakhari S., Li T.-K. Determinants of alcohol use and abuse: Impact of quantity and frequency patterns on liver disease. Hepatology, 2007, 46: 2032–9. PMID:18046720
58. Li TK, Yin SJ, Crabb DW, O'Connor S, Ramchandani VA. Genetic and environmental influences on alcohol metabolism in humans. Alcohol Clin Exp Res 2001; 25: 136–44. PMID:11198709
59. Müller C. Liver, alcohol and gender. Wiener Medizinische Wochenschrift, 2006, 156(19–20), 523–6. 60. Rehm J, Taylor B, Mohapatra S, Irving H, Baliunas D, Patra J et al. Alcohol as a risk factor for liver
cir-rhosis: A systematic review and meta-analysis. Drug and alcohol review, 2010, 29(4), 437–45. doi:10. 1111/j.1465-3362.2009.00153.xPMID:20636661
61. Ali AK, Jones JS, Bradley MP, Bhala N, Rahman A, Peck RJ et al. Familial predisposition to alcoholic liver disease: a case-control study. Eur J Gastroenterol Hepatol. 2012; 24(7):798–804. doi:10.1097/ MEG.0b013e328353a367PMID:22562113
62. Gleeson D, Jones JS, McFarlane E, Francis R, Gellion C, Bradley MP et al. Severity of alcohol depen-dence in decompensated alcoholic liver disease: comparison with heavy drinkers without liver disease and relationship to family drinking history. Alcohol Alcohol. 2009; 44(4):392–7. doi:10.1093/alcalc/ agp008PMID:19286679
63. Kerr WC, Stockwell T. Understanding standard drinks and drinking guidelines. Drug Alcohol Rev 2012; 31(2):200–5. doi:10.1111/j.1465-3362.2011.00374.xPMID:22050262