COMBINATION OF MACROSCOPIC AND MICROSCOPIC
TRANSPORT SIMULATION MODELS: USE CASE IN CYPRUS
Evangelos Mitsakis1, Georgia Aifadopoulou2, Josep Maria Salanova Grau3,Evangelia Chrysohoou4, Maria Morfoulaki5
1, 2, 3, 4, 5 Hellenic Institute of Transport (CERTH/HIT), Greece
Received 23 July 2012; accepted 14 May 2014
Abstract: The present paper presents the transportation planning methodology applied in the city of Nicosia, Cyprus, within the framework of Nicosia’s “Integrated Mobility Master Plan”. Unique characteristics of the capital of Cyprus, such as the sparse coverage, low service quality and even lower market penetration of the public transport network, the inadequate parking policy applied and the car-centred mobility culture of the local citizens have provided the motivation for a “redesign” of the classic four-step transport modelling process by combining static and dynamic, macroscopic and microscopic transportation analysis models, in order to support the city’s decision makers.
Keywords: transportation modelling, traffic forecasting, modal share estimation, combined macro- and microscopic simulation.
1. Introduction
During the last decades the transportation policy in Cyprus has focused on private cars, which resulted to both increased car ownership and use. The travel demand has increased due to this fact, generating higher congestion levels, delays, pollution and road safety problems, which resulted to even more needs for car oriented policies and infrastructures and also to a significantly reduced modal split for all other modes of transport. However, the current environmentally-friendly and sustainability-oriented policy frameworks have a clear focus on the promotion of sustainable mobility in modern cities (Mitsakis et al., 2013; Morfoulaki et al., 2011), as is also the case of Nicosia.
The objective of this paper is to present a novel methodology combining the use of macroscopic network modelling and
the impacts of various interventions and mobility scenarios in the road network of the city of Nicosia, Cyprus. Strategic macroscopic models have lower data requirements but provide less detailed results. Oppositely, microscopic models can provide very detailed results, but with a higher demand in terms of data requirements and resolution. Previous studies (Barcelo et al., 2003; Barcelo et al., 2006; Montero et al., 2001; Montero et al., 2004) have analysed the synergies between macroscopic and microscopic models in urban networks, however aiming at detailed analyses of subnetworks and not at complementing each other. The methodology presented herein extends these existing concepts, by proposing the combined use of macroscopic (static) and microscopic (dynamic) modelling tools.
proposed methodolog y, together w ith results, followed by Section 4, which provides conclusions and summarizes the main components of the proposed methodology, as well as the transferability potentials to other similar studies.
2. Study Area Description
2.1. Definitions
The study area is the Greater Nicosia Area, with a population of 244000 inhabitants
(192.000 of which are the active population). The reference year is 2010 and the horizon year is 2020.
The transport modes examined are auto (car) and transit (bus and tram). Population for the horizon year is 280.000 (of which 221000 are the active population), with a 1.4% annual growth rate. Fig. 1 depicts the population distribution in the study area with the distribution of the actual population in red (right side) and the distribution of the actual sample used with blue colour (left side).
Fig. 1.
Sample and Population Distribution Maps of the Study Area
The definition of the number and size of the traffic analysis zones comprises a significant step in the model development process. The use of large sized zones simplifies statistical data recompilation and the necessar y surveys. However, results of the traffic assignment step have a lower accuracy. On the one hand, zone internal trips are not taken into account and are practically lost (larger zones imply larger numbers of zone internal trips); on the other hand, accuracy of assignment is lower when using larger zones, due to the reduced number and simplicity of origins and destinations. For the purposes of the study, 37 traffic analysis zones have been
defined, five of which represent external zones for the inclusion of trips produced or attracted outside of the study area.
2.2. Data Issues
The data used for the demand side of the modelling activities have been mainly collected through a phone survey with a sample of 5.007 citizens. Data collected includes mainly travel characteristics, with particular focus on primary data for:
• estimation of the peak time periods, • col lec t ion of soc io-demog raph ic
characteristics,
• identification of the traffic analysis zones with the highest production and attraction rates,
• stated preference based estimation of public transport use and identification of the significant factors affecting its use.
Data sets for the supply side included the digital representation of the road network with the use of a hierarchical road network system, the intersections of the network and also centroids and connectors. These have been combined in a geo-referenced spatially enabled database. The network for the 2010
reference year has been comprised by 3394 road sections (links), 1196 intersections (nodes), 37 centroids and 350 connectors, while the 2020 horizon network included 3582 link s, 1239 nodes and the same number of centroids and connectors as in the reference year.
2.3. Transport Planning in Nicosia
The Nicosia Master Plan began in 1979 under the umbrella of the United Nations Development Program (UNDP) and has been applied and updated during the last 30 years. The characteristics of the most significant transport studies executed in Nicosia are briefly presented in Table 1.
Table 1
Transport Studies Executed in Nicosia before the IMMP
1982-1985 2001 2001 2003 2004 2005 2006
Study Area
Greater Nicosia Urban Area
Wider Nicosia Area
Nicosia Municipality
Model
Motorway traffic
Urban traffic
Public Transport
Parking
3. Methodology and Application
Fig. 2 provides a schematic representation of the proposed methodology, its components and the steps followed.
The combination of macroscopic and microscopic models has been used for
Fig. 2.
Methodology for Combining Macro and Micro Models
3.1. Trip Generation
The calculation of trip generation has been based on population and employment census data of each zone, which are significantly related to trip productions and attractions respectively.
This relation can be obtained by means of simple linear regressions, which usually provide acceptable goodness-of-fit for the trips production.
The fit of the trips attraction is usually lower, due to the variability of the number of attracted trips per employee, highly depending on the type of job, which on the one side cannot be obtained from the survey, and on the other side was not included in the
census data used in the study. Therefore, the trip distribution is corrected based on the production model.
3.1.1. Productions
Active population of each zone produces most of the trips and productions are mainly calculated as trips of residents. These have been concluded from the results of the phone survey, which in addition showed that most of the trips are home-based and that each “active” citizen produces in average 2.4 trips on a daily basis.
Fig. 3.
Linear Regression of the Production Model
3.1.2. Attractions
Active population working in each zone produces the majority of the trips. A n attraction model has been developed based
on the attractions of each zone correlated to the number of employees per zone. Fig. 4 shows the goodness-of-fit of the survey data for the attraction model using employment as the independent variable.
Fig. 4.
As expected, the goodness-of-fit of the attraction model is lower compared to the production model. For this reason, the production model results have been used to correct the attraction model results.
Production and attraction models of 2010 have been used for calculating the 2020 forecasts, based on the forecasts of the population, the employment increase indices and the mobility ratio increase, using statistical data and forecasts of the Statistics Bureau of Cyprus. Mobility ratio has been forecasted as 2.7 for the year 2020 (2.4 in the year 2010), based on the economic growth indices of the Statistics Bureau; population and employment growth have been respectively forecasted as 1.5 and 2.2% annually by the Statistics Bureau.
3.2. Trip Distribution Modelling in Nicosia
For the year 2010, Origin-Destination matrices have been estimated, based on the results of the phone survey and extrapolated to the entire population of the study area. The 2010 O-D matrix, together with the attraction-production models of 2010, have provided the necessary input for the estimation of the parameters of a
gravity model, which has been used for the trip distribution of the year 2020. This resulted to a balanced O-D matrix for the year 2020. The gravity model used for the trip distribution is presented below (Eq. (1)):
(1)
Where,
is the total number of trips between zone i and j,
is the total number of trip productions of zone i,
is the total number of trips attractions of zone i,
a, b, c are the calibration parameters,
is the impedance function between zone i and zone j (distance).
The number of trips per OD pair obtained by the calibrated gravity model has been corrected with the trip productions of each zone. The comparison between the corrected number of trips and the number of trips obtained by the gravity model per OD pair is presented below (Fig. 5).
Fig. 5.
In relation to the time distribution of trips, results obtained by the survey in Nicosia showed three directed peak periods, as shown in Fig. 6. One peak period exists in the morning, generated by most of the people going to their working places in the city centre, while two peak periods exist in the afternoon,
generated by most of the people returning from their working places in the city centre during two different time periods. This time distribution has also been used in defining the peak times for the static traffic assignment model and the 24 hourly OD matrices for the dynamic traffic assignment model.
Fig. 6.
Daily Trips Distribution over Time with Survey Data
Data obtained from the telephone survey has been used for both spatial and temporal distribution of trips. Fig. 7 shows the results
of the traffic counts from and to the city center, which confirms the hypothesis done about the three peaks.
Fig. 7.
3.3. Modal Split Estimation
The development of modal split models assumes the existence of a proposed public transport system design that can provide both fare and travel time estimations. While data collected from the citizens is very important and indicates a clear opportunity to deploy an extensive public transport mode, it is not clear how it can be used to estimate a mode choice model, since the interviewees were not provided with a clear picture of what the public transport mode might look like. In other words, the citizens of Nicosia have practically no previous experience with public transport systems and they had no concept of what the structure of the proposed system would look like. Therefore, the stated preference reported above can be considered as over-optimistic, due to the fact that a more reliable mode choice model cannot be developed based on these data. At best, a model such as the one explained above can only be suggested based on international experience and a limited use of the survey data.
The results of the survey have shown that almost all citizens of Nicosia use their car for their daily movements (the mode share of car is 99.4%). Public Transport is not a clear concept for the citizens of Nicosia, making the calculation of the modal split difficult. From the survey it was clear that:
• An insignificant number of people currently use buses, which means that no revealed preference data can be obtained;
• In terms of quality of ser vice, the majority of the citizens (over 60% for all municipalities) stated that waiting time would be a major qualitative attribute of the system;
• Cost does not seem to be an important issue, as out-of-pocket costs in the order of one Euro for one public transport ticket appear to be acceptable.
3.3.1. Model Choice
Several modal split models have been developed and proposed in the literature over the last 40 years. They are divided in aggregate and disaggregate models, with methods ranging from regression, econometric discrete choice models to diversion curves.
A typical approach is that of econometric i n d i v i d u a l d i s c r e t e c h o i c e m o d e l s (McFadden, 1974). This approach relies on a logit type model, where log ratio of the probability of choosing a mode to the probability of not choosing a mode is given by the relationship (Eq. (2)):
(2)
Where v(xi) is the utility of choosing mode i. This utility typically takes the following expression (Eq. (3)):
(3)
Where,
Pi is the probability of choosing mode i, PA being the probability of choosing auto and PT the probability of choosing transit,
cA, cT are the costs of auto and transit,
tA, tT are the travel times of auto and transit,
I is the income,
The model can be mathematically translated to its most widely used form (Eq. (4)):
(4) Regarding the estimation of υ(xi), data on revealed preference of choices must be available in order to estimate the probabilities of choices, which range from zero to one. Spear (1977) proposes the following utility functions, which are commonly accepted and have been used for the modal split model of Nicosia (Eq. (5)):
(5)
Where,
XI is the adjusted income of the users per zone,
XDX is the difference in access time between auto and transit including parking, access, waiting and walking time,
XDT is the difference in in-vehicle travel time between auto and transit mode (travel time by auto – travel time by bus),
XDC is the cost difference between the auto and transit modes (cost of auto – cost of a bus).
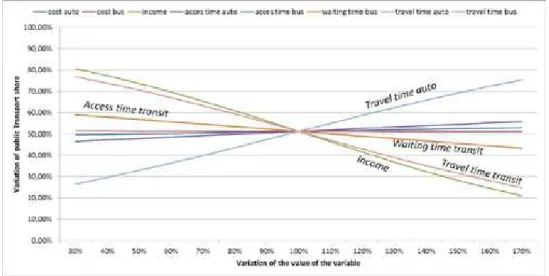
Fig. 8 shows t he i mpor tance of each parameter, depicting the sensitivity of the model. Income and travel time are the most important parameters, followed by access time to transit and waiting time for transit, while the trip cost has low significance for the model.
Fig. 8.
Sensitivity Analysis of Modal Split Model Parameters
Fig. 9 shows the survey results for the factors affecting the choice of a public transport mode. One may conclude that the citizens
Fig. 9.
Survey Results for Important Factors Affecting the Use of Public Transport
3.4. Traffic Assignment (Route Choice)
A two-level traffic assignment model has been developed and used for the purposes of the study: A Static traffic assignment in the first level and a Dynamic traffic assignment model in the second level.
3.4.1. Static Traffic Assignment Model
The initial traffic assignment model used in the study has been based on VISUM (PTV, 2010), using primarily static traffic assignment algorithms. Static refers to the nature of algorithms and underlying assumptions used by this specific model, in terms of the way that route choices are calculated.
The supply side of the model has been fed with datasets comprised by the existing road network (links and nodes with respective information related to the free flow speed, capacity, effective capacity, length, link hierarchy, turn restrictions and other operational characteristics), traffic analysis zones, connectors and the public transport system related characteristics (lines, line routes, stops, stop areas, and timetables).
The demand side of the model included datasets for the Origin-Destination matrices of the morning peak period and of a typical twenty-four hour period.
In terms of scenarios and forecasts, an initial model has been created for the year 2010, which served as the base case scenario. The base case scenario has been validated with actual traffic counts at specific locations of the study area, which took place during the initial phase of the study period. The validation process resulted to a model which could represent the actual traffic characteristics of the Nicosia network and on which future proposals and scenarios could be developed, assessed and evaluated. The outputs of the static models - developed w ith V ISU M - included system-w ide characteristics, such as total vehicle-kilometres travelled and total vehicle-hours and also link-specific characteristics, such as traffic volumes, travel times and volume-to-capacity ratios.
Each scenario has been evaluated in terms of modal split (presenting values from 10.4% to 13.2%). The preferred scenario (based on public transport share, car travel times and congestion levels) has been chosen for the detailed analysis with the dynamic traffic assignment based VISTA model.
3.4.2. Dynamic Traffic Assignment (DTA)
Model
A DTA model has then been developed, based on the finally selected proposal of the study. VISTA (Ziliaskopoulos and Waller, 2000), the simulation model used for this purpose, had as input the supply and the demand data mentioned previously and provided useful insights of traffic related dynamics, in a more detailed way and by taking into account the dynamic spatiotemporal characteristics of each individual vehicle with the use of time-dependent shortest paths for the final route choice of the users.
A dynamic O-D matrix has been estimated at 15-minute time intervals for the morning peak period from 7:15 to 9:45AM, where the first and last 15 minutes were used as a warm up and cooling time intervals, due to the traffic simulator used within VISTA. The dynamic O-D matrix has been based on representative 15-minute traffic count profiles, collected at various intersections throughout the city.
VISTA produces Dynamic User equilibrium time-dependent shortest paths and the associated 15-minute traffic volumes. A selected set of 15-minute traffic volumes - covering the main downtown cordon of Nicosia - from VISTA were imported into the SYNCHRO operational analysis software (Husch and Albeck, 2003). SYNCHRO is
and microscopic traffic simulation model. SYNCHRO follows the Highway Capacity Manua l procedures (TR B, 20 0 0) for conducting operational analysis and Level Of Service (LOS).
The added value of the results obtained by the DTA model is related to traffic operational issues such as delays, queues or travel time variability, which have a significant role for the decision makers responsible for the transport planning of the city. VISTA has provided travel time variability and delays at network level, while SYNCHRO has provided detailed results for delays, queues and queue lengths, average speed and LOS for the selected arterials and intersections. More details on the combined use of traffic assignment and traffic control models can be found in Mitsakis et al. (2011).
4. Conclusions
ARMOS, 2010a and 2010b). The model’s main characteristics presented in this paper include:
• A new hourly Origin-Destination matrix, based on a telephone survey. Overall, 37 traffic zones have been defined.
• A modal split model, adapted to the conditions of Cyprus.
• A static traffic assignment model. V I S U M h a s b e e n u s e d f o r t h e development of the base-case scenario and for its validation with the use of the actual available traffic counts. This model has also been used for the intermediate stages of creating and assessing various scenarios, until the selection of the preferred one. These activities have resulted to the calculation of network-wide traffic characteristics for several variations of both the road and the public transport network, such as total travel times, delays and volume-to-capacity ratios. This model can be used for further refinements of the proposed measures and for the analysis and assessment of new measures in the future.
• A dynamic traffic assignment model has been developed, based on VISTA. This model converged to a Dynamic User Equilibrium. Time-dependent shortest paths for each O-D pair and the associated 15-minute traffic volumes at road section and intersection level have been computed. VISTA produced also the corresponding O-D path travel times for selected O-D pairs and bus routes operating on the network.
• SYNCHRO, an operational analysis microscopic traffic simulation model has produced the main Measures of Performance (MoPs) at intersection
level. SYNCHRO has also produced the corresponding Level of Service at the movement, approach and arterial level.
T h e a p p l i c a t i o n o f t h e p r o p o s e d methodology in the context of the IMMP study has significantly contributed to gaining insights about traffic patterns of the citizens of Nicosia. The most important ones are summarized below:
• Each active citizen generates 2.4 daily trips.
• Each employee attracts more than 2.5 citizens per day in average.
• The temporal distribution of trips has a high concentration in the morning, while the afternoon peak is split into two lower peaks, which can be related to the public and the private workers. • There is a clear pattern showing that
most trips are attracted in the city center during the morning.
• Private car is the dominating transport mode, representing more than the 99% of the modal split.
Finally, the methodology presented in this paper can easily be adopted by research or study teams for related mobility master plans in other cities.
References
Barcelo, J.; Casas, J.; Garcia, D.; Perarnau, J. 2006. A methodological approach combining macro, meso and micro models for transportation analysis. In Proceedings of
the 13th World Conference on ITS, 2006 London, England,
paper 2290.
Barcelo, J.; Codina, E.; Garcia, D. 2003. Scenario Analysis System: a software platform combining micro and macro approaches for transportation analysis. Available from Internet: <http://www.inrosoftware.com/en/pres_pap/ european/eeug02/EMME2_EUSG.pdf>.
DENCO, CERTH/HIT, CTL, POLYTIA ARMOS. 2009a. Integrated Mobility Master Plan. Interim Report 1.
DENCO, CERTH/HIT, CTL, POLYTIA ARMOS. 2009b. Integrated Mobility Master Plan. Interim Report 2. Formulation and evaluation of alternative scenarios.
DENCO, CERTH/HIT, CTL, POLYTIA ARMOS. 2010a. Integrated Mobility Master Plan. Interim Report 3. Selection and development of the preferred traffic plan alternative.
DENCO, CERTH/HIT, CTL, POLYTIA ARMOS. 2010b. Integrated Mobility Master Plan. Final Report. Available from Internet: <http://www.inro.ca/en/ pres_pap/international/ieug98/octet_stream7.pdf>.
Husch, D.; Albeck, J. 2003. Synchro 6, Traffic Signal Software – User Guide.
McFadden, L.D. 1974. The Measurement of Urban Travel Demand, Journal of Public Economics. DOI: http://dx.doi.org/10.1016/0047-2727(74)90003-6, 3(4): 303-328.
Mitsak is, E.; Giannopoulos, G.; Salanova, J.M. 2011. Combined Dynamic Traffic Assignment and Urban Traffic Control models, Procedia - Social and
Behavioral Sciences. DOI: http://dx.doi.org/10.1016/j.
sbspro.2011.08.049, 20(2011): 427-436.
Mitsakis, E.; Stamos, I.; Salanova, J.M.; Chrysohoou, E.; Aifadopoulou, G. 2013. Urban Mobility Indicators for Thessaloniki, Journal of Traffic and Logistics Engineering. DOI: http://dx.doi.org/10.12720/jtle.1.2.148-152, 1(2): 148-152.
Montero, L.; Codina, E.; Barcelo, J.; Barcelo, P. 2001. Combining macroscopic and microscopic approaches for transportation planning and design of road networks,
Transportation Research C, 9(2001): 213-230.
Montero, L.; Codina, E.; Barcelo, J.; Barcelo, P. 2004. Combining macroscopic and microscopic approaches for transportation planning. Available from Internet: <http://www.inro.ca/en/pres_ pap/international/ ieug98/octet_stream7.pdf>.
Morfoulaki, M.; Mitsakis, E.; Chrysostomou, K.; Stamos, I. 2011. The contribution of urban mobility management to trip planning and the environmental upgrade of urban areas, Procedia - Social and Behavioral
Sciences. DOI: http://dx.doi.org/10.1016/j.
PTV. 2010. VISUM PTV Software. Available from Internet: <http://www.ptvag.com>.
Spear, B.D. 1977. Applications of new travel demand forecasting techniques to transportation planning. A study of individual Choice Models. U.S. Department of Transportation. Federal Highway Administration, Urban Planning Division.
Transportation Research Board. 2000. Highway Capacity Manual.
Ziliaskopoulos, A.K.; Waller, S.T. 2000. An Internet-based geographic information system that integrates data, models and users for transportation applications,
Transportation Research Part C: Emerging Technologies. DOI: