Istituto Zooprofilattico Sperimentale dell’Abruzzo e del Molise ‘G. Caporale’, Via Campo Boario, 64100 Teramo, Italy [email protected]
Development
and
evaluation
of
diagnostic
tests
for
the
serological
diagnosis
of
brucellosis
in
swine
Tiziana
Di
Febo,
Mirella
Luciani,
Ottavio
Portanti,
Barbara
Bonfini,
Rossella
Lelli
&
Manuela
Tittarelli
Summary
A competitive enzyme‐linked immunosorbent assay (c‐ELISA), an indirect ELISA (i‐ELISA) and a dissociation‐enhanced lanthanide fluorescence immunoassay (DELFIA) were developed to test for antibodies to Brucella suis in pig and wild boar sera. An anti‐Brucella‐LPS monoclonal antibody (MAb 4B5A) (c‐ELISA and DELFIA) and an anti‐swine IgG monoclonal antibody (MAb 10C2G5) (i‐ELISA) were used for the three assays. The specificity (Sp) and sensitivity (Se) of the assays gave the following results: Se and Sp = 100% at a cut‐off value of 61.0% (B/B0%) for c‐ELISA; Sp = 99.1%
and Se = 100% at a cut‐off value of 21.7% (percentage positivity: PP%) for i‐ELISA; Sp = 91.0% and Se = 75% at a cut‐off value of 37.0% (B/B0%) for DELFIA. In addition, the
performance of a commercial fluorescence polarisation assay (FPA), standardised for bovine sera, was evaluated in swine sera. The specificity and sensitivity obtained were both 100% at a cut‐off value of 99.5 (millipolarisation unit values). These results suggest that the combination of c‐ELISA, i‐ELISA and FPA can be used to improve the serological diagnosis of swine brucellosis.
Keywords
Brucellosis, DELFIA, Diagnosis, Dissociation‐ enhanced lanthanide fluorescence immuno‐ assay, Enzyme‐linked immunosorbent assay, ELISA, Fluorescence polarisation assay, FPA, Monoclonal antibody, Serology, Swine.
Introduction
Brucella suis is a Gram‐negative, facultative intracellular bacterium that is responsible for brucellosis in humans and animals. Brucellosis in animals has a major economic impact
because the infection causes abortions,
stillbirths and reduces fertility in herds, while brucellosis in humans is a debilitating disease characterised by fever, sweating and pain. The mortality rate of the disease in humans is estimated at approximately 5% of cases, due to complications (16, 36). Five B. suis biovars have been identified to date, namely: biovars 1, 2 and 3 that are present in pigs and wild boar; European hares (Lepus europaeus) are also a reservoir for biovar 2. Biovar 4 mainly infects reindeer and caribou, and is not usually isolated in swine. Biovar 5 is mainly present in rodents (3, 41). A presumptive diagnosis of
brucellosis can be made by microscopic
examination of smears stained using the Ziehl‐
Neelsen method, as modified by Stamp.
However, in swine, serological methods are usually considered to be the most reliable method of identifying infected animals.
Serological diagnosis of swine brucellosis is based on the same tests that have been developed for bovine brucellosis and uses
competitive or indirect enzyme‐linked
and able to detect cross‐reactions with other bacteria, especially Yersinia enterocolitica O:9 (3, 4, 7, 34, 37, 38, 39, 40, 41). A fluorescence
polarisation assay (FPA) has also been
developed (3, 30). Other serological tests used in cattle can also be applied to swine. The brucellin allergic skin test is widely used to identify infected herds in some countries. A definitive diagnosis can be made by isolating B. suis from the infected animals. Brucella spp. can be isolated with a wide variety of simple culture media or by using selective media, such as the Farrell medium or modified Thayer‐Martin medium. Enrichment techniques can also be used. Polymerase chain reaction
(PCR) techniques are available in many
laboratories (3, 41). Our study describes the development and performance evaluation of two ELISAs (c‐ELISA and i‐ELISA) and a dissociation‐enhanced lanthanide fluorescence
immunoassay (DELFIA) which uses
monoclonal antibodies and, as antigen,
lipopolysaccharide (LPS) derived from smooth B. suis colonies. This study also describes the evaluation of performance of a commercial FPA for bovines, using swine sera.
Materials
and
methods
Monoclonal
antibodies
Anti‐Brucella LPS monoclonal antibodies
(MAbs) were produced as described
previously (31). Anti‐swine immunoglobulin G (IgG) MAbs were produced by intraperitoneal immunisation of Balb/c mice with 50 μg/ml
purified swine IgG diluted in complete
Freund’s adjuvant (Sigma, St Louis, Missouri). The swine IgG had previously been purified by affinity chromatography with protein A (5, 22). Two weeks after the first immunisation, 50 μg/ml of purified IgG diluted in incomplete Freund’s adjuvant (Sigma, St Louis) was inoculated. A third inoculation was performed with 50 μg/ml of swine IgG diluted in sterile phosphate‐buffered saline (PBS) (0.01 M, pH 7.2). On the 46th day, an intraperitoneal booster of 50 μg/ml of IgG diluted in sterile PBS was administered. After euthanasia, the mouse splenocytes were collected and fused with murine myeloma cells of line Sp2/O‐Ag‐14
(American Type Culture Collection) (32). The hybridomas were cultured for two weeks in Dulbecco’s modified Eagle medium containing 20% foetal bovine serum, 2 mM glutamine,
100× amphotericin‐penicillin‐streptomycin,
50 mg/ml gentamicin, 10 000 UI/ml nystatin and 50× HAT. The hybridomas secreting anti‐
swine IgG antibodies were cloned in
accordance with the limit dilution method (19, 25) and screened using an i‐ELISA (26) using microplates coated with purified swine IgG. The cross‐reactions with swine IgM and bovine, ovine, equine and chicken IgG and IgM were also verified.
The MAb isotype was determined with
Immunopure® monoclonal antibody isotyping
kit I (Pierce, Rockford, Illinois), according to the instructions of the manufacturer. The MAb (IgG isotype) to be used in the ELISA was
purified by affinity chromatography with
protein A (5, 22) and conjugated with horse‐ radish peroxidase (HRP) as described in the literature (29). The MAb 4B5A to be used in the DELFIA was labelled with europium using the ‘Eu‐Labelling Kit’ (Perkin Elmer, Waltham); the europium‐labelled MAb was further purified by size‐exclusion chromatography with an Hi‐
Load 16/60 Superdex 200 column (GE‐
Healthcare, Uppsala) and the labelling yield
was then determined with molar ratio
Eu3+/IgG(MAb).
Preparation
of
Brucella
suis
lipopolysaccharide
sterile deionised water and stored at –80°C. The quantity of LPS was determined by the 2‐keto‐3‐deoxyoctonate (KDO) assay (23).
Positive
and
negative
control
sera
The positive control serum (CFT titre: 1:20; i‐ELISA titre: 1:512) was obtained from pigs that had been experimentally infected with B. suis biovar 2. The negative control serum was obtained from healthy pigs.
Sample
sera
The positive sera were obtained from
106 animals from which B. suis had been
isolated, and the negative sera from
1 036 clinically healthy animals from
brucellosis‐free farms. The panel of selected sera included: 46 positive wild boar sera and 16 negative wild boar sera supplied by the Istituto Zooprofilattico Sperimentale in Piedmont, Liguria and Valle d’Aosta (Italy); 60 positive pig sera were supplied by the Croatian
Veterinary Institute in Zagreb and
1 020 negative pig sera were obtained from brucellosis‐free herds in the Abruzzo and Molise regions of Italy. All sera from the above panel were used to assess performances of indirect and competitive ELISAs, whereas a lower number of sera from the same panel were used for DELFIA and FPA.
Competitive
enzyme
‐
linked
immunosorbent
assay
The LPS (100 μl per well), diluted in 0.05 M carbonate‐bicarbonate buffer (pH 9.6) to a final concentration of 1.6 ng/ml, was dispensed into 96‐well microplates (Medium Binding Costar, Corning, New York) and incubated overnight at room temperature (RT). The plates were
washed once with PBS containing 0.05%
Tween 20 (PBS‐T) and blocked with 1% yeast extract (Panreac, Barcelona) in PBS‐T at RT for 1 h. After three washes with PBS‐T, 50 μl of PBS (MAb control), 50 μl of positive and negative control swine sera and 50 μl of each sample serum were dispensed into the wells and the microplates were incubated at RT for 1 h. The plates were then washed three times with PBS‐T and incubated with 50 μl/well of anti‐Brucella‐LPS MAb HRP (MAb 4B5A) diluted 1:60 000 in PBS at RT for 1 h. After
further washes, 100 μl of 3.3’,5.5’‐tetramethyl‐ benzidine solution (TMB) (Sigma, St Louis) was dispensed into each well and the plates were incubated at RT for 30 min. The reaction
was stopped by adding 50 μl/well of
0.5 N sulphuric acid and the optical density (OD) was measured at 450 nm. The absorbance data obtained were normalised using the following formula:
B/B0% = (OD450 sample serum/OD450 MAb
control) × 100%.
Indirect
enzyme
‐
linked
immunosorbent
assay
The LPS (100 μl per well), diluted in 0.05 M carbonate‐bicarbonate buffer (pH 9.6) to a final concentration of 4 ng/ml, was dispensed into 96‐well microplates (Medium Binding Costar, Corning, New York) and incubated overnight. The plates were washed once with PBS‐T and blocked with 1% yeast extract in PBS‐T at RT for 1 h. After three washes with PBS‐T, 50 μl of PBS (MAb control), 50 μl of positive and negative control swine sera and 50 μl of each sample serum were dispensed into the wells and the microplates were incubated at RT for 1 h. The plates were then washed three times with PBS‐T and incubated with 50 μl/well of
anti‐swine IgG MAb‐HRP (MAb 10C2G5)
diluted 1:15 000 in PBS at RT for 1 h. After further washes, 100 μl of TMB was dispensed into each well and the plates were incubated at RT for 30 min. The reaction was stopped by adding 50 μl/well of 0.5 N sulphuric acid and
the OD was measured at 450 nm. The
absorbance data obtained were normalised
using the following formula:
Percentage positivity (PP%) = [(OD450 sample
serum – OD450 negative control)/(OD450 positive
control – OD450 negative control)] × 100%.
Dissociation
‐
enhanced
lanthanide
fluorescence
immunoassay
The LPS (100 μl per well), diluted in 0.1 M sodium phosphate buffer (pH 7.4) to a final concentration of 3.4 ng/ml, was dispensed into 96‐well microplates (Polysorp‐clear FluoroNunc/
LumiNunc, Nunc, Roskilde) and incubated
serum albumin in 0.05 M Tris‐HCl (pH 7.4) at RT for 2 h. After three washes, 50 μl of DELFIA dilution buffer (Perkin Elmer‐Wallac, Turku) (MAb control), 50 μl of positive and negative control swine sera and 50 μl of each sample serum were dispensed into the wells, and the plates were incubated a RT for 1 h. The plates were then washed three times and incubated with 50 μl/well of MAb‐Eu anti‐ Brucella‐LPS (MAb 4B5A) diluted 1:20 000 in DELFIA dilution buffer at RT for 1 h. After six
washes, 200 μl of enhancement solution
(Perkin Elmer‐Wallac, Turku) was added to each well and the plates were incubated at RT for 5 min after gentle stirring. The fluorescence of the europium, recorded in counts per second (cps), was measured with the Victor 3V
1420 Multilabel Counter (Perkin Elmer‐Wallac, Turku).
The fluorescence data obtained were
normalised using the following formula: B/B0% = (cps sample serum/cps MAb control)
× 100%.
Fluorescence
polarisation
assay
The FPA was performed with the Brucella abortus antibody test kit (Diachemix, Milwaukee, Wisconsin). A total of 180 μl of buffer for the FPA was dispensed into the wells of black
96‐well microplates (Greiner‐Bio‐One,
Frickenhausen); 20 μl/well of positive and negative control sera and of each sample serum was then added. The microplates were incubated for 3 min at RT and the natural fluorescence of the sera was measured with a
Genios polarimeter (Tecan, Männedorf)
calibrated with 1 nM fluorescein (excitation filter 485 nm; emission filter 535 nm; number of flashes: 25; gain: 100). Then, 10 μl of the
O polysaccharide (OPS), conjugated with
fluorescein, was dispensed into each well and the plates were incubated for 2 min at RT with gentle stirring. The fluorescence of the OPS antigen in each well was measured again with the polarimeter and the fluorescence values thus obtained were corrected by subtracting the natural fluorescence value of the sera in the corresponding wells.
The values obtained were converted to
millipolarisation units (mP) using the
following formula:
mP = [(Iv‐Ih)/(Iv+Ih)] × 1 000
where: Iv= intensity of parallel light, and Ih = intensity of perpendicular light.
Determination
of
cut
‐
off
values
The optimum cut‐off values for c‐ELISA and
i‐ELISA were determined with receiver
operative curves (ROC curves) (17, 33) using the OD450 values of the sera analysed,
normalised in relation to the OD450 of the MAb
control (B/B0%) and the OD450 of the positive
and negative control (PP%), respectively.
The cut‐off value of the DELFIA was determined by analysing 30 swine sera which tested negative for antibodies to B. suis. The cut‐off value was calculated by subtracting three standard deviations from the mean value of the normalised data (B/B0%) deriving from
an analysis of the group of negative sera.
The optimum cut‐off value of the FPA was
determined with ROC curves using the
fluorescence values (mP) of the sera analysed.
Results
Monoclonal
antibodies
To develop the c‐ELISA, we used the anti‐ Brucella‐LPS MAb 4B5A, previously described to develop a c‐ELISA for the detection of Brucella spp. antibodies in cattle, sheep and goat sera (31). The cross‐reactions of MAb 4B5A are shown in Table I. MAb cross‐reacts with B. suis biovar 1 that was used in this study for microplate coating.
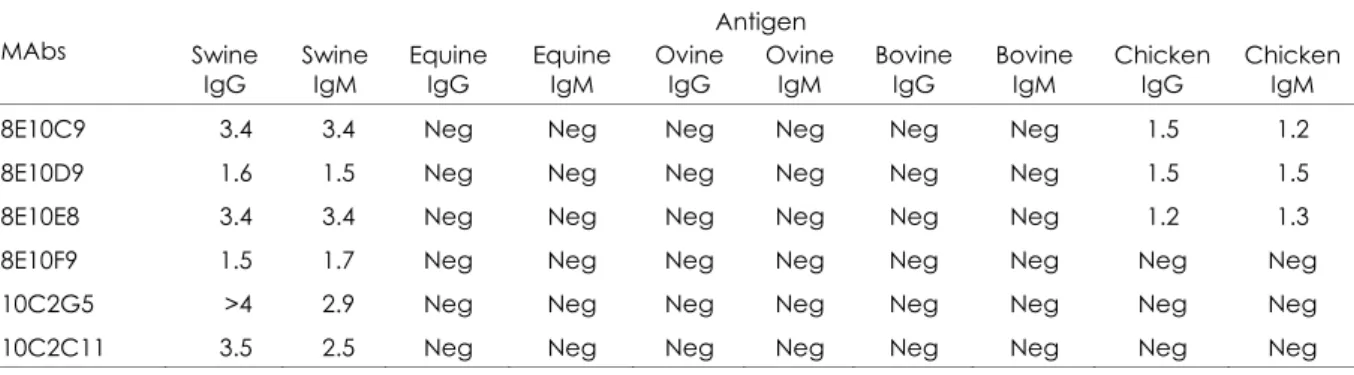
Six MAbs specific for swine IgG were
obtained, all of which belonged to class IgG1,
kappa light chain. The cross‐reactions of anti‐ swine IgG MAb are shown in Table II; MAb antibodies with an OD450 greater than 0.3 were
considered to be cross‐reactive. MAb 10C2G5 was selected because it discriminated better between positive and negative sera in the i‐ELISA for anti‐B. suis antibodies.
Table I
Cross-reactions of anti-lipoploysaccharide-Bruc e lla monoclonal antibody 4B5A
in indirect enzyme-linked immunosorbent assay
Bacterial strain Monoclonal antibody 4B5A*
Bruc e lla me lite nsis biovar 2 100.0
Bruc e lla me lite nsis biovar 1 89.0
Bruc e lla me lite nsis biovar 1 Rev.1 88.9
Bruc e lla a b o rtus strain S19 104.0
Bruc e lla a b o rtus strain S99 98.0
Bruc e lla a b o rtus strain S99 (lipoploysaccharide) 99.8
Bruc e lla a b o rtus biovar 2 100.0
Bruc e lla a b o rtus biovar 3 102.0
Bruc e lla a b o rtus biovar 6 87.0
Bruc e lla suis biovar 1 92.0
Bruc e lla o vis 1.0
Sa lmo ne lla Enteritidis 0.0
Sa lmo ne lla Typhimurium 1.0
Esc he ric hia c o liO 157:H7 0.0
Ye rsinia e nte ro c o litic a O:9 0.0
Ye rsinia e nte ro c o litic a O:8 0.0
Vib rio c ho le ra e 3.0
Liste ria mo no c yto g e ne s 7.0
C a mp ylo b a c te r je juni 7.7
Pse udo mo na s ma lto p hilia 1.1
* (OD450 ×/OD450B. me lite nsis biovar 2) × 100
Table II
Cross-reactions of anti-swine IgG monoclonal antibodies in indirect enzyme-linked immunosorbent assay
(OD450)
Antigen
MAbs Swine
IgG
Swine IgM
Equine IgG
Equine IgM
Ovine IgG
Ovine IgM
Bovine IgG
Bovine IgM
Chicken IgG
Chicken IgM
8E10C9 3.4 3.4 Neg Neg Neg Neg Neg Neg 1.5 1.2
8E10D9 1.6 1.5 Neg Neg Neg Neg Neg Neg 1.5 1.5
8E10E8 3.4 3.4 Neg Neg Neg Neg Neg Neg 1.2 1.3
8E10F9 1.5 1.7 Neg Neg Neg Neg Neg Neg Neg Neg
10C2G5 >4 2.9 Neg Neg Neg Neg Neg Neg Neg Neg
10C2C11 3.5 2.5 Neg Neg Neg Neg Neg Neg Neg Neg
Mabs monoclonal antibodies Ig immunoglobulin Neg negative
MAb 4B5A and MAb 10C2G5 were both
conjugated with HRP to be used in c‐ELISA and i‐ELISA respectively; MAb 4B5A was also conjugated with europium for use in the
DELFIA.
Competitive
enzyme
‐
linked
immunosorbent
assay
A total of 80 positive and 1 036 negative sera from the available panel were tested using the c‐ELISA; the distribution of the B/B0% values is
shown in Figure 1. The B/B0% value of 61.0%
(Fig. 2). Sera were classified as positive if their B/B0% value was less than 61.0% and negative
if their B/B0% value was greater than or equal
to 61.0%. All the positive sera tested positive in c‐ELISA and all the negative sera tested negative; the specificity and sensitivity of the assay were both 100%, as shown in Table III.
0 20 40 60 80 100 120 140 160 180 200 220 240
Sera
B/
Bo
%
Negative Cut-off Positive
Figure 1
Competitive enzyme-linked immunosorbent
assay: distribution of B/B0%values of 80 positive
and 1 036 negative sera
The horizontal line represents the cut-off value
(B/B0%= 61.0%)
Indirect
enzyme
‐
linked
immunosorbent
assay
For the i‐ELISA, 106 positive and 982 negative sera from the available panel were analysed; the distribution of the PP% values is shown in Figure 3. The PP% value of 21.7% was chosen as the cut‐off (Fig. 4) to obtain maximum sensitivity. The sera were classified as positive if their PP% value was greater than or equal to
0% 10% 20% 30% 40% 50% 60% 70% 80% 90% 100%
0 20 40 60 80 100 120 140 160 180 200 220 240 260 Cut-off
Se
n
sit
iv
it
y
a
n
d
s
p
e
c
if
ic
it
y
Sensitivity Specificity
Figure 2
Cut-off value of competitive enzyme-linked immunosorbent assay calculated according to sensitivity and specificity values
-10 0 10 20 30 40 50 60 70 80 90 100 110 120 130 140
Sera
PP
%
Negative Cut-off Positive
Figure 3
Indirect enzyme-linked immunosorbent assay: distribution of PP% values of 106 positive and 982 negative sera
The horizontal line represents the cut-off value (percentage positivity [PP%] = 21.7%)
Table III
Comparison between competitive enzyme-linked immunosorbent assay
and isolation of Bruc e lla suis; sensitivity and specificity of c-ELISA
Isolation of Bruc e lla suis
Competitive enzyme-linked
immunosorbent assay Positive Negative Total
Positive 80 0 80
Negative 0 1 036 1 036
Total 80 1 036 1 116
Percentage Lower confidence limit* Upper confidence limit*
Sensitivity 100.0 96.4 100.0
Specificity 100.0 99.7 100.0
0% 10% 20% 30% 40% 50% 60% 70% 80% 90% 100%
-10 0 10 20 30 40 50 60 70 80 90 100 110 120 130 140 150 Cut-off
S
e
n
si
tiv
it
y
a
n
d
s
p
e
c
if
ic
it
y
Sensitivity Specificity Cut-off (optimal point)
Figure 4
Cut-off value of indirect enzyme-linked
immunosorbent assay calculated according to sensitivity and specificity values
21.7% and negative if their PP% value was less than 21.7%. All positive sera tested positive in i‐ELISA; 9 negative sera proved to be false‐ positives and the remaining 973 negative sera tested negative; the specificity and sensitivity of the test were 99.1% and 100.0% respectively, as shown in Table IV.
Dissociation
‐
enhanced
lanthanide
fluorescence
immunoassay
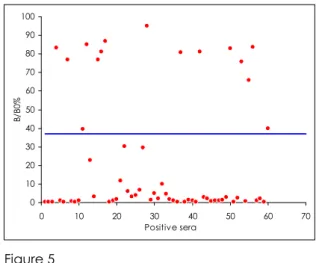
DELFIA was tested using 60 positive and 212 negative sera from the same panel; the distribution of the B/B0% values is shown in
Figures 5 and 6. The B/B0% value of 37% was
calculated as the cut‐off (mean of the B/B0%
values of the 30 negative sera tested – 3 standard deviations): the sera were classified
as positive if their B/B0% value was less than
37% and negative if their B/B0% value was
greater than or equal to 37%. A total of 20 of the 212 negative sera proved to be false‐ positives, and 15 of the 60 positive sera proved to be false‐negatives; the specificity and sensitivity of the test were 91% and 75%, respectively, as shown in Table V. Due to the low performances of the test with either false‐ positive and false‐negative results, no additional samples were analysed with this method. The labelling yield of MAb 4B5A with europium was 8.2 (expected yield value of labelling for monoclonal antibodies: 6‐10).
0 10 20 30 40 50 60 70 80 90 100
0 10 20 30 40 50 60 70
Positive sera
B/
B
0
%
Figure 5
Dissociation-enhanced lanthanide fluorescence immunoassay: distribution of
B/B0% values of 60 positive sera
The horizontal line represents the cut-off value
(B/B0% = 37%)
Table IV
Comparison between indirect enzyme-linked immunosorbent assay
and isolation of Bruc e lla suis; sensitivity and specificity of i-ELISA
Isolation of Bruc e lla suis
Indirect enzyme-linked
immunosorbent assay Positive Negative Total
Positive 106 9 115
Negative 0 973 973
Total 106 982 1 088
Percentage Lower confidence limit* Upper confidence limit*
Sensitivity 100.0 97.2 100.0
Specificity 99.1 98.3 99.5
0 10 20 30 40 50 60 70 80 90 100 110
0 50 100 150 200 250
Negative sera
B/
B0
%
Figure 6
Dissociation-enhanced lanthanide fluorescence immunoassay: distribution of B/B0% values of 212 negative sera
The horizontal line represents the cut-off value (B/B0% = 37%)
Fluorescence
polarisation
assay
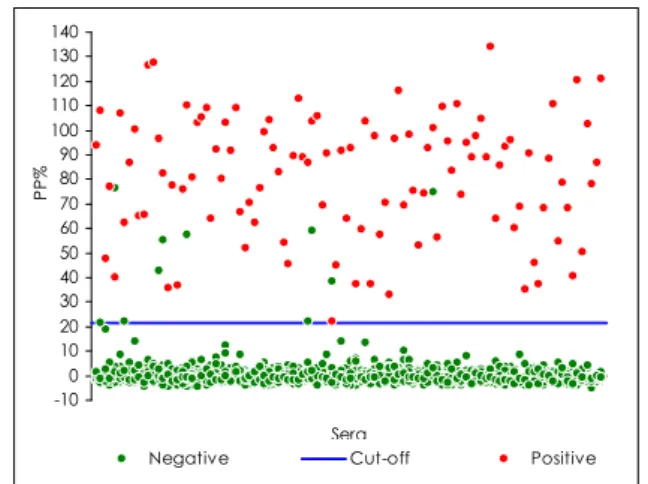
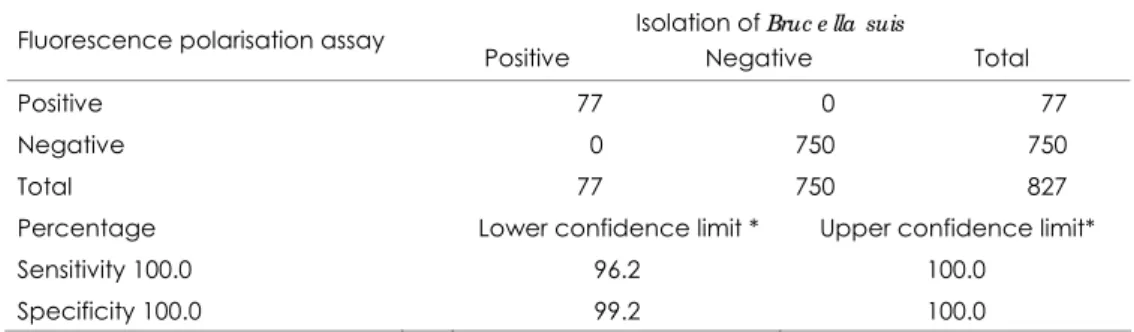
The commercial FPA is presently validated for bovine sera alone. To confirm the validity of the assay in swine, we tested 77 positive and 750 negative sera from the selected panel; the distribution of the mP values is shown in Figure 7. The mP value of 99.5 was chosen as the cut‐off (Fig. 8) and the sera were classified as positive if their mP value exceeded 99.5 and negative if their mP value was less than or equal to 99.5. All the positive sera tested positive in the FPA and all the negative sera tested negative; the specificity and sensitivity of the assay were both 100%, as shown in Table VI.
0 50 100 150 200 250 300
0 100 200 300 400 500 600 700 800 900 Sera
mP
Positive Negative Cut-off
Figure 7
Fluorescence polarisation assay: distribution of millipolarisation (mP) unit values of 77 positive and 750 negative sera
The horizontal line represents the cut-off value (mP = 99.5)
0% 10% 20% 30% 40% 50% 60% 70% 80% 90% 100%
20 40 60 80 100 120 140 160 180 200 220 240 260 280 300 Cut-off
Se
n
sit
iv
it
y
a
n
d
s
p
e
c
if
ic
it
y
Sensitivity Specificity Cut-off
Figure 8
Cut-off values of fluorescence polarisation assay calculated according to sensitivity and specificity values
Table V
Comparison between dissociation-enhanced lanthanide fluorescence
immunoassay (DELFIA) and isolation of Bruc e lla suis and sensitivity and specificity of DELFIA
Isolation of Bruc e lla suis
Dissociation-enhanced lanthanide
fluorescence immunoassay Positive Negative Total
Positive 45 20 65
Negative 15 192 207
Total 60 212 272
Percentage Lower confidence limit* Upper confidence limit*
Sensitivity 75.0 – –
Specificity 91.0 – –
Table VI
Comparison between fluorescence polarisation assay (FPA) and isolation of Bruc e lla suis;
sensitivity and specificity of FPA
Isolation of Bruc e lla suis
Fluorescence polarisation assay
Positive Negative Total
Positive 77 0 77
Negative 0 750 750
Total 77 750 827
Percentage Lower confidence limit * Upper confidence limit*
Sensitivity 100.0 96.2 100.0
Specificity 100.0 99.2 100.0
* 95% confidence interval
Discussion
Swine brucellosis is mainly caused by B. suis biovars 1, 2 and 3; the other species of Brucella occasionally reported in swine are B. abortus and B. melitensis (3). B. suis biovar 1 is common in South America and Asia, whilst B. suis biovars 1 and 3 have been reported in the United States, in Australia and in the People’s Republic of China. B. suis biovar 2, the natural reservoir of which is the wild boar and/or the European hare, is the most common strain isolated in Europe (1, 4, 9, 11, 15, 24, 28), but biovar 1 and 3 are also present. In Italy, the isolation of B. suis biovars 1 and 2 has been reported (8, 10, 12, 18). B. suis biovar 2 is rarely
pathogenic in humans, whereas B. suis
biovars 1 and 3 are highly pathogenic and can cause serious illness (3, 4, 41).
Swine brucellosis was eradicated from many European countries in the 1970s, as a result of the industrialisation of farms. In the 1990s, the disease re‐emerged in extensive husbandry, transmitted by hares and wild boars. The available serological tests for swine brucellosis described in the World Organisation for
Animal Health (Office International des
Épizooties: OIE) Manual of diagnostic tests and vaccines (41), are the i‐ELISA and c‐ELISA, the Rose Bengal rapid agglutination test (RBT), the
FPA and, although not recommended, the
CFT. None of the above‐mentioned tests has optimal sensitivity values, and even less so those for specificity for individual diagnostic purposes due to the false‐positive reactions which probably arise from cross‐reactions with
other bacteria and mainly with Y. enterocolitica O:9. Swine serum may sometimes contain non‐ specific antibodies, probably IgM, that reduce the specificity of conventional tests, especially for serum agglutination tests. Moreover, swine
complement interacts with guinea‐pig
complement to produce pro‐complementary
activity that reduces the sensitivity of the CFT (41).
Conclusions
The aim of this study was to evaluate the
methods described in the international
literature for the diagnosis of swine brucellosis
and to develop new and more specific
methods. For this purpose, we assessed the diagnostic sensitivity and specificity of i‐ELISA and c‐ELISA methods and of the DELFIA, developed with B. suis LPS (homol‐ ogous antigen) on swine sera. In addition, the performance of a commercial FPA was also evaluated in swine.
With the c‐ELISA, the maximum sensitivity
(confidence interval between 96.4% and
100.0%) and the maximum specificity
(confidence interval between 99.7% and
100.0%) were obtained at a cut‐off value of 61.0% (B/B0%). With the i‐ELISA, the
maximum sensitivity (confidence interval
sensitivity (confidence interval between 96.2% and 100.0%) can be used as a screening method if performances recorded in this study are be confirmed by field tests.
The DELFIA method, which is already in use to test for steroid hormones and veterinary
drug residues, cytokines, antibodies and
bacterial and viral antigens (2, 6, 13, 14, 20, 27, 35), does not offer good levels of specificity and sensitivity at this stage of development (91% and 75%, respectively) and it is not expected to be used widely in routine diagnosis in the view of the high cost of the europium used in the method.
Our results suggest that a combination of the c‐ELISA, i‐ELISA and FPA methods may provide an appropriate solution for the serological diagnosis of swine brucellosis due to their high sensitivity and specificity. However the lack of an international standard serum, such as that for cattle, sheep and goat brucellosis, still represent the major limitation for the standardisation of diagnostic tests for serological diagnosis of swine brucellosis.
Finally a pilot study for the field application of a diagnostic protocol, involving the combined use of the three tests described above with a defined cut‐off, is required to evaluate real performances of the assays in field conditions and, in particular, to evaluate sensitivity during outbreaks and specificity to avoid false‐ positive reactions in disease‐free herds.
Acknowledgments
The authors wish to thank Dr Flavio Sacchini for his critical editing of the text.
Grant
support
This research was funded by a contribution from the Italian Ministry of Health (project code IZSAM 0705 RC TE).
References
1. Al Dahouk S., Nöckler K., Tomaso H., Splettstoesser W.D., Jungersen G., Riber U., Petry T., Hoffmann D.,
Scholz H.C., Hensel A. & Neubauer H. 2005. Seroprevalence of brucellosis, tularemia and yersiniosis in
wild boars (Sus sc ro fa) from north-eastern Germany. J Ve tMe d B, 52, 444-455.
2. Allicotti G., Borras E. & Pinilla C. 2003. A time-resolved fluorescence immunoassay (DELFIA) increases
the sensitivity of antigen-driven cytokine detection. J Immuno a ssa y Immuno c he m, 24 (4), 345-358.
3. Anon. 2007. Porcine and rangiferine brucellosis: Bruc e lla suis. Center for Food Security and Public
Health, Iowa State University, Ames, 1-6.
4. Anon. 2009. Porcine brucellosis (Bruc e lla suis). Scientific opinion of the Panel on animal health and
welfare (Question No EFSA-Q-2008-665). EFSA Jo urna l, 1144, 1-112.
5. Ansari A.A. & Chang T.S. 1993. Immunochemical studies to purify rabbit and chicken
immunoglobulin G antibody by protein A-Sepharose chromatography. Am J Ve t Re s, 44 (5), 901-906.
6. Antolini F. & Bolletta G. 2000. Tecniche di fluorimetria ritardata nel tempo (DELFIA),
chemiluminescenza e RIA per la determinazione del 17 β-estradiolo nel siero bovino. Zo o te c h Nutr
Anim, 26, 189-198.
7. Asbakk K., Gall D. & Stuen S. 1999. A screening ELISA for brucellosis in reindeer. J Ve tMe d B, 46,
649-657.
8. Bergagna S., Zoppi S., Ferroglio E., Gobetto M., Dondo A., Di Giannatale E., Gennero M.S. &
Grattarola C. 2009. Epidemiologic survey for Bruc e lla suis biovar 2 in a wild boar (Sus sc ro fa)
population in northwest Italy. J Wildlife Dis, 45 (4), 1178-1181.
9. Closa-Sebastià F., Casas-Díaz E., Cuenca R., Lavín S., Mentaberre G. & Marco I. 2010. Bruc e lla
species antibodies and isolation in wild boar in north-east Spain. Ve t Re c, 167, 826-828.
10. Cvetnić Ž., Špičić S., Curić S., Jukić B., Lojkić M., Albert D., Thiébaud M. & Garin-Bastuji B. 2005.
Isolation of Bruc e lla suis biovar 3 from horses in Croatia. Ve t Re c, 156, 584-585.
11. Cvetnić Ž., Špičić S., Tončić J., Majnarić D., Benić M., Albert D., Thiébaud M. & Garin-Bastuji B. 2009.
12. Dondo A., Grattarola C., Gennero S., Zoppi S. & Di Giannatale E. 2003. Osservazioni preliminari sulla
presenza di Bruc e lla suis bivoar 1 nel cinghiale in Piemonte. Pro g re sso Ve t, 3, 112-116.
13. Elliott C.T., Francis K.S. & McCaughey W.J. 1994. Investigation of dissociation enhanced lanthanide
fluoroimmunoassay as an alternative screening test for veterinary drug residues. Ana lyst, 119 (12),
2565-2569.
14. Elliott C.T., Francis K.S., Shortt H.D. & McCaughey W.J. 1995. Determination of the concentrations of
the steroids estradiol, progesterone and testosterone in bovine sera: comparison of commercial dissociation enhanced lanthanide fluorescence immunoassay kits with conventional radio and
enzyme immunoassays. Ana lyst, 120 (6), 1827-1830.
15. Ferrão-Beck L., Cardoso R., Muñoz P.M., de Miguel M.J., Albert D., Ferreira A.C., Marín C.M.,
Thiébaud M., Jacques I., Grayon M., Zygmunt M.S., Garin-Bastuji B., Blasco J.M. & Sá M.I. 2006.
Development of a multiplex PCR assay for polymorphism analysis of Bruc e lla suis biovars causing
brucellosis in swine. Ve t Mic ro b io l, 115, 269-277.
16. Franco M.P., Mulder M., Gilman R.H. & Smits H.L. 2007. Human brucellosis. La nc e t Infe c t Dis, 7,
775-786.
17. Gardner I.A. & Greiner M. 2000. Advanced methods for test validation and interpretation in
veterinary medicine. Freie Universität, Berlin, 1-78.
18. Gennero M.S., Grattarola C., Bergagna S., Zoppi S., Barbaro A. & Dondo A. 2006. Trend of Bruc e lla
suis infection in wild boar in Piedmont Region (2002-2005). Ép id Sa nté Anim, 49, 59-62.
19. Goding J.W. 1996. Monoclonal antibodies: principles and practice. Third Ed. Academic Press Limited,
London, 154-156.
20. Guzaeva T.V., Komarov A.M., Yurov S.V., Pchelintsev S.Y., Chudinov A.V. & Afanasiev S.S. 1993.
Protein A used in DELFIA for the determination of specific antibodies. Immuno lLe tt, 35 (3), 285-289.
21. Hendry D.M.F.D., Corbel M.J., Bell R.A. & Stack J.A. 1985. Bruc e lla antigen production and
standardization. Central Veterinary Laboratory New Haw, Weybridge, 1-96.
22. Hermanson, G.T., Krishna Mallia A. & Smith P.K. 1992. Immobilized affinity ligand techniques.
Academic Press, San Diego, 244-249.
23. Karkharis Y.D., Zeltner J.Y., Jackson J.J. & Carlo D.J. 1978. A new and improved microassay to
determine 2-keto-3-deoxyoctonate in lipopolysaccharide of Gram-negative bacteria. Ana l
Bio c he m, 85 (2), 595-601.
24. Leuenberger R., Boujon P., Thür B., Miserez R., Garin-Bastuji B., Rüfenacht J. & Stärk K.D.C. 2007.
Prevalence of classical swine fever, Aujeszky’s disease and brucellosis in a population of wild boar in
Switzerland. Ve t Re c, 160, 362-368.
25. Luciani M., Armillotta G., Magliulo M., Portanti O., Di Febo T., Di Giannatale E., Roda A. & Lelli R. 2006.
Production and characterisation of monoclonal antibodies specific for Esc he ric hia c o li O157:H7. Ve t
Ita l, 42 (3), 173-182.
26. Malavasi F. & Bargellesi-Severi A. 1992. Anticorpi monoclonali. Tecniche di base I. PhD Thesis 02.
In I Manuali delle scuole. Edizioni SOSB-SIOMS, Genoa, 1-208.
27. Markela E., Stahlberg T.H. & Hemmila I. 1993. Europium-labelled recombinant protein G. A fast and
sensitive universal immunoreagent for time-resolved immunofluorometry. JImmuno l Me tho ds,
161 (1), 1-6.
28. Muñoz P.M., Boadella M., Arnal M., de Miguel M.J., Revilla M., Martínez D., Vicente J., Acevedo P.,
Oleaga Á., Ruiz-Fons F., Marín C.M., Prieto J.M., de la Fuente J., Barral M., Barberán M., Fernández de Luco D., Blasco J.M. & Gortázar C. 2010. Spatial distribution and risk factors of brucellosis in
Iberian wild ungulates. BMC Infe c t Dis, 10, 1-14.
29. Nakane P.K. & Kawaoi A. 1974. Peroxidase-labeled antibody. A new method of conjugation.
J Histo c he m C yto c he m, 22, 1084-1091.
30. Nielsen K., Gall D., Smith P., Vigliocco A., Perez B., Samartino L., Nicoletti P., Dajer A, Elzer P. &
Enright F. 1999. Validation of the fluorescence polarization assay as a serological test for the
presumptive diagnosis of porcine brucellosis. Ve t Mic ro b io l, 68, 245-253.
31. Portanti O., Tittarelli M., Di Febo T., Luciani M., Mercante M.T., Conte A. & Lelli R., 2006. Development
and validation of a competitive ELISA kit for the serological diagnosis of ovine, caprine and bovine
brucellosis. J Ve t Me d B, 53, 494-498.
32. Schulman M., Wilde C.D. & Kohler G. 1978. A better cell line for making hybridomas secreting
33. Siegel S. & Castellan N.J. 1988. Nonparametric statistics for the behavioral sciences, Second Ed. McGraw-Hill, New York, 1-399.
34. Silva Paulo P., Vigliocco A.M., Ramondino R.F., Marticorena D., Bissi E., Briones G., Gorchs C., Gall D.
& Nielsen K. 2000. Evaluation of primary binding assays for presumptive serodiagnosis of swine
brucellosis in Argentina. C lin Dia g n La b Immuno l, 7 (5), 828-831.
35. Smith D.R., Rossi C.A., Kijek T.M., Henchal E.A. & Ludwig G.V. 2001. Comparison of
dissociation-enhanced lanthanide fluorescent immunoassays to enzyme-linked immunosorbent assays for
detection of staphylococcal enterotoxin B, Ye rsinia p e stis-specific F1 antigen and Venezuelan
equine encephalitis virus. C lin Dia g n La b Immuno l, 8 (6), 1070-1075.
36. Smither S.J., Perkins S.D., Davies C. & Stagg A.J. 2009. Development and characterization of mouse
models of infection with aerosolized Bruc e lla me lite nsis and Bruc e lla suis. C lin Va c c ine Immuno l,
16 (5), 779-783.
37. Szulowski K., Iwaniak W., Pilaszek J., Truszczyński M. & Chrobocińska M. 1999. The ELISA for the
examination of hare sera for anti-Bruc e lla antibodies. C o mp Immuno l Mic ro b Infe c t Dis, 22, 33-40.
38. Szulowski K., Iwaniak W., Złotnicka J., Weiner M., Zaręba Z. & Czępińska H. 2011. International trade –
a potential source of brucellosis in pigs. Me d We ter, 67 (1), 64-66.
39. Thoen C.O., Hopkins M.P., Armbrust A.L., Angus R.D. & Pietz D.E. 1980. Development of an
enzyme-linked immunosorbent assay for detecting antibodies in sera of Bruc e lla suis-infected swine. C a n J
C o mp Me d, 44, 294-298.
40. Watarai M., Ito M., Omata Y. & Ishiguro N. 2006. A serological survey of Bruc e lla spp. in free-ranging
wild boars (Sus sc ro fa le uc o mysta x) in Shikoku, Japan. J Ve t Me d Sc i, 68 (10), 1139-1141.
41. World Organisation for Animal Health (Office International des Épizooties: OIE) 2009. Porcine