www.ann-geophys.net/27/1861/2009/
© Author(s) 2009. This work is distributed under the Creative Commons Attribution 3.0 License.
Annales
Geophysicae
Circulation of the thermocline salinity maximum waters off the
Northern Brazil as inferred from in situ measurements and
numerical results
A. C. Silva1, B. Bourles2, and M. Araujo3
1Instituto de Ciˆencias do Mar, Universidade Federal do Cear´a, Av. Abolic¸˜ao 3207, 60165-081, Fortaleza – CE, Brazil 2Institut de Recherche pour le D´eveloppement, 08 B.P. 841 – Cotonou, B´enin
3Laborat´orio de Oceanografia F´ısica Estuarina e Costeira, Depto. Oceanografia, UFPE, CNPq Fellow. Av. Arquitetura s/n,
Campus Universit´ario, 50740-550, Recife, PE, Brazil
Received: 24 September 2008 – Revised: 17 March 2009 – Accepted: 6 April 2009 – Published: 4 May 2009
Abstract. High resolution hydrographic observations of temperature and salinity are used to analyse the subsurface circulation along the coast of North Brazil, off the Amazon mouth, between 2◦S and 6◦N. Observations are presented
from four cruises carried out in different periods of the year (March–May 1995, May–June 1999, July–August 2001 and October–November 1997). Numerical model outputs com-plement the results of the shipboard measurements, and are used to complete the descriptions of mesoscale circulation. The Salinity Maximum Waters are here analyzed, principally in order to describe the penetration of waters originating in the Southern Hemisphere toward the Northern Hemisphere through the North Brazil Current (NBC)/North Brazil Un-dercurrent (NBUC). Our results show that, if the Equatorial Undercurrent (EUC) is fed by Northern Atlantic Waters, this contribution may only occur in the ocean interior, east of the western boundary around 100 m depth. Modeling results in-dicate a southward penetration of the Western Boundary Un-dercurrent (WBUC) below the thermocline, along the North Brazilian coast into the EUC or the North Equatorial Under-current (NEUC) (around 48◦W–3◦N). The WBUC in the
re-gion does not flow more south than 3◦N. The northern waters
are diverted eastward either by the NBC retroflection or by the northern edge of the associated clockwise rings. The ex-istence of subsurface mesoscale rings associated to the NBC retroflection is evidenced, without any signature in the sur-face layer, so confirming earlier numerical model outputs. These subsurface anticyclones, linked to the NBC/NBUC
Correspondence to:A. C. Silva ([email protected])
retroflection into the North Equatorial Undercurrent and the EUC, contribute to the transport of South Atlantic high salin-ity water into the Northern Hemisphere.
Keywords. Oceanography: general (Equatorial oceanogra-phy, Descriptive and regional oceanography) – Oceanogra-phy: physical (Western boundary currents)
1 Introduction
The Western Tropical Atlantic Ocean plays an important role in the inter-hemispheric transports of mass, heat, and salinity (Schmitz and Mc Cartney, 1993). Along the western bound-ary, where the Deep Western Boundary Current transports cold North Atlantic Deep Water toward the Southern Hemi-sphere, the North Brazil Current (hereafter NBC) transports warm surface waters northward from the Southern Hemi-sphere. Both currents are major components of the global thermohaline circulation cell (Gordon, 1986).
The NBC and its subsurface component, the North Brazil Undercurrent (NBUC), feed, through complex retroflection patterns, eastward flowing equatorial currents at different depths and latitudes (e.g., Schott et al., 1995; Bourl`es et al., 1999a, b): (i) the South Equatorial Undercurrent (SEUC) be-low the thermocline around 3◦S, (ii) the Equatorial
Under-current (EUC) centered at the thermocline and the equator; (iii) the North Equatorial Undercurrent (NEUC) found be-low the thermocline around 3◦N; and (iv) the North
Equato-rial Counter Current (NECC) located above the thermocline north of 5◦
N.
Current (NEC) and the Western Boundary Undercurrent (WBUC), but a direct connection between the WBUC and the EUC is still unclear (Schott and B¨oning, 1991; Wilson et al., 1994; Bourl`es et al., 1999a, b). Stramma et al. (2005), by using the 1/12◦– Flame General Circulation Model,
demon-strated that part of the salinity maximum water from the Northern Hemisphere contributes to the water feeding the NEUC and also showed that salinity maximum water from the South Atlantic is transported towards the north Brazil-ian Shelf. The same authors also demonstrated that the NBC suffers a recirculation feeding the EUC close to the equator, generating two eddy features, located near 50◦
W and 44◦
W. North of the equator, the NBC/NBUC retroflection may be linked to the formation of rings (e.g., Johns et al., 1990, 2003; Didden and Schott, 1993; Richardson et al., 1994). Results based on satellite images and in situ observations demon-strate that these rings break away from the retroflection and move northwestward along the coast of Guyana, representing an important mechanism for transporting waters from both equatorial and South Atlantic to the Northern Hemisphere (Garzoli et al., 2003). During the last decade, many works have focused on the evaluation of the genesis and the water transport capacity of the NBC rings (Johns et al., 1990, 2003; Didden and Schott, 1993; Richardson et al., 1994; Fratantoni et al., 1995). More recently Wilson et al. (2002) described three different types of rings as follows: the first one is char-acterized by shallow, surface-trapped structures that are con-fined to the upper ocean layers; the second type is charac-terized by deep-reaching structures with significant swirl ve-locities (∼0.2 m s−1)extending down to 2000 m; whereas the
third type presents thermocline intensified structures with al-most no detectable surface signature.
All these above-mentioned features make the Western Tropical Atlantic a very important ocean crossroads, with strong confluence of water masses coming from the north, the south and the equatorial Atlantic, and thus with intense blending processes. Therefore, a particular attention should be given to the ocean area situated between the shelf break and the 2000 m isobath, which seems to be a key for a better understanding of the retroflection and the formation of the NBC/NBUC rings. Previous studies in this region have been either limited to the shelf region (e.g. AMASSEDS Program, Lentz and Limeburner, 1995) or focused on large scale ocean circulation (e.g. Schott et al., 1998; Bourl`es et al., 1999a, b). In this paper we use high resolution in situ data from four different cruises of the Brazilian REVIZEE Program (Programa de Avaliac¸˜ao do Potencial Sustent´avel de Recur-sos Vivos da Zona Econˆomica Exclusiva) carried out along the northern coast of Brazil limited by 2.5◦S–8◦N in
lati-tude, and 40◦W–52◦W in longitude, i.e. in a key area where
the NBC/NBUC system penetrates into the Northern Hemi-sphere. The main objective is to describe a seasonal and spa-tial variability of the thermocline salinity maximum waters circulation off the Northern Brazil. From field data, Silva et al. (2005a, b; 2007a, b) have studied the influence of the
Amazon plume in inducting shallow pycnoclines within the isothermal layers of the Northern Brazilian shelf. Observa-tions indicate that, along the North Brazilian shelf break, the formation of barrier layers seems also to be associated with the advection of the subsurface maximum salinity wa-ters formed in the region of the subtropical gyres and trans-ported to the study area by the NBC/NBUC system (Stramma et al., 1995; Pailler et al., 1999; Silva et al., 2005a; Stramma et al., 2005).
These data sets, along with the results obtained from a re-alistic numerical simulation, are used in order to attempt a better description and comprehension of the complex circu-lation within the subsurface layers, where the eastward un-dercurrents are fed through the NBC/NBUC retroflection and where thermocline salinity maximum waters may be clearly identified.
The paper is organized as follows. The main aspects of the hydrographic observations and numerical simulations are introducted in Sect. 2. In Sects. 3 and 4, we describe the ver-tical and horizontal sections obtained with high resolution hydrographic data observations of temperature and salinity, principally in order to describe the penetration of maximum salinity waters. The hydrographic data were complemented by modelling results to obtain additional information about the maximum salinity waters and mesoscale transport vari-ability in this area. In these two sections, we also discuss the circulation of the seasonal and interannual variability, by us-ing modellus-ing results, to obtain additional information about the maximum salinity waters and mesoscale transport vari-ability in this area. We conclude with a discussion relat-ing the principals results obtained from our combined hy-drographic data observations and numerical results.
2 Data and methods
2.1 Shipboard surveys
The hydrographic data sets were collected during four cruises performed at different times of the year, in March–May 1995, October–November 1997, May–June 1999 and July–August 2001, carried out on board the R/V Antares, as part of the ac-tivities of the Brazilian REVIZEE Program. The REVIZEE Program, coordinated by the Comiss˜ao Interministerial de Recursos do Mar/Inter-ministerial Commission of Sea Re-sources (CIRM), is the result of the commitment made by Brazil before the United Nations (UN), to ratify in 1988 the International Convention of the Law of the Sea, in effect since 1994. The main objective of the REVIZEE Program is to perform a survey of the living resources (and of the correlated abiotic factors) present in the Brazilian Exclusive Economic Zone (CIRM, 1994).
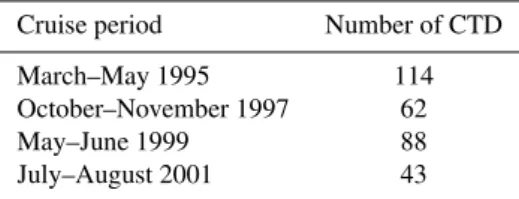
Table 1.REVIZEE cruises periods and the number of CTD profiles.
Cruise period Number of CTD
March–May 1995 114 October–November 1997 62 May–June 1999 88 July–August 2001 43
centrifuge pump and high resolution sensors for Conductiv-ity (resolution = 0.00004 S m−1), Temperature (resolution =
0.0003◦
C) and Pressure (resolution = 0.068 dbar) measure-ments. Calibration of the CTD sensor has been performed before each cruise directly by the manufacturer of the ap-paretus, and indicated that the error value on temperature was negligeable. In order to validate the salinity sensor, values collected by the CTD were compared with values obtained with bottle salinity. The obtained values of the water-sample salinities are comparable to the precision (0.001) and accu-racy (0.003).
During all the cruises, the CTD was operated until around 1000 m depth, with a descent speed of 1 m s−1, and a sample
frequency of 24 Hz. During the profiling, the equipment re-mained connected to a boarding platformSBE 11plus, which permitted real time monitoring of data acquisition and quality control. Spacing between hydrographic stations ranged from 14 to 55 km depending on the distance from shore (Fig. 1). Table 1 shows a synthesis of the REVIZEE data.
These data sets have already been used to analyze Amazo-nian water lenses and barrier layer formation in this particu-lar region (Silva et al., 2005a, b).
2.2 Model description
The CLIPPER modelling Project represents a French contri-bution to the World Ocean Circulation Experiment (WOCE). We use here the so-called ATL6-26 experiment of the CLIP-PER model, based on the OPA 8.1 code primitive equation parallel model (Madec et al., 1998). The horizontal grid is a Mercator isotropic grid with a 1/6◦
horizontal resolution at the equator, covering the Atlantic Ocean from 98◦
W to 30◦
E in longitude and 75◦
S to 70◦
N in latitude. The model is initialised using the seasonal climatology from Reynaud et al. (1998). The model is forced by daily mass and heat sur-face fluxes, and average output has been stored every 5 nu-merical days. The ATL6 model has been spun up for 8 years with the ECMWF reanalysis monthly climatology, then in-tegrated for the 15 years of the reanalysis (1979 to 1993), and then with the ECMWF analysis (1994–2001). The heat flux is formulated as suggested in Barnier et al. (1995), using their feedback coeficient for relaxation to the Reynolds SST field, but using the interannual ECMWF heat fluxes rather than the climatology of years 1986–1988. It results from a
Fig. 1. Map of the north Brazilian zone. Dots are the locations of the CTD stations. Surface and subsurface currents area repre-sented by solid and dashed lines, respectively. NBC – North Brazil Current, NECC – North Equatorial Countercurrent, SEC – South Equatorial Current, EUC – Equatorial Undercurrent, NEUC – North Equatorial Undercurrent, NEC – North Equatorial Current. Isobaths 20 m, 100 m and 2000 m depth are also represented. The alongshore solid straight gray line indicated the position vertical distributions in Fig. 2.
linearisation of bulk formulae and is therefore very close to the bulk formulation of Miami Isopycnic Model – MICOM (Garraffo et al., 2003). The evaporation minus precipitation (E-P) fuxes are formulated as a pseudo salt flux, including river run-off (Treguier et al., 2001); a relaxation of surface salinity to climatology with the same coeficient as the SST is added to the flux.
The vertical z-level grid has 42 levels for temperature, salinity and velocity points, with a grid spacing varying from 12 m at the surface to 200 m below 1500 m. The model run used herein has been particularly focused on Equatorial At-lantic studies, and the mixing parameterization chosen after a series of simulation tests in order to reproduce the EUC in the best way (Michel and Tr´eguier, 2002). Arhan et al. (2006) used the same simulation to diagnose the annual cycle of the EUC. Gulev et al. (2007) have analyzed the water mass trans-formation in coarse (1◦) and high (1/6◦) resolution ocean
simulations with the identical configuration of the CLIPPER model and interannual ERA15 forcing function.
3 Results
3.1 Vertical distribution – transect analysis (T, S)
For a better visualization and interpretation of the thermo-haline characteristics in the study region, in particular the formation of depression at the isopycnal structure, vertical temperature transects are presented (Fig. 2).
High temperature values are observed everywhere in the surface layer. Below this layer, one can observe be-yond 150 m the presence of a depression structure on the isotherms, associated with two cores of salinity maximum, resulting in the heating of the waters below 150 m (Fig. 2a, c, e and g). The model results and hydrographic measurements also show waters with maximum temperature (≥28◦
C) in the 50 first meters of the water column. These maximum of tem-perature are influenced by freshwater plumes associated with the Amazon river discharge (Fig. 2c, f, g and h).
In order to describe the penetration of Salinity Maximum Waters (SMW) originating in the Southern Hemisphere to-ward the Northern Hemisphere through the NBC/NBUC sys-tem in the studied area, we present, for each cruise, ver-tical salinity sections along transects almost parallel to the coast line. These data are compared to CLIPPER model re-sults for the same periods and positions, i.e. along the mean northwestward route of the NBC/NBUC system (Fig. 3). These transects are located between the longitudes 50◦
W and 40◦
W (Fig. 1). The results show that even if observed SMW values are higher than the simulated values, the model follows a tendency similar to the hydrographical observa-tions.
These sections first allow us to observe the maximum of salinity located around 100 m depth, signature of the sub-tropical underwaters formed in the subtropics (Worthington, 1976), that may be due to the presence of either North At-lantic Water (NAW) or South AtAt-lantic Water (SAW). For each cruise, different salinity maximum cores may be identi-fied around 24.5 kg m−3.
During March–May 1995, two cores of maximum salinity (≥36.6) are present at the thermocline level (Fig. 3a). The first core is located at the longitudes of 49◦W–46◦W,
be-tween the depths of 90 m and 170 m. Its western edge is associated with a strong deepening of the deep isopycnals over a very short distance. The second core is found east of 44.7◦
W, centred around 100 m depth, with a maximum of salinity higher than 37 east of 42◦
W. Model simulations also indicated a core of maximum salinity (≥36.2) at longitude 45◦
W–41◦
W for this same period, always centred around 100 m depth (Fig. 3b).
During May–June 1999 (Fig. 3c), a core of maximum salinity (≥36.6) is found between 49.5◦W and 48◦W, at
depths of 100–170 m. East of 44◦W, another maximum
salinity is found centred at about 100 m depth, with a well identified salinity core (>36.8) around 42◦
W. Below these salinity cores, isopycnals in the range of 26.25–26.75 kg m−3
are anomalously deep, although on a lesser scale than that ob-served during March–May 1995 described above (Fig. 3a). Model outputs confirm the presence of salty waters (≥36.6) at longitudes 44◦W–45◦W, as well as east of 42◦W, both
in the range of 100–170 m depth (Fig. 3d). East of 48◦W
the model results show a salinity core (≥36.0) at depths of 100–170 m.
During July–August 2001 (Fig. 3e), we may note the pres-ence of four maximum salinity cores around 24.5 kg m−3,
located between 49.5◦
–48.5◦
W, 48◦
–46.5◦
W, 46◦
–45.5◦
W, and 45◦–42◦W, and a low salinity lens closer to the sea
sur-face between 50◦W and 48◦W (Fig. 3f), which is also
ob-served in the hydrographic data (Fig. 3c).
All these salinity cores, although less marked for the last one, are associated with deepening of underlying isopycnals. Model results did not underline high salinity cores around 24.5 kg m−3 but a deepening of isopycnals around 44◦
W. One particular result of the modelling is the presence of low salinity waters between 50◦
–49◦
W, above 50 m depth (Fig. 3f).
During October–November 1997 (Fig. 3g), we can also observe a salinity maximum vein located around the 100 m– 150 m depth range all along the transect, with a maximum core (>36.6) east of 44◦W. Belowσ
θ=26.25 kg m−3,
deep-ening of the isohalines is observed around 48.5◦W, 45.5◦W
and 42◦W. At 48◦W, this deepening is very pronounced,
as illustrated with the 26.75 and 27.0 isopycnals behaviour. These features exhibit similarities with those found during March–May 1995 and May–June 1999 (Fig. 3a and c). The model simulation in this period also registered low salinity water above 50 m depth west of 48◦
W (Fig. 3h), as observed from the cruise data (Fig. 3g). Previous studies have shown that these low salinity surface waters between 6◦N and 10◦N
may be incorporated in rings and retroflected eastward dur-ing summer and fall (Johns et al., 1990, 1998, 2003).
The salinity cores observed in the southeast of the tran-sects (east of 44◦W in Fig. 3) may only be due to the
signa-ture of the NBC/NBUC system, penetrating into the region from the south and transporting northward SAW formed in the South Atlantic subtropical gyre (Metcalf and Stalcup, 1967; Cochrane et al., 1979; Schott et al., 1995; Bourl`es et al., 1999b). Concerning the maximum salinity cores ob-served west of 52◦
W, it is not possible at this stage to de-termine if they are due to: (i) the NBUC continuation after being partly diverted eastward and separated from the coast, (ii) rings separated from the NBC retroflection, transporting SAW northward, or (iii) signature of NAW within a south-eastward penetration of the WBUC in the region.
3.2 Horizontal distributions alongσθ=24.5 kg m−3
These in situ data are compared with numerical 5-day av-eraged snapshots of horizontal velocity and salinity charts obtained with the CLIPPER model onσθ=24.5 kg m−3
Fig. 2. Vertical distribution of temperature from the surface down to 500 m depth along transects almost parallel to the coast is indicated by a solid straight gray line (see Fig. 1) during REVIZEE cruises from field data and CLIPPER model results: (a)hydrographic data for March–May 1995,(b)model results for March–May 1995,(c)hydrographic data for May–June 1999,(d)model results for May–June 1999, (e)hydrographic data for July–August 2001,(f)model results for July–August 2001,(g)hydrographic data for October–November 1997 and(h)model results for October–November 1997. The superimposed dashed lines (white) indicate the depth of theσθ=24.5, 26.25, 26.75 and 27.70 kg m−3. In the left panels, inverted (black) triangles represent the location of hydrological stations during the cruises. In the right
Fig. 3. Vertical distribution of salinity from the surface down to 500 m depth along transects almost parallel to the coast is indicated by a solid straight gray line (see Fig. 1) during REVIZEE cruises from field data and CLIPPER model results: (a)hydrographic data for March–May 1995,(b)model results for March–May 1995,(c)hydrographic data for May–June 1999,(d)model results for May–June 1999, (e)hydrographic data for July–August 2001,(f)model results for July–August 2001,(g)hydrographic data for October–November 1997 and(h)model results for October–November 1997. The superimposed dashed lines (white) indicate the depth of theσθ=24.5, 26.25, 26.75 and 27.70 kg m−3. In the left panels, inverted (black) triangles represent the location of hydrological stations during the cruises. In the right
November 1997, i.e. during the same periods of the cruises (Fig. 4).
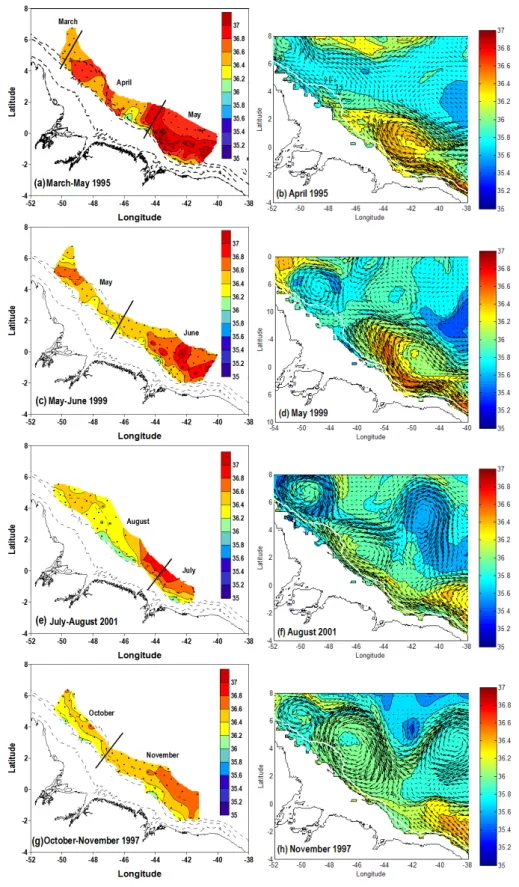
Hydrographic observations obtained during March–May 1995 show the presence of Salinity Maximum Water – SMW (≥36.6) east of 45◦W (Fig. 4a). Model results for April 1995
confirm the presence of SMW, within a loop pattern that sug-gests the presence of the retroflection of the NBC feeding the EUC around 43◦W–1◦N (Fig. 4b). The observed
salin-ity maximum distribution appears within a curving structure that is in good agreement with an eastward deviation of the SAW through the NBC retroflection. Farther in the north-west, the CLIPPER model results suggest that the relative salinity maximum observed around 48◦
W–4◦
N is due to the presence of SAW, entrained from the NBC retroflection area by a partial northwestward NBC continuation.
Observations conducted during May–June 1999 reveal the presence of SMW east of 44◦W (Fig. 4c). The model
simula-tion for May also indicates a high contribusimula-tion of SMW at the same location within a loop structure (Fig. 4d). Such a dis-tribution along with the simulated currents clearly shows the retroflection of the NBC around 44◦W–2◦N, in very good
agreement with the field measurements. The simulation also clearly indicates the presence of a ring around 50◦W–6◦N,
with the presence of a relative salinity maximum along its northern edge.
In July–August 2001 the horizontal distribution of salinity confirms the presence of SMW between 45◦
W and 42◦
W, as well as the presence of lower salinity structures along the shelf break (Fig. 4e). Model results for August 2001 indicate that the intense NBC continues northwestward, associated with relatively high values of salinity (>36.0) trapped along the shelf break (Fig. 4f). Model outputs show NBC retroflec-tion around 48◦W–4◦N, that feeds the eastward NECC,
well simulated with a meandering structure around 42◦W, in
agreement with earlier observations (e.g. Schott et al., 1998; Bourl`es et al., 1999b). The model also indicates the presence of an anticyclonic ring with relatively salty waters centred at 50◦W–7◦N, in good agreement with the higher salinity
measured around 5◦
N during the REVIZEE cruise. These results and circulation features well agree with previous de-scriptions and analysis for the months of August–November in this area, that show the northwestward entrainment of the NBC retroflection during a NBC retroflection formation and shedding, when the NBC is intensified (Johns et al., 1990; Bourl`es et al., 1999b; Garzoli et al., 2004).
Cruise observations conducted in October–November 1997 reveal once again the presence of SMW from the South-ern Hemisphere, with the highest concentration values mea-sured between 43◦W and 41◦W (Fig. 4g). Salinity
mea-surements also indicate the presence of small lens structures along the shelf break area. These lens structures are associ-ated with vertical disturbance of the halocline positions (be-tween 24.5 and 26.25 kg m−3, see Fig. 3h). Modeling results
also indicate the presence of SMW in the eastern part of the study area, i.e. east of 43◦
W, associated with an anticyclonic
circulation attributable to a retroflection of the NBC (Fig. 4g and h). The relatively high salinity concentrations observed farther in the northwest are associated with a large ring-like structure located about 48◦W–5◦N, transporting SMW on
its boundaries. It is not clear if this structure should be at-tributed to a NBC retroflection ring (as suggested by the ab-sence of a continuous northwestward flow off the continental shelf around 44◦W) or to the NBC retroflection itself.
3.3 Seasonal and interannual variability
The model output results for January–March 1997 and January–March 1999 (Fig. 5a–b and Fig. 6a–b), demonstrate that a large part of the SMW is transported by the NBUC northwestwards along the shelf break (towards the North Brazilian Shelf) reaching the longitude of 50◦W, where it
suffers an eastward deviation (near 7◦N, 50◦W). Another
important feature registered by the model is the presence of SMW, originated from the Northern Hemisphere, which is diverted eastward near 7–8◦N by the retroflection of the
NBC/NBUC, feeding the NEUC. These results are also con-firmed through the REVIZEE oceanographic campaigns car-ried out in March–May 1995 (Fig. 4a).
CLIPPER model results during April–June 1997 and April–June 1999 (Fig. 5c–d and Fig. 6c–d), demonstrate the existence of NBUC retroflection, located 44◦
W–46◦
W, which transports a high contribution of SMW coming from the South Atlantic along the North Brazilian coast into the EUC or NEUC. These retroflections were also observed by Schott et al. (1998); Molinari and Johns (1994); recorded for 1/12 deg modelling (MICOM) Garraffo et al. (2003) and 1/12 deg (FLAME) Stramma et al., 2005, and similar to those found by Barnier et al. (2001).
During July–September 1997 and July–September 1999 (Fig. 5d–e and Fig. 6d–e), an increase in the NBUC flow was recorded, causing in response an intensification in the for-mation of subsurface rings at the 50◦–52◦W. These rings are
formed by the retroflection of the NBUC into the NEUC. At the edges of these rings, a great part of SMW coming from the South Atlantic is transported westward. In the centre of these rings the SMW originates from the South Atlantic. According to Johns et al. (1990) and Bourl`es et al. (1999a) the southeastward undercurrent WBUC has been observed to flow along the boundary from the eastern Caribbean to also join the NEUC.
During this period the retroflection of the NBUC was ob-served further north, approximately at 6◦N, that could be
linked to the current system, when the NBC transport is high (low), the retroflection occurs further northwest (southeast) as shown by Garzoli et al. (2004).
Fig. 4.Horizontal distribution of salinity and velocity during REVIZEE cruises and from CLIPPER model results alongσθ=24.5 kg m−3:
intrusion of the WBUC or NEC recirculation which joins to the NBC/NBUC retroflection.
This analysis indicates the presence of SMW flow between 5◦–8◦N in the area of waters originated from the Northern
Hemisphere, which could feed the EUC. This suggests that if the EUC is fed by Northern Atlantic Waters, this contribution may occur in the ocean interior, east of the western boundary.
4 Discussion
This study allowed us to examine subsurface hydrology and circulation off the Northern Brazil. High resolution hy-drographic observations from four cruises carried out in different periods of the year (March–May 1995, October– November 1997, May–June 1999 and July–August 2001) were complemented by modelling results to obtain additional information about the salty water masses and mesoscale transport variability in this area. Previous studies have been either limited to the shelf region (e.g. AMASSEDS Program, Lentz and Limeburner, 1995) or focused on large scale ocean circulation (e.g. Schott et al., 1998; Bourl`es et al., 1999a, b). The hydrographic data obtained during all oceanographic cruises showed the presence of Salinity Maximum Wa-ter (SMW) atσθ=24.5 kg m−3 between 45◦
W and 40◦
W. Model results for these same periods confirm that a large part of this SMW is transported by the NBC northwestward along the shelf break (parallel to the North Brazilian shelf). An-other part of the South Atlantic waters are diverted eastward by the retroflection the NBC/NBUC feeding the EUC and the NEUC (Schott et al., 1998; Bourl`es et al., 1999a). Nu-merical output also confirmed that during April 1995 only a small fraction of the NBC flows along the Brazilian coast, as previously showed by Bourl`es et al. (1999b).
An interesting result of this paper is the space and time variability of the presence of SMW from the Northern Hemi-sphere, which contributes to feed the NEUC or EUC in the study area as revealed by both in-situ data and model results. if the EUC is fed by Northern Atlantic Waters, this contri-bution may occur in the ocean interior, east of the western boundary.
In fact, the southeastward WBUC has been observed to flow along the boundary from the eastern Caribbean to also join the NEUC (Johns et al., 1990; Bourl`es et al., 1999a). However Bourl`es et al. (1999a), based on hydrographic ob-servations, suggest that the EUC is not fed by the Northern Hemisphere waters west of 44◦
W, while Schott et al. (1998) and Goes et al. (2005) found indications about the pres-ence of northern waters feeding the EUC between 35◦W
and 44◦W. Seasonal and interannual model results along
σθ=24.5 kg m−3showed the presence of SMW eastward
be-tween 5◦–8◦N (more significantly during January–March
1999 and October–December 1997).
CLIPPER model results along σθ=24.5 during all
sea-sons suggest that the SMW coming from the north Atlantic
is transported through the boundaries of rings (near 8◦N),
while the SMW coming from the South Atlantic are trans-ported within the core of the rings during their northwest-ward displacement (Figs. 4 and 5). Johns et al. (2003) de-scribed in the region the presence of intensified subsurface rings above the thermocline but without any signature at the surface. These structures were also reproduced in the numerical modelling works of Barnier et al. (2001), Gar-raffo et al. (2003), and Stramma et al. (2005). More re-cent observations of the North Brazil Current Rings (NBCR) Experiment (Johns et al., 2003) confirmed the existence of a hierarchy of surface and subsurface NBC rings between 60◦
W and 50◦
W, transporting SAW on the ring core and NAW on its boundaries. Our field and numerical results for May 1999 and November 1997 indicate that the WBUC is always diverted eastward either by the rings associated to NBC/NBUC retroflection, or by the retroflection itself. In both cases, these salty northern waters do not return to the western boundary.
We have seen from field data that the salty water masses are brought from subtropical regions to the study area as-sociated with isopycnal anomalies in some specific ocean places between 50◦W–40◦W. Johns et al. (2003) used
ADCP/LADCP/CTDO2data to show the presence of rings
between 60◦
W–50◦
W, during four cruises of the NBCR Experiment. These authors noted that all observed surface rings were marked by a weak depression located at the cen-tre of the thermocline around 50–75 m. Vertical displace-ments of isopycnals were also observed during all REVIZEE cruises. During March–May 1995, for example, a subsur-face core of maximum salinity (≥36.6) is present in field data between 43◦W and 41◦W. This maximum salinity core
is connected to the presence of depressional structures on
σθ=26.25, 26.75 and 27.0 kg m−3(Fig. 3a), probably the
sig-nal of the retroflection. At the same time, model results for April 1995 indicate an important NBC retroflection in this ocean area during the same period (Fig. 4b). These interac-tions can be generated by NBC/NBUC retroflection, which may induce ring formation, as well as by the action of baro-clinic Rossby waves along the Amazonian shelf break region (Jochum and Malanotte-Rizzoli, 2003). The available field observations are not yet sufficient to explain the rings’ gen-esis and to distinguish the specific effects of each mecha-nism. Meantime temporal series of field hydrographic and current data obtained from mooring devices placed at some sites along the shelf break are still necessary to assess some of these open questions about this complex key area of the Atlantic Ocean.
5 Conclusion
Fig. 5. Seasonal distribution of salinity and velocity from CLIPPER model results at 100 m depth for: (a)January 1997,(b)March 1997, (c)May 1997,(d)July 1997,(e)September 1997 and(f)November 1997. Dashed lines represent the isobath 2000 m.
principally in order to describe the penetration of waters originating in the Southern Hemisphere toward the Northern Hemisphere through the NBC/NBUC system.
Vertical salinity sections along transects almost parallel to the coast line, located between the longitudes 50◦W and
40◦W, show that core of maximum salinity (≥36.6) are
present at the thermocline level during each cruise. Dif-ferent salinity maximum cores may be identified around the 24.5 kg m−3 isopoycnal. For example, during March–
May 1995 a subsurface core of maximum salinity (≥36.6) is present in field data between 43◦
W and 41◦
W. In the same place one can observe the presence of a depression structure
on the isotherms, resulting in the heating of the waters below 150 m. Model simulations also indicate a core of maximum salinity (≥36.2) at longitude 45◦
W–41◦
W for this same pe-riod, always centred around 100 m depth.
Seasonal and interannual hydrographic observations and model results along σθ=24.5 kg m−3 also show the
pres-ence of SMW toward the Northern Hemisphere through the NBC/ NBUC. Model results also highlight the pres-ence of SMW eastward between 5◦–8◦N (more significantly
Fig. 6. Seasonal distribution of salinity and velocity from CLIPPER model results at 100 m depth for: (a)January 1999,(b)March 1999, (c)May 1999,(d)July 1999,(e)September 1999 and(f)November 1999. Dashed lines represent the isobath 2000 m.
(around 48◦W–3◦N). One other important point to be
high-lighted from the model results is that, during all the seasons, the SMW coming from the north Atlantic are transported through the boundaries of rings (near 8◦N), while the SMW
coming from the South Atlantic are transported within the core of the rings during their northwestward displacement. Acknowledgements. This work was supported by CAPES/BRAZIL (Coordination for the Improvement of Higher Education Personnel, Bras´ılia, Brazil) and Institut de Recherche pour le D´eveloppement (IRD). It has been in part carried out during a one year visit of the first author to the IRD Centre of Brest (France). We thank Anne Marie Tr´eguier for providing the CLIPPER model results
(Laboratoire de Physique des Oc´eans/Brest-France). The first au-thor acknowledges French colleagues (including the engineers, technicians and scientists) for their support and scientific discus-sions. Special thanks to Maˆamar El-Robrini (UFPA), as well as the scientific and crew members of the R/V Antares(DHN/Brazilian Navy), for their effort and dedication during REVIZEE oceano-graphic cruises.
References
Arhan, M., Treguier, A. M., Bourl`es, B., and Michel, S.: Di-agnosing the annual cycle of the Equatorial Undercurrent in the Atlantic Ocean from a General Circulation model, J. Phys. Oceanogr., 36(8), 1502–1522, doi:10.1175/JPO2929.1, 2006. Barnier, B., Reynaud, T., Beckmann, A., Boning, C., Molines,
J.-M., Barnard, S., and Jia, Y.: On the seasonal variability and eddies in the North Brazil Current: insight from model inter-comparison experiments, J. Progress in Oceanogr., 44, 195–230, 2001.
Bourl`es, B., Molinari, R. L., Johns, E., Wilson, W. D., and Leaman, K. D.: Upper layer currents in the western tropical North Atlantic (1989–1991), J. Geophys. Res., 104, 1361–1375, 1999a. Bourl`es, B., Gouriou, Y., and Chuchla, R.: On the circulation in the
upper layer of the western equatorial Atlantic, J. Geophys. Res., 104, 21151–21170, 1999b.
Comiss˜ao Interministerial para os Recursos do Mar: IV Plano Se-torial para os recursos do mar (1994–1998), Bras´ılia-DF: 19 p., 1994.
CLIPPER Project team: 1/6 Atlantic Circulation model forced by the ECMWF clymatology: preliminary results, LEGI report number CLIPPER-R2-2000, also available at www.ifremer.fr/ lpo/clipper, access: 17 March 2009.
Cochrane, J. D., Kelly, F. J., and Olling, C. R.: Subtermocline countercurrents in the western equatorial Atlantic Ocean, J. Phys. Oceanogr., 9, 724–738, 1979.
Didden, N. and Schott, F.: Eddies in the North Brazil Current retroflection region observed by Geosat altimetry, J. Geophys. Res., 98, 20121–20131, 1993.
Fratantoni, D. M., Johns, W. E., and Townsend, T. L.: Rings of the North Brazil Current: Their structure and behavior inferred from observations and numerical simulation, J. Geophys. Res., 100(C6), 10633–10654, 1995.
Garraffo, Z. D., Johns, W. E., Chassignet, E. P., and Goni, G. J.: North Brazil Current rings and transport of southern water in a high resolution numerical simulation of the North Atlantic, in: Interhemispheric Water Exchanger in the Atlantic Ocean, edited by: Goni, G. J. and Malanotte-Rizzoli, P., Elsevier Oceano-graphic Series, 68, 375–409, 2003.
Garzoli, S. L., Ffield, A., and Yao, Q.: NBC retroflection and rings, in: Interhemispheric Water Exchanger in the Atlantic Ocean, El-sevier Oceanographic Series, 68, 357–374, ISBN 0-444-51267-5, 2003.
Garzoli, S. L., Ffield, A., Johns, W. E., and Yao, Q.: North Brazil Current retroflection and transports, J. Geophys. Res., 109, CO1013, doi:10.1029/2003JC001774, 2004.
Goes, M., Molinari, R., da Silveira, I., and Wainer, I.: Retroflec-tion of the North Brazil Current during February 2002, Deep-Sea Res., 52, 647–667, 2005.
Gordon, A. L.: Interocean exchanger of thermocline water, J. Geo-phys. Res., 91, 5037–5046, 1986.
Gulev, S. K., Barnier, B., Molines, J.-M., Penduff, T., and Chanut, J.: Impact of spatial resolution of simulated surface water mass transformation in the Atlantic, Ocean Model., 19, 138–160, 2007.
Jochum, M. and Malanotte-Rizzoli, P.: On the generation of North Brazil Current Rings, J. Mar. Res., 61/2, 147–162, 2003. Johns, W. E., Lee, T. N., Schott, F. A., Zantopp, R. J., and Evans,
R. H.: The North Brazil Current retroflection: seasonal structure
and eddy variability, J. Geophys. Res., 95(C12), 22103–22120, 1990.
Johns, W. E., Beardsley, R. C., Candela, J., Limeburner, R., and Castro, B.: Annual cycle and variability of the North Brazil Cur-rent, J. Phys. Oceanogr., 28, 103–128, 1998.
Johns, W. E., Zantopp, R. J., and Goni, G. J.: Cross-gyre watermass transport by North Brazil Current Rings, in: Interhemispheric Water Exchanger in the Atlantic Ocean, edited by: Goni, G. J. and Malanotte-Rizzoli, P., Elsevier Oceanographic Series, 68, 411–441, ISBN 0-444-51267-5, 2003.
Lentz, S. and Limeburner, R.: The Amazon river plume during AMASSEDS: Spatial characteristics and salinity variability, J. Geophys. Res., 100(2), 2355–2375, 1995.
Madec, G., Delecluse, P., Imbard, M., and Levy, C.: OPA 8.1 gen-eral circulation model reference manual, Notes de l’IPSL, Uni-versit´e P. et M. Curie, B102 T15-E5, 4 place Jussieu, Paris cedex 5, No. 11, 91 pp., 1998.
Metcalf, W. and Stalcup, M. C.: Origin of the Atlantic Equatorial Undercurrent, J. Geophys. Res., 72, 4959–4975, 1967.
Michel, S. and Tr´eguier, A. M.: Sensitivity of the Equatorial Un-dercurrent to mixing parameterisations in the CLIPPER model, Rapport DRO/LPO no. 02-16, 35 pp., 2002.
Molinari, R. L. and Johns, E.: Upper layer temperature structure of the western tropical Atlantic, J. Geophys. Res., 99, 18225– 18233, 1994.
Reynaud, T., Legrand, P., Mercier, H., and Barnier, B.: A new anal-ysis of hydrographic data in the Atlantic and its application to an inverse modelling study, International WOCE Newsletter, 32, 29–31, 1998.
Richardson, P. L., Hufford, G., Limeburner, R., and Brown, W.: North Brazil Current retroflection eddies, J. Geophys. Res., 99, 5081–5093, 1994.
Schmitz, W. J. and Mccartney, M. S.: On the North Atlantic circu-lation, Rev. Geophys., 31(1), 29–49, 1993.
Schott, F. A. and B¨oning, C. W.: The WOCE model in the western equatorial Atlantic: Upper layer circulation, J. Geophys. Res., 96, 6993–7004, 1991.
Schott, F. A., Stramma, L., and Fischer, J.: The warm water inflow into the western tropical Atlantic boundary regime, spring 1994, J. Geophys. Res., 100(C2), 24745–24760, 1995.
Schott, F. A., Fischer, J., and Stramma, L.: Transport and pathways of the upper-layer circulation in the western tropical Atlantic, J. Phys. Oceanogr., 28, 1904–1928, 1998.
Silva, A. C., Araujo, M., Medeiros, C., Silva, M., and Bourl`es, B.: Seasonal changes in the mixed and barrier layers in the western equatorial Atlantic, Brazilian Journal of Oceanography, 53(3/4), 83–98, 2005a.
Silva, A. C., Araujo, M., and Bourl`es, B.: Variabilidade Sazonal da Estrutura de Massas de ´Agua na Plataforma Continental do Ama-zonas, Brazilian Journal of Geophysics, 23(2), 145–157, 2005b. Stramma, L., Rhein, M., Brandt, P., Dengler, M., Boning, C., and
Walter, M.: Upper ocean circulation in the western tropical At-lantic in boreal fall 2000, Deep-Sea Res., 52, 221–240, 2005. Treguier, A. M., Barnier, B., de Miranda, A. P., Molines, J. M.,
Grima, N., Imbard, M., Madec, G., Messager, C., Reynaud, T., and Michel, S.: An eddy permitting model of the Atlantic Circu-lation: evaluating open boundary conditions, J. Geophys. Res., 106, 22115–22129, 2001.
circula-tion in the western tropical north Atlantic ocean during August 1989, J. Geophys. Res., 99, 22513–22523, 1994.
Wilson, W. D., Johns, W. E., and Garzoli, S. L.: Velocity structure of North Brazil Current rings, Geophys. Res. Lett., 29(8), 1273, doi:10.1029/2001GL013869, 2002.