www.hydrol-earth-syst-sci.net/13/2273/2009/ © Author(s) 2009. This work is distributed under the Creative Commons Attribution 3.0 License.
Earth System
Sciences
Solid phase evolution in the Biosphere 2 hillslope experiment as
predicted by modeling of hydrologic and geochemical fluxes
K. Dontsova1,2, C. I. Steefel3, S. Desilets4, A. Thompson5, and J. Chorover1,2
1B2 Earthscience, The University of Arizona, Tucson, AZ, USA
2Department of Soil, Water & Environmental Science, The University of Arizona, Tucson, USA 3Earth Sciences Division, Lawrence Berkeley National Laboratory, Berkeley, CA, USA
4Department of Hydrology and Water Resources, The University of Arizona, Tucson, AZ, USA 5Department of Crop and Soil Sciences, University of Georgia, Athens, GA, USA
Received: 24 May 2009 – Published in Hydrol. Earth Syst. Sci. Discuss.: 18 June 2009 Revised: 23 October 2009 – Accepted: 6 November 2009 – Published: 1 December 2009
Abstract. A reactive transport geochemical modeling study was conducted to help predict the mineral transformations occurring over a ten year time-scale that are expected to im-pact soil hydraulic properties in the Biosphere 2 (B2) syn-thetic hillslope experiment. The modeling sought to predict the rate and extent of weathering of a granular basalt (se-lected for hillslope construction) as a function of climatic drivers, and to assess the feedback effects of such weathering processes on the hydraulic properties of the hillslope. Flow vectors were imported from HYDRUS into a reactive trans-port code, CrunchFlow2007, which was then used to model mineral weathering coupled to reactive solute transport. As-sociated particle size evolution was translated into changes in saturated hydraulic conductivity using Rosetta software. We found that flow characteristics, including velocity and satura-tion, strongly influenced the predicted extent of incongruent mineral weathering and neo-phase precipitation on the hill-slope. Results were also highly sensitive to specific surface areas of the soil media, consistent with surface reaction con-trols on dissolution. Effects of fluid flow on weathering re-sulted in significant differences in the prediction of soil par-ticle size distributions, which should feedback to alter hills-lope hydraulic conductivities.
Correspondence to:K. Dontsova
1 Introduction
The goal of the Biosphere 2 (B2) institutional hillslope ex-periment is to help develop an understanding of how climate, rock and biota interact over time to influence hillslope struc-ture formation, and its impact on the movement of water in the landscape (Huxman et al., 2009). In order to address the coupled processes involved, three replicated, zero-order wa-tersheds (hillslopes) were designed (Hopp et al., 2009) and are now under construction. The hillslopes will comprise a loamy-sand textured granular basalt as the starting material. Basalt lithology was chosen because of (i) the global signif-icance of basalt to CO2consumption in silicate weathering
(Suchet et al., 2003) (ii) the relatively high rate of chemical weathering for basalt mineral assemblages (Nesbitt and Wil-son, 1992), and (iii) the large mass concentrations of nutrient cations whose dissolution can effectively support microbial and plant life (Hinsinger et al., 2001).
One process coupling of particular interest is that be-tween hydrologic flow path evolution and mineral weath-ering. Since rock-forming primary silicates are thermo-dynamically unstable at Earth surface conditions, they are transformed to more stable secondary minerals, typically of smaller particle size and lesser crystallinity (Nordstrom and Munoz, 1994). The rates of these reactions and the nature of solid phase products are dictated by the through-flux of fresh water and dissolved or gaseous dioxygen (O2). The rate of
An important question is whether significant structural change will occur in the hillslope porous media over the assumed 10 year lifespan of the experiment. A key com-ponent of structural change is the incipient dissolution of the initial primary mineral assemblage, and the resulting precipitation of neoformed, “secondary” solids. These pri-mary to secondary mineral transformations (termed “incon-gruent” weathering reactions when they result in the forma-tion of solid-phase mineral products) tend to shift the particle size distribution to smaller values because the newly-formed, clay-sized particles accumulate at the expense of primary sand and silt sized materials (Sposito, 2008). Increasing the proportion of fine particles generally increases water hold-ing capacity and decreases saturated hydraulic conductivity. While prior chronosequence studies have indicated the ef-fects of long-term pedogenesis on the hydrologic behavior of soils (Lohse and Dietrich, 2005), the B2 hillslope experiment provides an opportunity to observe these coupled processes in real time as affected by well-constrained climatic and veg-etative forcings.
Since dissolution-precipitation reactions are rate-limited, they tend to occur non-uniformly in the hillslope, with ki-netics being dependent on the local relative saturation of the aqueous phase with respect to both dissolving and precipi-tating mineral solids, i.e., the “chemical affinity” (Oelkers, 2001). As chemical weathering drives the particle size dis-tribution to smaller values, this will also affect the hydraulic conductivity and surface chemistry of the soil medium, with potentially important feedbacks on subsurface flow path evo-lution, nutrient and organic matter retention, etc. For exam-ple, incongruent dissolution of primary silicates to form layer silicate clays and oxyhydroxides can facilitate plant growth by (i) solubilizing many lithogenic nutrients required for mi-crobial and plant growth, as well as by (ii) producing ad-ditional reactive surface area for the adsorptive retention of nutrient cations (e.g., Ca2+, Mg2+, and K+) and organic molecules (humic substances and biomolecules). In addi-tion, this incongruent dissolution can (iii) affect the devel-opment of subsurface heterogeneity (e.g., soil profile hori-zonation) which, in turn, (iv) feeds back to affect water trans-port paths and plant establishment along the hillslope. Such biogeochemical-hydrologic couplings are considered funda-mental to the evolution of structure in the Earth’s “Critical Zone” (Chorover et al., 2007; Brantley et al., 2006), de-fined as the region of the Earth’s surface extending from the outer periphery of the vegetation canopy to the lower lim-its of groundwater (NRC, 2001). The evolution of Critical Zone structure and function in response to climatic forcing is a principal focus of Earth science research at Biosphere 2.
Our present objective is to predict the time scale over which significant chemical-weathering-induced changes will occur in the B2 hillslopes. In this contribution, we use the reactive transport code CrunchFlow2007 (Steefel, 2008) to evaluate the effects of geochemical weathering on the evo-lution of the soil mineral assemblage and the associated
particle size distributions. A number of reactive transport models can be used to predict chemical weathering in soils and bedrock, e.g., SAFE (Sverdrup et al., 1995), WITCH (Godd´eris et al., 2006), and CrunchFlow (Steefel and Van Cappellen, 1990; Steefel and Maher, 2009; Maher et al., 2006, 2009; Soler and Lasaga, 1998). CrunchFlow2007, which is the result of 20 years of development in multicom-ponent reactive transport software, was chosen for the simu-lations because of its successful use in the past for modeling of chemical weathering and water-rock interaction (Steefel and Van Cappellen, 1990; Steefel and Lasaga, 1994; Steefel and Lichtner, 1998; Soler and Lasaga, 1998; Steefel and MacQuarrie, 1996; Giambalvo et al., 2002; Maher et al., 2006, 2009; Steefel and Maher, 2009).
The code CrunchFlow2007 solves the multicomponent re-active transport equation given by
∂ (φCi)
∂t =∇·(φDi∇Ci)− ∇·(φ
uCi)−
N r X
r=1
νirRr− Nm X
m=1
νimRm (1)
where φ is the porosity, C is the concentration of the ith primary species, D is the molecular diffusion coefficient in porous media, u is the velocity vector, and Rr and
Rm are the homogeneous (aqueous phase) and
heteroge-neous (mineral) reaction rates, respectively. The symbolν is the stoichiometric reaction coefficient (Steefel and Ma-her, 2009). The Supplementary material contains descrip-tion of CrunchFlow2007 software with examples of possible applications (see http://www.hydrol-earth-syst-sci.net/13/ 2273/2009/hess-13-2273-2009-supplement.pdf). Crunch-Flow2007 manual is available at http://www.csteefel.com/.
We explore the impacts of initial particle size (specific sur-face area of primary minerals) and climatic regime (trans-lated to flow rate and saturation degree) and assess the im-pact of chemical weathering on the time and space evolution of hydraulic conductivity. The study consists of two distinct parts: (1) an analysis of model sensitivity to selected param-eters that are expected to influence weathering in the hills-lope experiment and (2) predictions of hillshills-lope geochemical development under two proposed climatic regimes. The sen-sitivity analysis includes one-dimensional simulations evalu-ating effects of mineralogy, particle size (surface area), flow velocity, and dioxygen concentration on dissolution and pre-cipitation of minerals. Two-dimensional simulations of a hillslope cross-section were then used to predict changes in the constructed B2 hillslope soils.
2 Materials and methods
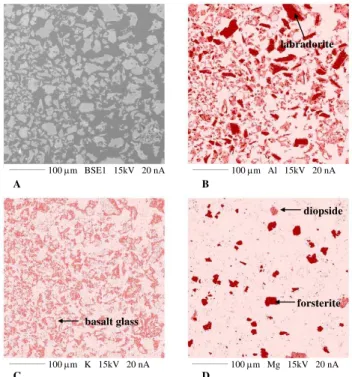
material was characterized for chemical and mineral com-position and physical properties using a range of analytical methods. Total elemental composition was determined us-ing lithium metaborate/tetraborate fusion followed by induc-tively coupled plasma mass spectrometry analysis (ICP-MS, Activation Laboratories Ltd., Ancaster, Ontario). Elemen-tal composition of individual minerals was determined us-ing microprobe analysis (Cameca SX50 electron microprobe, Gennevillier, France). From these data, mass fractions of the minerals were calculated using ModAn, a computer pro-gram for estimating mineral quantities based on bulk com-position (Paktunc, 2001). These concentrations were veri-fied by quantitative X-ray diffraction analysis (XRD) using a PANalytical X’Pert Pro MPD X-ray Diffractometer (PAN-alytical B.V., Almelo, The Netherlands) with Cu-Kα radi-ation (R2=0.88) that gave bulk values for the composi-tion of the crystalline minerals and by image analysis (Ar-cView GIS 3.2, Environmental Systems Research Institute, Inc., Redlands, California) of element distribution maps ob-tained by microprobe (Fig. 1) (R2=0.90).
Porous media particle size distribution was measured us-ing a Beckman Coulter LS 13 320 Laser Diffraction Particle Size Analyzer (Beckman Coulter, Inc., Fullerton, CA). Par-ticle density , was determined using the pycnometer method (Flint and Flint, 2002). The solid density is a direct input parameter in CrunchFlow2007, while the particle size distri-bution is indirectly used via the reactive or physical surface area. Surface area was measured by N2adsorption (Brunauer
et al., 1938) using a Beckman Coulter SA 3100 Gas Adsorp-tion Surface Area Analyzer (Beckman Coulter, Inc., Fuller-ton, CA).
Particle size distribution and surface area were measured on the basaltic material as received and on the same mate-rial following reconstitution for a loamy sand texture that emerged as preferred texture from hydrologic simulations (Hopp et al., 2009). The latter material was composed by sieving and remixing different size fractions of the original basalt to give a larger fraction of fine particles. Particle size of the basaltic material as received was 97.58% sand, 2.20% silt, and 0.22% clay, whereas that of the reconstituted loamy sand was 77.7% sand, 21.0% silt and 1.23% clay. Specific surface areas were 1.4 m2g−1as received and 3.2 m2g−1for
loamy sand. Measured particle density was 2.81 g cm−3.
Total elemental composition of basalt is characterized by the following mass percent of oxides: 47.8% SiO2, 16.3%
Al2O3, 11.6% Fe2O3, 0.19% MnO, 8.12% MgO, 9.84%
CaO, 2.93% Na2O, 0.77% K2O, 1.69% TiO2, 0.62% P2O5,
and 0.01% S. Estimated quantitative mineral composition for the basalt initial condition is listed in Table 1 under the head-ing “Primary Minerals”. Table 1 also contains dissolution equilibrium constant (logKSO), activation energy (Ea), and
kinetic rate coefficient (km)values for the following
dissolu-tion reacdissolu-tions, which parameterized the model (Wolery et al., 1990):
A
labradorite
B
basalt glass
C
forsterite diopside
D
_____________ 100 m Mg 15kV 20 nA _____________ 100 m K 15kV 20 nA
_____________ 100 m Al 15kV 20 nA _____________ 100 m BSE1 15kV 20 nA
Fig. 1. Back-scattered electron image(A)and elemental
distribu-tion maps for Al(B), K(C), and Mg(D)for the Flagstaff black basalt obtained via wavelength dispersive X-ray mapping using the Cameca SX-50 electron microprobe (15 kV accelerating voltage and 20 nA sample current, a beam size of 2µm). Basalt samples were embedded in epoxy resin and polished to a 3/4µm finish.
Labradorite:
Ca0.64Mg0.01Fe0.04Na0.35K0.01Al1.63Si2.34O8+6.63H+(R1) =0.64Ca2++0.01Mg2++0.04Fe2++0.35Na+ +0.01K++1.63Al3++2.34SiO2(aq)+3.32H2O
Diopside:
Ca0.86Mn0.01Mg0.77Na0.03Ti0.05Al0.25Fe0.26Si1.81O6 (R2) +4.44H+=0.86Ca2++0.01Mn2++0.77Mg2+
+0.03Na++0.26Fe2++0.25Al3++0.05Ti(OH)4(aq) +1.81SiO2(aq)+2.19H2O
Forsterite:
Mg1.47Ca0.01Mn0.01Fe.0.52Si0.99O4+4.02H+ (R3) =1.47Mg2++0.01Ca2++0.01Mn2++0.52Fe2+ +0.99SiO2(aq)+2.01H2O
Basalt glass:
Ca0.36Mg0.22Na0.16K0.09Mn0.01Fe0.49Al0.58Ti0.11 (R4)
(HPO4)0.05Si1.87O5.89+3.58H+=0.36Ca2+ +0.22Mg2++0.16Na++0.09K++0.01Mn2+
Table 1.Mineral composition and literature-derived equilibrium constants, logKSO(25◦C), dissolution rates (km), and activation energies (Ea) for primary mineral components of basaltic material and projected secondary minerals.
Mineral Composition Vol. logKSO Ea logkm
% (25◦C) kJ mol−1 moles m−2s−1
Primary
Labradorite −11.6m
(feldspar) Ca0.64Mg0.01Fe0.04Na0.35K0.01Al1.63Si2.34O8 35.87 18.20a 42.12e −12.99n
Diopside (pyroxene) Ca0.86Mn0.01Mg0.77Na0.03Ti0.05Al0.25Fe0.26Si1.81O6 6.53 20.38a 79f −10.2o
Forsterite (olivine) Mg1.47Ca0.01Mn0.01Fe.0.52Si0.99O4 11.94 25.34a 38g −10.4p
Basaltic glass Ca0.36Mg0.22Na0.16K0.09Mn0.01Fe0.49Al0.58Ti0.11(HPO4)0.05Si1.87O5.89 45.67 17.61b 25.5h −11.06h
Secondary
Fe(OH)2 Fe(OH)2 13.90c −7.9
Kaolinite Al2Si205(0H)4 8.55d 29.31i −12.89d
Smectite (Ca0.02, Na0.15, K0.2)(Al Mg0.9Fe0.29)2Si3.75Al0.25O10(OH)2 11.04c 52j −12.5j
Gibbsite Al(OH)3 7.76c 62.8k −11.66k
Pyrolusite Mn4+O2 −17.64c −11
Goethite Fe3+O(OH) 0.53c 23l −10
a Calculated using end member compositions from the EQ3/EQ6 database (Wolery et al., 1990), with Gibbs energy contribution from
entropy calculated assuming ideal mixing;b(Lelli et al., 2008);cEQ3/EQ6 database (Wolery et al., 1990);d(Yang and Steefel, 2008), rate recalculated fromT=22◦C;e(Carroll and Knauss, 2005);f(Berner et al., 1980);g(Grandstaff, 1980);h(Gislason and Oelkers, 2003), rate recalculated fromT=7◦C;i(Ganor et al., 1995);j(Cama et al., 2000), rate recalculated fromT=80◦C;k(Ganor et al., 1999);l(Cornell et al., 1975);m(van Hees et al., 2002);n(Hellmann and Tisserand, 2006), rate recalculated fromT=150◦C;o(Schott et al., 1981);p(Wogelius and Walther, 1991).
As discussed in the Results section, model output in-dicated precipitation of the secondary minerals: Fe(OH)2,
kaolinite, smectite, gibbsite, pyrolusite, and goethite, de-pending on conditions. Hence, also listed also in Table 1 are the data for logKSO,Ea, and logkm for the following
dissolution/precipitation reactions (Wolery et al., 1990): Iron (II) hydroxide:
Fe(OH)2+2H+=Fe2++2H2O (R5)
Kaolinite:
Al2Si205(0H)4+6H+=2Al3++2SiO2(aq)+5H2O (R6)
Smectite:
(Ca0.02,Na0.15,K0.2)(AlMg0.9Fe0.29)2Si3.75Al0.25O10 (R7)
(OH)2+7H+=0.02Ca2++0.15′Na++0.16Fe3+ +0.2K++0.29Fe2++0.9Mg2++1.25Al3+
+3.75SiO2(aq)+4.5H2O
Gibbsite:
Al(OH)3+3H+=Al3++3H2O (R8)
Pyrolusite:
Mn4+O2=0.5Mn2++0.5Mn6+O24− (R9)
Goethite:
Fe3+O(OH)+3H+=Fe3++2H2O (R10)
Dissolution rate constants (km)were obtained from the
lit-erature for the minerals measured in the basalt, and they are listed in Table 1. For data selection, preference was given to laboratory studies on the specific minerals found in the Flagstaff basalt. While laboratory rates tend to be greater than those derived from field data, weathering rates in the B2 hillslopes are expected to fall somewhere in between (Sver-drup and Warfvinge, 1995). Field rates are thought to be lower than laboratory rates, in part, because of diminished in-terfacial area and weathering-passivated surfaces that contact mobile water in structured soils. When installed as a poorly consolidated material devoid of preferential flow paths (at t=0), the B2 porous media will present higher interfacial area and more reactive (fresh unweathered) surfaces to per-colating water than is observed in typical field systems.
Literaturekmvalues obtained atT other than 298 K were
scaled using the Arrhenius relation (Lasaga, 1984): km,T=km,298exp
−E
a
R ( 1 T −
1 298.15)
(2) where Ea is activation energy, km,298 is the rate constant
at 298 K, R is the gas constant, and T is temperature in Kelvin scale. Mineral densities used for mineral mass con-version to volume fraction were 2.69 g cm−3
for labradorite, 3.27 g cm−3
for forsterite, 3.4 g cm−3
2.2 CrunchFlow2007 simulations
We used fluid flow output data from 3-D HYDRUS simula-tions (Hopp et al., 2009) of the “Lucky Hills” (Scott et al., 2000) and “Sky Island” (Brown-Mitic et al., 2007) climatic conditions as input hydrologic parameters for our Crunch-Flow2007 modeling. The CrunchCrunch-Flow2007 modeling objec-tives were (i) to determine the influence of selected physico-chemical parameters on mineral transformation rates in 1-D basalt soil columns, and (ii) to assess the influence on min-eral weathering of 2-D fluid flow in the vadose and saturated zones, including feedbacks to hydrologic flow. The 2-D sim-ulation represents the central axis of the zero-order hillslope studied by Hopp et al. (2009).
Simulation duration was 1000 days, with a steady state wa-ter infiltration for that period that gives a total rainfall equiv-alent to that expected over the course of the 14 to 18 year (depending on selected climate) B2 hillslope experiment. A porosity value of 0.41 was used based on an average value for the loamy sand textural class (Carsel and Parish, 1988). Pri-mary aqueous species (H+, Na+, Mg2+, Ca2+, NO−3, SO24−, Fe2+, K+, Al3+, SiO2(aq), HCO−3, O2(aq), Cl−, Ti(OH)4(aq),
HPO24−, Mn2+
)were selected to account for all major el-ements in dissolving minerals. A list of auxiliary or sec-ondary complexes to be included in the calculation of total concentrations (a total of 105 species, Supplementary ma-terial 2, see http://www.hydrol-earth-syst-sci.net/13/2273/ 2009/hess-13-2273-2009-supplement.pdf) was obtained by “sweeping” the EQ3 database for all relevant species. For both experiments, inflow solution was pure water in equi-librium with ambient concentrations of atmospheric gases, including CO2and O2(to simulate the reverse osmosis
pu-rified, atmosphere pre-equilibrated water that will be used in the experiment).
Boundary conditions were Dirichlet at the soil surface (to allow for gas diffusion) and flux at the bottom. Crunch-Flow2007 allows one to either define constant gas flux across the domain or to impose diffusion limitations. Both op-tions were used in 1-D simulaop-tions, to provide a comparison, whereas diffusion-controlled gas flux was used for 2-D sim-ulations. When used, constant gas flux was set at 20 m h−1
to ensure O2was present in excess. The gas diffusion
coeffi-cient in basalt,Db(0.0089 cm2s−1), in 1-D simulations was
calculated using the formula suggested for soils by Moldrup et al. (2000):
Db=0.66×Dair×θair (3)
where Dair is the gas diffusion coefficient in air, 0.219 cm2s−1 for O
2 (Welty et al., 1984), and θair is
air-filled porosity (0.0615 for 0.41 total porosity and 85% sat-uration). For 2-D simulations, the value of 0.01 cm2s−1was used, since this value lies between the calculated maximum gas diffusion coefficient in dry basalt (0.059 cm2s−1)and the zero gas diffusion coefficient operative under fully saturated conditions.
The initial condition contained pore water equilibrated geochemically with basalt. Discretization was 30 1-m seg-ments in 1-D simulations and 30 1-m segseg-ments in the down-slope direction and 11 0.091-m segments in surface to bottom direction in 2-D simulations.
Dissolution rates in CrunchFlow2007 (Steefel, 2008) are described using:
R =Amkmexp
−E
a
RT
Y
ain1−exp(m2gm3)m1 (4)
g= 1Gr
RT =ln
Q
KSO
(5) whereR is dissolution rate in mol m−3s−1, Am is mineral
bulk surface area, m2m−3,kmis the dissolution intrinsic rate
constant in units of mol m−2
s−1
,Eais the activation energy
(kJ mol−1
), Q is the ion activity product for the mineral-water reaction,KSOis the corresponding solubility product
constant, andQ
ani is a product representing the inhibition or catalysis of the reaction by various ions in solution raised to the powern. Rate dependence on reaction affinity,g, (or Gibbs energy) is defined by the parametersm1, m2andm3
following relationships observed by Burch et al. (1993) and Hellmann and Tisserand (2006).
Reactive surface area for primary minerals was calculated from the measured specific surface area for the basalt and mass fraction of each identified mineral phase. In the model, therefore, bulk surface area decreases linearly with the vol-ume fraction of the dissolving mineral phase. For secondary minerals an initial bulk surface area of 100 m2mineral/m3 porous medium was assumed for lack of any specific data on how nucleation and precipitation in its early stages oc-curs. Once precipitation occurs, surface area is recalculated so that it increases with a 2/3 dependence on the secondary mineral volume fraction.
For the feldspar dissolution reactions in our study, a ki-netic model with two parallel rates was used (Hellmann and Tisserand, 2006):
R =k11−exp(−m2gm3)+k21−exp(−g)m1 (6)
wherek1represents a faster rate that dominates far from
equi-librium andk2results from a slower rate at conditions closer
to equilibrium; m1=1.17, m2=0.000078, and m3=3.81.
For other minerals where dual rate constants are not avail-able, a single rate constant (with m1=0.5, m2=1, and
m3=2) was employed.
precipitation of minerals is well described by the TST model far from equilibrium (large Gibbs free energy), dissolution close to equilibrium is not predicted as well. However, few papers describe and quantify this phenomenon (Burch et al., 1993; Hellmann and Tisserand, 2006; Maher et al., 2009). Including Al-inhibition of dissolution rates has been shown to improve predictions compared to TST model for several minerals (Gautier et al., 1994; Wolff-Boenisch et al., 2004; G´erard et al., 1998). However, Maher at al. (2009) showed that a kinetic model with two parallel rates (one nearly linear, one strongly nonlinear) following the studies of Hellmann and Tisserand (2006) and Burch et al. (1993) gives similar results to the Al-inhibition model. The Hellmann-Tisserand kinetic model was used in this study.
2.3 One-Dimensional simulations
Initial simulations were of a 1-D, 30 m length soil column. A 30 m column represents the longest flow path possible on the modeled hillslope. This allowed us to follow changes to the material occurring both close to the surface and fur-ther down-gradient at greater depth. Orientation of the col-umn did not affect results of the simulations as flow direction was defined independently. Five different constant flow ve-locities (0.00005, 0.00026, 0.00041, and 0.005 m h−1
)were evaluated, all at 85% saturation. These velocity values were within the range observed in HYDRUS-3-D simulations of water transport in the B2 hillslopes for the loamy sand texture class (Hopp et al., 2009). Specific surface areas of the porous medium in the model included that measured using N2BET
in our laboratory for the original loamy sand (3.2 m2g−1),
but several additional lower values (10, 100 and 1000-fold lower than the measured N2BET) were also used, since prior
studies have shown that N2 BET may overestimate reactive
mineral-water interfacial area (Navarre-Sitchler and Brant-ley, 2007). Although same specific surface area values were applied to all constituent minerals in a given run, volumet-ric abundances of each mineral were based on measurement (see Table 1). Running the model across a range in pore wa-ter velocity and specific surface area allowed us to evaluate sensitivity to these parameters.
2.4 Two-Dimensional simulations
For the 2-D simulations, a rectangular model was con-structed computationally to simulate the hillslope central cross-section parallel to lateral water flow (i.e., at the chan-nel). The flow velocity and saturation profile were generated by using steady-state conditions resulting from HYDRUS-3-D simulations. As the HYDRUS-HYDRUS-3-D simulation domain consisted of a grid parallel to the channel bottom, conversion to the rectangular domain only required correction of the ve-locity vectors. Results of the CrunchFlow2007 simulations were then plotted in the HYDRUS-3-D domain.
A constant precipitation rate was imposed that was set equal to the mean value for all days that received rainfall each year for two different climatic locations (Hopp et al., 2009). Climate data were taken from (i) the Lucky Hills site within the USDA-ARS Walnut Gulch Experimental Wa-tershed, Arizona, USA (Scott et al., 2000), and (ii) a sce-nario representative of a semi-arid “Sky Island” Ponderosa Pine forest (Brown-Mitic et al., 2007), a subset of the US western sub-alpine forest (a semi-annual total rainfall of 367 mm distributed over 90 days, followed by a dry period of 90 days). For Lucky Hills conditions (total of 356 mm yr−1,
0.2655 mm h−1 average daily rainfall rate for 56 days per
year) steady state flow conditions were reached after 1044 h (43.5 days) of simulated rainfall. For simulated Sky Island forest climate (734.2 mm yr−1, 0.0041 m h−1 average daily
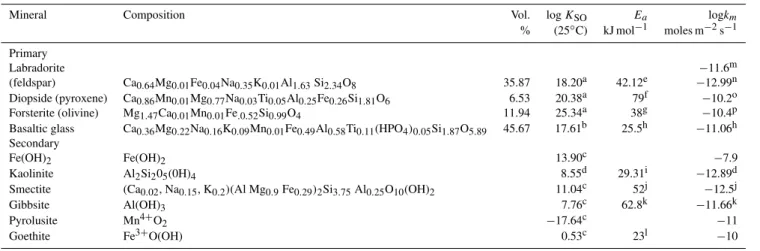
rainfall over 74 days per year) steady state was reached after 980 h (40.8 days). These HYDRUS-3-D-derived steady-state saturation and velocity profiles were used to run 2-D Crunch-Flow2007 simulations for 0, 168, 560, and 1000 days for the “Lucky Hills climate” (simulating 0, 3, 10, and 18 years of the actual hillslope experiment under Lucky Hills climate conditions) and for 0, 222, 740, and 1000 days for the “Sky Island climate” (simulating 0, 3, 10, and 14 years of the actual hillslope experiment under Sky Island climate condi-tions). For CrunchFlow2007, only days with rain were mod-eled and days without rain were omitted. Therefore, since the Sky Island climate had more days with rain per year (74 vs. 56), 1000 days of rain required fewer years. Figure 2 presents the velocity distribution and saturation in the profile for the two climate regimes.
The simulations contain several simplifications relative to the actual hillslope experiments being constructed at B2. In particular, we have simulated steady-state conditions, rather than the wet-dry cycles characteristic of actual rainfall-runoff events, in order to better enable calculation of geochemical transformations. The influence of wet-dry cycles will be ex-plored in future modeling studies. Contribution of evapotran-spiration to water flow was also ignored. Further, we have assumed here that only abiotic water-rock interaction is oc-curring, and we have not included the potential contribution of plants and microorganisms, or the indirect effects of bio-produced organic acids, on the weathering process (Berner et al., 2003; Hinsinger et al., 2001; Neaman et al., 2005) . Furthermore, we have assumed that the hillslopes would be initially homogeneous and isotropic, although we recognize that deposition of the granular material will likely result in some degree of particle sorting, which was not considered here.
Fig. 2. Water velocity (white arrows) and content (shading) pro-files in the hillslope cross-section at the channel for the two sim-ulated climates. Volumetric water content of 0.41 corresponds to saturated conditions. Lucky Hills Climate: steady state conditions for the Lucky Hills watershed (0.0026 m h−1rainfall over 56 days per year). Sky Island Climate: steady state conditions for the sim-ulated semi-arid Sky Island forest climate (0.0041 m h−1rainfall over 74 days per year). Y-axis tick mark spacings equal 1 m.
Rosetta was calibrated on a database of 2134 samples con-taining texture, bulk density, water retention and saturated conductivity data. Correlations and their performance met-rics can be found in Schaap et al. (2001).
In our Rosetta simulations sand, silt and clay content were used as inputs. It was assumed that all secondary mineral precipitation contributed to an accretion of the clay frac-tion, consistent with distribution of secondary minerals in the soils. Figure 3 presents a schematic of the relations be-tween modeling components used in this study to predict solid phase evolution.
3 Results
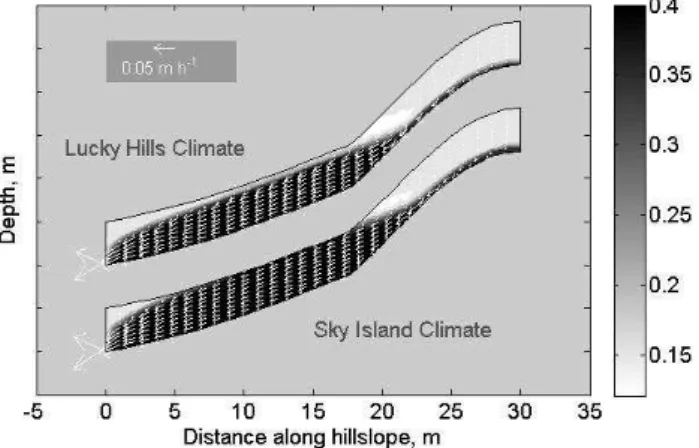
3.1 One-Dimensional CrunchFlow2007 simulations 1-D simulations indicate primary mineral dissolution and secondary mineral precipitation in the porous basalt col-umn representing a 30-m flowpath on the hillslope (Fig. 4). Basalt glass shows the most rapid dissolution, followed by forsterite. In contrast, anorthite and diopside did not un-dergo significant dissolution during the time-scale of model-ing. Irrespective of whether O2was limited by diffusion into
the surface of the column, or whether it was present in ex-cess throughout the column, smectite and goethite were the predominant newly-precipitating phases in the top (30 cm) of the column (Fig. 4). Kaolinite and pyrolusite were also formed, but to a lesser extent. Farther along the column length, at 45 cm and deeper, under O2-limited conditions, a
small amount of Fe(OH)2 precipitation was observed. The
total mineral transformation was slightly greater in the
pres-HYDRUS-3D
CrunchFlow2007
Saturation and flow vectors Particle size distribution
Rosetta Hydraulic parameters
Fig. 3. Schematic presentation of relationship between modeling
components used in this study to predict solid phase evolution in the Biosphere 2 hillslope experiment.
ence of excess O2, indicating slight limitations on weathering
imposed by oxidant availability.
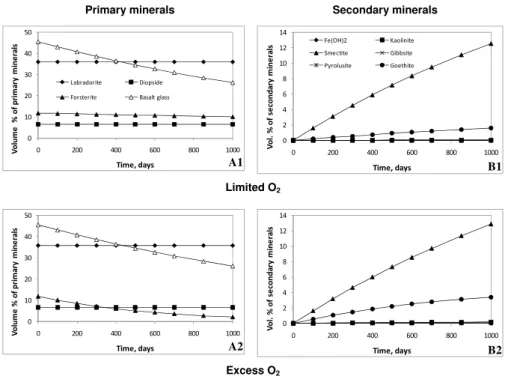
For the soil column configuration, the predicted extent of weathering in the top 30 cm was more sensitive to particle surface area than to flow velocity (Fig. 5). There was a large increase in dissolution as specific surface area (SSA) increased from 0.32 to 3.2 m2g−1, the highest value being that which was measured for the loamy-sand texture class of material. In general, diffusion limitations on O2(g)
avail-ability appear to diminish mineral transformation rates, pre-sumably because of their effect on oxidation of Fe(II), which would tend to increase the magnitude of the chemical affinity of term (Eq. 4) for Fe(II)-bearing solids. The strong effect of SSA and the weak effect of water velocity indicate that chemical dissolution kinetics rather than solubility or physi-cal transport were rate limiting (Steefel, 2007).
The fact that dissolution-precipitation curves are not mir-ror images of each other reflects the time-dependent deple-tion of primary solid phase mass by solute efflux. As a result, the negative volumetric change in primary minerals is greater than the positive volumetric change in secondary minerals. Trends shown here are specific for basalt mineralogy that is high in weatherable glass. Results from preliminary simu-lations of different primary mineral assemblages with lower log KSO(not shown) exhibited significant effects of flow rate
on dissolution, indicating solubility, rather than a kinetic or surface reaction rate limitation on dissolution, in contrast to the dissolution rate control noted above. In addition, these latter simulations also showed a much stronger impact on mineral transformation of O2(g)diffusion limitations.
3.2 Two-Dimensional CrunchFlow2007 simulations
Results from the 2-D simulations facilitate visualization of mineral transformations and their distribution in response to the more complex hillslope cross-section flow system (Fig. 2). Similar to the 1-D simulations, 2-D secondary mineral phase distribution and their respective saturation in-dices (logQ/KSO)show smectite as the principal neophase
0 10 20 30 40 50
0 200 400 600 800 1000
Vo lu m e % of pr im a ry mi n e ra ls
Time, days Labradorite Diopside Forsterite Basalt glass
0 2 4 6 8 10 12 14
0 200 400 600 800 1000
Vo l. % of se co n d a ry mi n e ra ls
Time, days Fe(OH)2 Kaolinite Smectite Gibbsite Pyrolusite Goethite
Limited O2
0 10 20 30 40 50
0 200 400 600 800 1000
Vo lu m e % of pr im a ry mi n e ra ls
Time, days
0 2 4 6 8 10 12 14
0 200 400 600 800 1000
Vo l. % of se co n d a ry mi n e ra ls
Time, days
Excess O2 A2
A1 B1
B2
Primary minerals Secondary minerals
Fig. 4.Change in volume of primary(A)and secondary(B)minerals in the top 30 cm of the column during dissolution of the black basalt
(SSA=3.2 m2g−1)for constant flow, 0.0041 m h−1. 1=O2supply limited by the diffusion rate; 2=unlimited supply of O2.
60 65 70 75 80 85 90 95 100 0 5 10 15 20 25 30 35 40
0 200 400 600 800 1000 Vo
lu m e % of pr im a ry mi n e ra ls Vo l. % of se co n d a ry mi n e ra ls
Time, days
0.05 mm/h 0.26 mm/h 0.41 mm/h 5 mm/h 60 65 70 75 80 85 90 95 100 0 5 10 15 20 25 30 35 40
0 200 400 600 800 1000 Vo
lu m e % of pr im a ry mi n e ra ls Vo l. % of se co n d a ry mi n e ra ls
Time, days
0.0032 m2/g 0.032 m2/g 0.32 m2/g 3.2 m2/g
Limited O2
60 65 70 75 80 85 90 95 100 0 5 10 15 20 25 30 35 40
0 200 400 600 800 1000 Vo
lu m e % of pr im a ry mi n e ra ls Vo l. % of se co n d a ry mi n e ra ls
Time, days
0.05 mm/h 0.26 mm/h 0.41 mm/h 5 mm/h 60 65 70 75 80 85 90 95 100 0 5 10 15 20 25 30 35 40
0 200 400 600 800 1000 Vo
lu m e % of pr im a ry mi n e ra ls Vo l. % of se co n d a ry mi n e ra ls
Time, days
0.0032 m2/g 0.032 m2/g 0.32 m2/g 3.2 m2/g
Excess O2 A2
A1 B1
B2
Flow Velocity Effect Surface Area Effect
Fig. 5.Effect of flow velocities(A)and basalt surface areas(B)on dissolution of black basalt with O2supply limited by the diffusion rate
Secondary mineral acculmulation Solution saturation state
Lucky Hills Climate
Sky Island Climate
Fig. 6. Volumetric (fraction of the solid) accumulation of
sec-ondary minerals (left) and relative saturation state of solutions, log (Q/KSO), (right) for the Lucky Hills (top) and Sky Island (bot-tom) climate regimes after 1000 days of simulation. Negative log (Q/KSO) values indicate solution phase undersaturation with re-spect to indicated mineral phases, while positive values indictate supersaturated conditions. Y-axis tick mark spacings equal 1 m.
access to oxygen appeared to strongly impact the satura-tion index and mineral distribusatura-tion results through its im-pact on Fe and Mn oxidation states. For example, solutions in the groundwater zone were strongly undersaturated with respect to goethite (α-FeIIIOOH) and pyrolusite (MnIVO2),
whereas vadose zone solutions were at equilibrium or super-saturated with respect to these same phases. Conversely, so-lutions were near equilibrium with respect to ferrous hydrox-ide (FeII(OH)2)in the saturated zone.
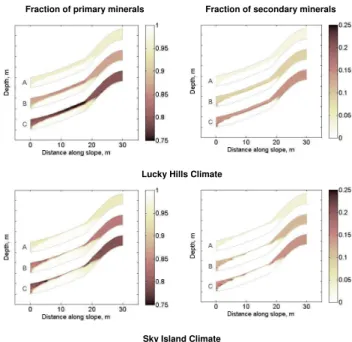
Since the net transformation of primary to secondary min-erals is a principal driver for soil textural evolution, the total volume fraction of primary minerals dissolved and secondary minerals precipitated provides insight into the hillslope re-action fronts as a function of space, time and climate. In Fig. 7, we have plotted the volumetric depletion of primary minerals (left) and accretion of secondary minerals (right) following a steady-state water flux equivalent to that water flux deriving from (A) 3, (B) 10, and (C) 18 years of
weath-Fraction of primary minerals Fraction of secondary minerals
Lucky Hills Climate
Sky Island Climate
Fig. 7.Fraction of primary (left) and secondary (right) minerals as a
function of time. Top two plots are after steady state rainfall condi-tions equivalent in amount to Lucky Hills climate (0.0026 m h−1for 56 days per year)(A)168 days or 3 years;(B)560 days or 10 years; and(C)1000 days or 18 years. Bottom two plots are after steady state rainfall conditions equivalent in amount to simulated Sky Is-land climate rainfall (0.0041 m h−1for 74 days per year) (A) 222 days or 3 years; (B) 740 days or 10 years; and (C) 1000 days or 14 years. Initial fraction of primary minerals equaled one. Initial frac-tion of secondary minerals equaled zero. Y-axis tick mark spacings equal 1 m.
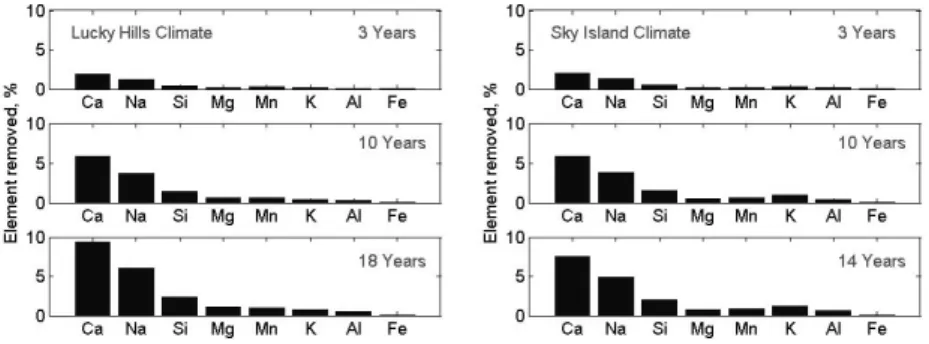
Fig. 8.Removal of lithogenic elements (% of original content) from the hillslope cross-section as a finction of time for two climates: Lucky Hills Climate and Sky Island Climate.
transformation in the Lucky Hills climate after 1000 days due to a vadose zone extent wherein most of the weathering oc-cured (i.e., 13.2% dissolution, 8.98% precipitation in Lucky Hills climate versus 10.5% dissolution, 7.02% precipitation in Sky Island climate). Loss of lithogenic elements from the hillslope (Fig. 8) showed a similar pattern, reflecting greater per day weathering in the Lucky Hills climate. However, the annual weathering rate is slightly greater in the Sky Island climate due to the greater number of days with rain in that climate.
When hillslope weathering rates were compared for sev-eral surface area scenarios (Fig. 9), it was observed that to-tal dissolution (i.e., hillslope chemical denudation) increased with surface area in a trend similar to that observed in 1-D simulations. The one exception was that Mg release de-creased at the highest specific surface area, consistent with enhanced precipitation of Mg-containing smectite driven by greater supersaturation. Calculated denudation rates for the measured mineral surface area (3.2 m2g−1)were in line with
field observations (White and Blum, 1995). 3.3 Rosetta predictions
Saturated hydraulic conductivity (Ksat)was the hydraulic
pa-rameter most sensitive to changes in the basaltic media par-ticle size distribution. All areas of the hillslope are predicted to show a change inKsatbecause of incongruent weathering
processes (Fig. 10). Throughout the hillslope,Ksatwas
de-creased from 0.044 m h−1
, its original calculated value. Con-sistent with the weathering zonation, a larger decrease inKsat
is observed in the upper layers of the domain, with the satu-rated zone retaining higherKsatvalues.
Differences between the two climate regimes were also ob-served. The Sky Island climate, with higher rainfall showed a greater reduction in the saturated hydraulic conductivity, particularly in the backslope and footslope positions, but the Lucky Hills climate showed a reduction throughout a larger areal extent, consistent with a more extensive vadose zone.
4 Discussion
0.0001 0.001 0.01 0.1 1 10 100 1000
0.001 0.01 0.1 1 10
D
e
nu
da
ti
on
r
a
te
, m
o
l ha
-1
yr
-1
Surface area, m2g-1
Si
Mg
Ca
Al
Na
K
Mn
Fe
Fig. 9. Hillslope chemical denudation rate for lithogenic
ele-ments (mol ha−1yr−1)as a function of grain surface area and cli-mate regime. Solid lines represent values for Lucky Hills Clicli-mate, dashed lines for Sky Island Climate.
medium, more closely represents a laboratory experiment than a field-weathered soil. For this reason (absent exper-imental data on hillslope scale weathering rates for adjust-ment), the measured N2BET SSA values of the basalt were
used for the 2-D simulations with the understanding that pre-dicted mineral transformations may be higher than those ob-served in the experiment.
The quantitative model assessments of geochemical weathering andKsatchange in the B2 hillslopes must there-fore be seen as hypothetical; they provide a means for pos-tulating the time-scale of structural change, the locations of reaction fronts in relation to water table dynamics, etc. The B2 hillslope geochemical model will be increasingly con-strained through data acquisition over the course of the ex-periment and this is expected to lead to an iterative and con-tinuous evolution of the quantitative assessments. Model re-sults are intended to facilitate prediction of where and why to expect accumulation of secondary minerals and to aid in the design of sampling strategies to capture and quantify changes within the hillslope. To the best of our knowledge this is also the first study that predicts spatially-resolved changes in hy-draulic properties of a catchment as a result of geochemical weathering.
Dissolution can be either surface-reaction or transport-controlled depending which rate is slower (Steefel, 2007). When weathering is controlled by chemical kinetics, the solution may be undersaturated with respect to dissolving mineral(s) but slow surface reaction rate impedes weather-ing nonetheless. Under transport control, the aqueous phase
Fig. 10. Map of the Rosetta-calculatedKsatvalues (m h−1)based
on the change in mineral volumes and associated particle sizes over 10 years for two climates. Lucky Hills Climate: steady state condi-tions for the Lucky Hills watershed (0.0026 m h−1rainfall over 56 days per year). Sky Island Climate: steady state conditions for the simulated Sky Island climate (0.0041 m h−1rainfall for 74 days per year). Calculated value for the saturated hydraulic conductivity of the original loamy sand material is 0.044 m h−1. Y-axis tick mark spacings equal 1 m.
quickly equilibrates with the dissolving solid, decreasing the magnitude of the chemical affinity term (logQ/KSO), and thereby diminishing the dissolution rate until solutes can be transported away from the dissolving solid by advection or diffusion. Lack of flow velocity effects on dissolution of pri-mary minerals in the 1-D simulations indicated that weather-ing kinetics were controlled by mineral dissolution rate under the modeled conditions.
Conversely, the 2-D simulations revealed indications of both transport and dissolution control. A 10-fold decrease in particle SSA resulted in a decrease in the extent of disso-lution and precipitation on the hillslope cross-section, consis-tent with surface reaction rate limitations (not shown). How-ever, the distinct pattern of changes in the amount of pri-mary and secondary minerals could be clearly related to the flow patterns on the hillslope cross-sections, and was differ-ent between two climate regimes indicating transport con-trol. These results support previous studies indicating that within a watershed, both transport and dissolution extend control over weathering front advance (Steefel et al., 2005; Steefel, 2007). While on the large scale, overall progress of the weathering front is controlled by transport, as can be ob-served by less weathering under dry climates, local control can derive from the chemical dissolution rate of constituent minerals, which depends on the reactive surface area and site density of the particles.
solubility of basaltic glass leads to stabilization of more crys-talline igneous minerals (Gislason and Arnorsson, 1993). For example, release of Si, Al, Ca, Mg, Fe from the glass reduced the extent of undersaturation with respect to olivine and in-duced supersaturation of solution with respect to pyroxene. Consequently, the dissolution of basaltic rock constituents is typically sequential, depending on the relative amount and composition of the igneous minerals and glass present, with glass dissolving first, then olivine, and finally pyroxene and plagioclase.
Of the common secondary minerals that form from incon-gruent weathering of basalt that were selected for inclusion in CrunchFlow2007 simulations, smectite precipitated in the largest amounts. Initial precipitation of smectite can be ex-plained by the high Si to Al ratio of the dissolving glass. The 2:1 layer silicate mineral smectite has a higher Si/Al ratio than the 1:1 layer silicate kaolinite and is, therefore, more stable in the initial stages of basalt weathering (Chadwick and Chorover, 2001). Smectite is commonly observed as a result of weathering of basaltic material, particularly in the presence of glass (Tosca, 2009; Singer, 2007). Deeper in the profile, particularly for the Sky Island climate with thicker saturated layer, under oxygen-limited conditions, iron (II) hydroxide was found to precipitate. Development of deeply anoxic conditions resulting in Fe(OH)2 precipitation is
un-likely in semi-arid climatic regimes, but it may occur as a metastable phase during the rainfall season, which occurs in both climates studied.
The weathering-induced evolution of heterogeneity in hy-drologic properties of the initially homogeneous hillslope is consistent with our current knowledge of spatial variability in the natural hillslopes. On the scale of the soil profile or pe-don, a finer particle size and smaller hydraulic conductivity are usually observed in association with the weathering front. The decrease in particle size promotes increased water hold-ing capacity, ion exchange capacity, nutrient retention, and, therefore, an improved environment for plant growth. The model simulation indicates that the surficial layer of basalt that resides in the unsaturated zone is subjected to more pri-mary mineral dissolution and secondary mineral precipita-tion than the lower part of the profile that resides in the satu-rated zone. This results in lower satusatu-rated hydraulic conduc-tivities in the near surface than at depth.
At the hillslope scale, it is also observed that neoformed fine particles accumulate in low-lying areas of the landscape. While this can result from particle translocation by physi-cal erosion, it can also result from the accumulation of so-lutes along water flow paths that result in supersaturation and precipitative deposition. The latter is observed in the model simulations that predict an accumulation of secondary miner-als in the toe-slope positions (Fig. 7). Areas of concentrated flow, below the water table, became equilibrium saturated with respect to primary minerals undergoing dissolution and, as a result, showed less dissolution and precipitation. Disso-lution in this portion of the hillslope can be characterized as
transport limited while secondary phase accumulations were apparently limited by precipitation kinetics and low oxygen concentrations (inhibiting Fe(II) oxidation). The precipita-tion band that is observed to form on the border between the saturated and unsaturated zones is particularly interest-ing, and is due to the intersection of geochemical conditions that promoted the precipitation of smectite (above) and fer-rous hydroxide (below).
While not captured in the current simulations, newly formed heterogeneity in hydraulic conductivity is expected to feedback to influence the further the formation of soil struc-ture, including preferential flow paths, thereby resulting in additional changes to water transport, solute or sediment flux and mineral weathering (Uchida et al., 2005). For example, a decrease inKsatin the near surface may diminish infiltration
relative to runoff generation during intense rainfall events, thereby promoting overland flow via the Horton runoff gen-eration mechanism (Maxwell and Kollet, 2008). However, it should also be pointed out that this study assumes bulk changes to the particle size of the soil resulting from mineral transformation processes. While this may be the case to some extent, it is also expected that neoformed clay particles will be concentrated in close association with existing particles and in small pores, thereby possibly having less influence on large pores and saturated hydraulic conductivity values (rel-ative to small pores and unsaturated hydraulic conductivity values). Precipitation of secondary clays in small pores will also promote aggregate formation, with impacts on broadly relevant processes in the B2 experiment such as carbon se-questration and evapotranspiration.
In the present study, results of CrunchFlow2007 simu-lations were transferred into the Rosetta code to calculate hydrologic parameters based on change in particle size distribution of the domain. To enable future model coupling, this hydrologic parameterization would need to be translated back into HYDRUS for a redefinition of the hillslope hydrologic properties. Since each such translation between models (three in this case) requires multiple participants and the potential associated introduction of error, the B2 hills-lope experiment has the goal of developing a fully-coupled hydrologic and geochemical model that will be capable of evaluating feedbacks between geochemical reactions and hydrologic response in single model runs. Ideally, a fully coupled model would also describe the interaction between climatic, hydrologic, geochemical, and biological processes in the evolution of fluid flow paths. This paper and the companion papers dealing with hydrologic and vegetation modeling of the B2 hillslopes (Hopp et al., 2009) are a first approach toward this goal.
Edited by: K. Bishop
References
Treatise on Geochemistry, Pergamon, Oxford, 169–188, 2003. Berner, R. A., Sjoberg, E. L., and Schott, J.: Mechanisms of
py-roxene and amphibole weathering. I. Experimental studies, in: Third International Symposium on Water-Rock Interaction: Pro-ceedings, Alberta Research Council, Edmonton, 44–45, 1980. Brantley, S. L., White, T. S., White, A. F., Sparks, D., Richter, D.,
Pregitzer, K., Derry, L., Chorover, J., Chadwick, O. A., April, R., Anderson, S., and Amundson, R.: Frontiers in Exploration of the Critical Zone: Report of a workshop sponsored by the National Science Foundation (NSF), 24–26 October, 2005, Newark, DE, Washington DC, 30 pp., 2006.
Brown-Mitic, C., Shuttleworth, W. J., Harlow, R. C., Petti, J., Burke, E., and Bales, R.: Seasonal water dynamics of a sky is-land subalpine forest in semi-arid southwestern United States, J. Arid Environ., 69, 237–258, 2007.
Brunauer, S., Emmett, P. H., and Teller, E.: Adsorption of gases in multimolecular layers, J. Am. Chem. Soc., 60, 309–319, 1938. Burch, T. E., Nagy, K. L., and Lasaga, A. C.: Free energy
depen-dence of albite dissolution kinetics at 80 ˚ C and pH 8.8, Chem. Geol., 105, 137–162, 1993.
Cama, J., Ganor, J., Ayora, C., and Lasaga, C. A.: Smectite disso-lution kinetics at 80◦C and pH 8.8, Geochim. Cosmochim. Acta, 64, 2701–2717, 2000.
Carroll, S. A. and Knauss, K. G.: Dependence of labradorite dis-solution kinetics on CO2(aq), Al(aq), and temperature, Chem. Geol., 217, 213–225, 2005.
Carsel, R. F. and Parish, R. S.: Developing joint probability dis-tributions of soil water retention characteristics, Water Resour. Res., 24, 755–769, 1988.
Chadwick, O. A. and Chorover, J.: The chemistry of pedogenic thresholds, Geoderma, 100, 321–353, 2001.
Chorover, J., Kretzschmar, R., Garcia-Pichel, F., and Sparks, D. L.: Soil biogeochemical processes within the critical zone, Ele-ments, 3, 321–326, 2007.
Cornell, R. M., Posner, A. N. M., and Quirk, J. P.: The complete dissolution of goethite, J. Appl. Chem. Biotechn., 25, 701–706, 1975.
Drever, J. I. and Clow, D. W.: Weathering rates in catchments, in: Chemical Weathering Rates of Silicate Minerals, edited by: White, A. F. and Brantley, S. L., Mineralogical Society of Amer-ica, Washington DC, 463–483, 1995.
Flint, A. L. and Flint, L. E.: Particle Density, in: Methods of Soil Analysis: Part 4 - Physical Methods, edited by: Dane, J. H. and Topp, G. C., Soil Science Society of America, Madison, WI, USA, 230–232, 2002.
Ganor, J., Mogoll´on, J. L., and Lasaga, A. C.: The effect of pH on kaolinite dissolution rates and on activation energy, Geochim. Cosmochim. Acta, 59, 1037–1052, 1995.
Ganor, J., Mogoll´on, J. L., and Lasaga, A. C.: Kinetics of gibbsite dissolution under low ionic strength conditions, Geochim. Cos-mochim. Acta, 63, 1635–1651, 1999.
Gautier, J.-M., Oelkers, E. H., and Schott, J.: Experimental study of K-feldspar dissolution rates as a function of chemical affinity at 150◦C and pH 9, Geochim. Cosmochim. Acta, 58, 4549–4560, 1994.
G´erard, F., Fritz, B., Cl´ement, A., and Crovisier, J.-L.: General im-plications of aluminium speciation-dependent kinetic dissolution rate law in water-rock modelling, Chem. Geol., 151, 247–258, 1998.
Giambalvo, E. R., Steefel, C. I., Fisher, A. T., Rosenberg, N. D., and Wheat, C. G.: Effect of fluid-sediment reaction on hydrothermal fluxes of major elements, eastern flank of the Juan de Fuca Ridge, Geochim. Cosmochim. Acta, 66, 1739–1757, 2002.
Gislason, S. R. and Arnorsson, S.: Dissolution of primary basaltic minerals in natural waters: saturation state and kinetics, Chem. Geol., 105, 117–135, 1993.
Gislason, S. R. and Oelkers, E. H.: Mechanism, rates, and conse-quences of basaltic glass dissolution: II. An experimental study of the dissolution rates of basaltic glass as a function of pH and temperature, Geochim. Cosmochim. Acta, 67, 3817–3832, 2003. Godd´eris, Y., Franc¸ois, L. M., Probst, A., Schott, J., Moncoulon, D., Labat, D., and Viville, D.: Modelling weathering processes at the catchment scale: The WITCH numerical model, Geochim. Cosmochim. Acta, 70, 1128–1147, 2006.
Grandstaff, D. E.: The dissolution rate of forsterite olivine from Hawaiian beach sand, in: in Third International Symposium on Water-Rock Interaction; Proceedings, Alberta Research Council, Edmonton, 72–74, 1980.
Hellmann, R. and Tisserand, D.: Dissolution kinetics as a func-tion of the Gibbs free energy of reacfunc-tion: An experimental study based on albite feldspar, Geochim. Cosmochim. Acta, 70, 364– 383, 2006.
Hinsinger, P., Barros, O. N. F., Benedetti, M. F., Noack, Y., and Cal-lot, G.: Plant-induced weathering of a basaltic rock: Experimen-tal evidence, Geochim. Cosmochim. Acta, 65, 137–152, 2001. Hopp, L., Harman, C., Desilets, S. L. E., Graham, C. B.,
McDon-nell, J. J., and Troch, P. A.: Hillslope hydrology under glass: con-fronting fundamental questions of soil-water-biota co-evolution at Biosphere 2, Hydrol. Earth Syst. Sci., 13, 2105–2118, 2009, http://www.hydrol-earth-syst-sci.net/13/2105/2009/.
Huxman, T., Troch, P., Chorover, J., Breshears, D. D., Saleska, S., Pelletier, J., Zeng, X., and Espeleta, J.: The Hills are Alive: In-terdisciplinary Earth Science at Biosphere 2, EOS 90, p. 120, 2009.
Lasaga, A. C.: Chemical Kinetics of Water-Rock Interactions, J. Geophys. Res., 89, 4009–4025, 1984.
Lelli, M., Cioni, R., and Marini, L.: The double solid reactant method: II. An application to the shallow groundwaters of the Porto Plain, Vulcano Island (Italy), Environ. Geol., 56, 139–158, 2008.
Lohse, K. A. and Dietrich, W. E.: Contrasting effects of soil devel-opment on hydrological properties and flow paths, Water Resour. Res., 41, W12419, doi:10.1029/2004WR003403, 2005. Maher, K., Steefel, C. I., DePaolo, D. J., and Viani, B. E.: The
min-eral dissolution rate conundrum: Insights from reactive transport modeling of U isotopes and pore fluid chemistry in marine sedi-ments, Geochim. Cosmochim. Acta, 70, 337–363, 2006. Maher, K., Steefel, C. I., White, A. F., and Stonestrom, D. A.:
The role of reaction affinity and secondary minerals in regulat-ing chemical weatherregulat-ing rates at the Santa Cruz Soil Chronose-quence, California, Geochim. Cosmochim. Acta, 73, 2804–2831, 2009.
Maxwell, R. M. and Kollet, S. J.: Quantifying the effects of three-dimensional subsurface heterogeneity on Hortonian runoff pro-cesses using a coupled numerical, stochastic approach, Adv. Wa-ter Resour., 31, 807–817, 2008.
Undis-turbed Soil from Soil Water Characteristics, Soil Sci. Soc. Am. J., 64, 94–100, 2000.
Navarre-Sitchler, A. and Brantley, S.: Basalt weathering across scales, Earth Planet. Sci. Lett. , 261, 321–334, 2007.
Neaman, A., Chorover, J., and Brantley, S. L.: Implications of the evolution of organic acid moieties for basalt weathering over ge-ological time, Am. J. Sci., 305, 147–185, 2005.
Nesbitt, H. W. and Wilson, R. E.: Recent chemical weathering of basalts, Am. J. Sci., 292, 740–777, 1992.
Nordstrom, D. K. and Munoz, J. L.: Geochemical Thermodynam-ics, Blackwell Scientific, Boston, MA, 1994.
NRC, N. R. C.: Basic Research Opportunities in Earth Sciences, National Academies Press, Washington, DC, 2001.
Oelkers, E. H.: General kinetic description of multioxide silicate mineral and glass dissolution, Geochim. Cosmochim. Acta, 65, 3703–3719, 2001.
Oelkers, E. H. and Gislason, S. R.: The mechanism, rates and con-sequences of basaltic glass dissolution: I. An experimental study of the dissolution rates of basaltic glass as a function of aqueous Al, Si and oxalic acid concentration at 25◦C and pH=3 and 11, Geochim. Cosmochim. Acta, 65, 3671–3681, 2001.
Paktunc, A. D.: MODAN – a computer program for estimating mineral quantities based on bulk composition: windows version, Comput. Geosci., 27, 883–886, 2001.
Pokrovsky, O. S. and Schott, J.: Kinetics and mechanism of forsterite dissolution at 25◦C and pH from 1 to 12, Geochim. Cosmochim. Acta, 64, 3313–3325, 2000.
Schaap, M. G., Leij, F. J., and van Genuchten, M. T.: Rosetta: a computer program for estimating soil hydraulic parameters with hierarchical pedotransfer functions, J. Hydrol., 251, 163–176, 2001.
Schott, J., Berner, R. A., and Sj¨oberg, E. L.: Mechanism of py-roxene and amphibole weathering – I. Experimental studies of iron-free minerals Geochim. Cosmochim. Acta, 45, 2123–2135, 1981.
Scott, R. L., Shuttleworth, W. J., Keefer, T. O., and Warrick, A. W.: Modeling multiyear observations of soil moisture recharge in the semiarid American Southwest, Water Resour. Res., 36, 2233– 2247, 2000.
Singer, A.: The Soils of Israel, Springer, 306 pp., 2007.
Soler, J. M. and Lasaga, A. C.: An advection-dispersion-reaction model for bauxite formation, J. Hydrology, 209, 311–330, 1998. Sposito, G.: The Chemistry of Soils, Oxford University Press, NY,
329 pp., 2008.
Steefel, C. I. and Van Cappellen, P.: A new kinetic approach to mod-eling water-rock interaction: The role of nucleation, precursors, and Ostwald ripening, Geochim. Cosmochim. Acta, 54, 2657– 2677, 1990.
Steefel, C. I. and Lasaga, A. C.: A coupled model for transport of multiple chemical species and kinetic precipitation/dissolution reactions with application to reactive flow in single phase hy-drothermal systems, Am. J. Sci., 294, 529–592 1994.
Steefel, C. I. and MacQuarrie, K. T. B.: Approaches to model-ing reactive transport in porous media, in: Reactive Transport in Porous Media, edited by: Lichtner, P. C., Steefel, C. I., and Oelkers, E. H., Reviews in Mineralogy, 34, 83–125, 1996. Steefel, C. I. and Lichtner, P. C.: Multicomponent reactive transport
in discrete fractures: II. Infiltration of hyperalkaline groundwater at Maqarin, Jordan, a natural analogue site, J. Hydrol., 209, 200–
224, 1998.
Steefel, C. I., DePaolo, D. J., and Lichtner, P. C.: Reactive transport modeling: An essential tool and a new research approach for the Earth sciences, Earth Planet. Sci. Lett., 240, 539–558, 2005. Steefel, C. I.: Geochemical kinetics and transport, in: Kinetics of
Water-Rock Interaction, edited by: Brantley, S. L., Kubicki, J. D., and White, A. F., Springer, New York, 545–589, 2007. Steefel, C. I.: CrunchFlow Software for Modeling Multicomponent
Reactive Flow and Transport: USER’S MANUAL, Earth Sci-ences Division, Lawrence Berkeley National Laboratory, Berke-ley, CA, 2008.
Steefel, C. I. and Maher, K.: Fluid-rock interaction: A reactive transport approach, in: Reviews in Mineralogy and Geochem-istry, 70, 485–532, 2009.
Suchet, P. A., Probst, J. L., and Ludwig, W.: Worldwide distri-bution of continental rock lithology: Implications for the atmo-spheric/soil CO2uptake by continental weathering and alkalinity river transport to the oceans, Global Biogeochem. Cy., 17, 1038, doi:10.1029/2002gb001891, 2003.
Sverdrup, H. and Warfvinge, G.: Estimating field weathering rates using laboratory kinetics, in: Chemical Weathering Rates of Sil-icate Minerals, edited by: White, A. F. and Brantley, S. L., Min-eralogical Society of America, Washington DC, 485–542, 1995. Sverdrup, H., Warfvinge, P., Blake, L., and Goulding, K.: Mod-elling recent and historic soil data from the Rothamsted Experi-mental Station, UK using SAFE, Agriculture, Ecosyst. Environ., 53, 161–177, 1995.
Tosca, N. J.: Clay Mineral Assemblages Derived from Experimen-tal Acis-Sulfate Basaltic Weathering, 40th Lunar and Planetary Science Conference, 2009.
Uchida, T., Meerveld, I. T., and McDonnell, J. J.: The role of lat-eral pipe flow in hillslope runoff response: an intercomparison of non-linear hillslope response, J. Hydrol., 311, 117–133, 2005. van Hees, P. A. W., Lundstr¨om, U. S., and M¨orth, C. M.:
Dissolu-tion of microcline and labradorite in a forest O horizon extract: the effect of naturally occurring organic acids, Chem. Geol., 189, 199–211, 2002.
Welty, J. R., Wicks, C. E., and Wilson, R. E.: Fundamentals of Mo-mentum, Heat, and Mass Transfer, 3rd ed., John Wiley & Sons, NY, 803 pp., 1984.
White, A. F. and Blum, A. E.: Effects of climate on chemical weath-ering in watersheds, Geochim. Cosmochim. Acta, 59, 1729– 1747, 1995.
White, A. F. and Brantley, S. L.: The effect of time on the weath-ering of silicate minerals: why do weathweath-ering rates differ in the laboratory and field?, Chem. Geol., 202, 479–506, 2003. Wogelius, R. A. and Walther, J. V.: Olivine dissolution at 25 ˚ C:
Effects of pH, CO2, and organic acids, Geochim. Cosmochim. Acta, 55, 943–954, 1991.
Wolery, T. J., Jackson, K. J., Bourcier, W. L., Bruton, C. J., Viani, B. E., Knauss, K. G., and Delany, J. M.: Current status of the EQ3/6 software package for geochemical modeling, ACS Symp. Ser., 416, 104–116, 1990.
Wolff-Boenisch, D., Gislason, S. R., and Oelkers, E. H.: The effect of fluoride on the dissolution rates of natural glasses at pH 4 and 25◦C, Geochim. Cosmochim. Acta, 68, 4571–4582, 2004. Yang, L. and Steefel, C. I.: Kaolinite dissolution and precipitation