©2013 Science Publication
doi:10.3844/ajabssp.2013.293.301 Published Online 8 (4) 2013 (http://www.thescipub.com/ajabs.toc)
Corresponding Author: Sudesh Kumar Yadav, Biotechnology Division, CSIR-IHBT, Palampur-176061 (HP), India Fax: 91-1894-230425
A COMMON PROTEIN
EXTRACTION PROTOCOL FOR PROTEOMIC
ANALYSIS: HORSE GRAM A CASE STUDY
Jyoti Bhardwaj and Sudesh Kumar Yadav
Biotechnology Division, CSIR-IHBT, Palampur-176061 (HP), India
Received 2012-01-25, Revised 2013-10-25; Accepted 2013-10-28
ABSTRACT
Three protocols viz. Trichloroacetic Acid (TCA)-acetone, phenol and multi-detergent were compared for the extraction of proteins from horsegram (Macrotyloma uniflorum) which is less studied yet nutritionally and economically very important pulse crop. Almost equal quantity of proteins was extracted by all the three protocols. However, quality of protein from phenol method was superior to that from other protocols. Bands in One-Dimensional (1-D) and Two-Dimensional Electrophoresis (2-DE) of phenol protocol were reproducible and better. We report here a modified and common protocol for the extraction of proteins for proteomic analysis. The developed protocol is applicable not only to other economically important leguminous but also non-leguminous crops.
Keywords: Trichloroacetic Acid (TCA), Pinch of Bromophenol Blue (PBB), Two-Dimensional
Electrophoresis (2-DE), One-Dimensional (1-D), Sodium Dodecyl Sufate (SDS)
1. INTRODUCTION
Legumes form the third largest plant family (Dam et al., 2009). These are also among the largest and most diverse families of flowering plants (Brandon et al., 2007). Grain legumes contribute 33% of daily protein intake of humans (Graham and Vance, 2003). Model legume studies are important for establishing overall legume development (Dam et al., 2009). The most common legume models are peanut, Lotus, Medicago, soybean, scarletrunner bean, common bean, pea and broadbean (Goldberg et al., 1989; Johnson et al., 1994; Coste et al., 2001; Weterings et al., 2001; Weber et al., 2005). But we chose horsegram (Macrotyloma uniflorum) as the study material. Being a pulse legume it is rich in proteins. It is an important yet underexploited legume and is also known as the poor man’s pulse. It has been identified as potential food source for the future (Prakash et al., 2008; Kadam and Salunkhe, 1985).
Proteomics is the branch of science dealing with the isolation, identification and characterization of
Proteomics is a fast changing field and new protocols are being established frequently. Still there is a dearth of common protocols for extraction of proteins from variable sources. Since horsegram is an unexplored legume, its proteomic analysis requires special attention. Studies on biochemical parameters, antioxidant enzymes and computational study on miRNAs of horsegram has been already conducted in our lab. In this study, we developed a modified and common protocol using horsegram as a case study plant material. Further, the developed protocol was used to extract proteins from other legume and non-legume crops.
2. MATERIALS AND METHODS
2.1. Sample
Seeds were used for extraction of proteins from legumes. The legumes selected besides horsegram (Macrotyloma uniflorum) were rajmah (Phaseolus vulgaris), mah (Vigna mungo), chickpea (Cicer arietinum), masoor (Lens culinaris) and mungbean (Vigna radiata). Among non-legumes rice (Oryza sativa), wheat (Triticum aestivum), bajra (Pennisitum glaucum) and mustard (Brassica juncea) were taken for the study.
2.2. Protocols
The protocols are developed following the earlier used protocols (Cilia et al., 2009). The modifications made in the developed protocol are as follows. The first protocol used for extraction of the proteins was using TCA and acetone. The plant tissue (100 mg) was homogenized in 10% TCA containing 2% β -Mercaptoethanol (β-ME) using liquid nitrogen. It was kept overnight for precipitation at -20°C. Next day, the mixture was centrifuged at 5000 g for 30 min at 4°C. The supernatant was discarded and precipitates were washed thrice with ice cold acetone. The precipitates were agitated vigorously in between each wash. The precipitates were then air dried till they appeared to be damp but not dried or cracked. These precipitates were dissolved in 1 ml of the modified lysis buffer (9 M urea, 2 M thiourea, 1% DTT and 4% CHAPS).
The second protocol involved the extraction of proteins using phenol. Plant tissue (100 mg) was homogenized well in the modified phenol extraction buffer (500 mM Tris (pH 7.5), 2% non-idet P 40 (NP-40), 2% β-ME, 0.7 M sucrose, 0.5 M sodium chloride
and protease inhibitor cocktail). To this, equal volume of cold Tris-saturated phenol (pH 7.5) was added. This mixture was shaken vigorously for 30 min at 4°C and then centrifuged at 5000 g for 30 min at 4°C. The upper phenol phase containing the proteins was collected very carefully. Ammonium acetate (0.1 M) was added five times the volume of the phenol phase. Mixed well and kept for precipitation overnight at -20°C. Next day, the mixture was centrifuged at 5000 g for 30 min at 4°C. The supernatant was discarded and the precipitates were washed twice in methanol and thrice in ice-cold acetone as described for TCA-acetone protocol till their dissolution in the same lysis buffer.
For the third protocol, homogenization of 100 mg of tissue was done in the modified multi-detergent extraction buffer (100 mM dibasic potassium phosphate (pH 7.6), 8 M urea, 1% tritonX-100, 20% glycerol, 0.5 M sodium chloride and protease inhibitor cocktail). This was shaken at room temperature for 10-15 min and then centrifuged at 9500 g for 30 min at 4°C. To the supernatant equal volume of 10% TCA containing 2% β-ME was added and kept overnight for precipitation at -20°C. Next day, the mixture was centrifuged at 5000 g for 30 min at 4°C. The supernatant was discarded and the precipitates were washed thrice in ice-cold acetone as described for TCA-acetone protocol till their dissolution in the same lysis buffer.
2.3. Quantification and 1-DE
The proteins were quantified using Bradford reagent (Bradford, 1976) and samples were analyzed in triplicates. Sodium Dodecyl Sufate (SDS) PAGE (12%) was used for 1-D electrophoresis analysis. The volume for each sample used was 25 µ L−1. The gels were run at 30 mA of current per gel in the stacking gel and at 35 mA in the separating gel. The gels were stained in CBB and then destained in a solution containing 10% glacial acetic acid and 30% methanol.
2.4. 2-DE
before use. A total of 125 µ L of rehydration buffer containing the sample was evenly distributed in the rehydration strip holder. The 7cm IPG strip (pH 3-10 nonlinear, GE Healthcare, Sweden) was placed on it and this assembly was allowed to rehydrate passively overnight. IEF was conducted in Ettan IPGphor II (GE Healthcare, sigma). Current of 50 A strip as applied. The focusing conditions were: step 1-300 V, step 2-500 V, step 3-1000 V and step 4-2-5000V. The focused strips were first reduced in equilibration buffer (6 M urea, 50 mM Tris pH (8.8), 30% glycerol, 2% SDS and Pinch of Bromophenol Blue (PBB)) containing 50 mg DTT(added just prior to use) for 15 min on a gel rocker at room temperature. The reduced strips were then alkylated by adding fresh 75 mg Iodoacetamide (IAA) at similar conditions. The reduced and alkylated strips were washed with 1× SDS buffer. These strips were then loaded onto 12% SDS PAGE without any stacking gel. This assembly was sealed using 1% agarose sealing buffer. The gels were run, stained and destained just as for 1-D electrophoresis. The gels were scanned using Imagemaster 2D Platinum (GE Healthcare, Sweden).
3. RESULTS AND DISCUSSION
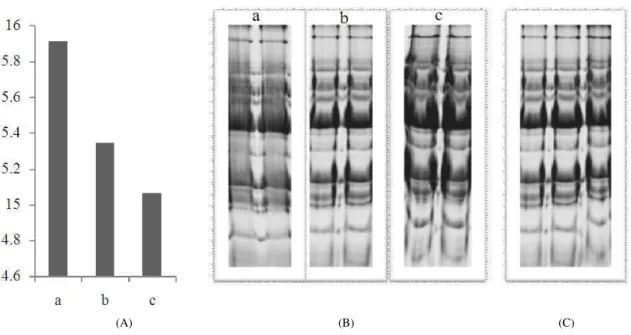
According to the protein yield results, all the three protocols were almost at par with each other (Fig. 2). TCA-acetone and phenol-acetone protocols yielded 15.92±0.02 and 15.35±0.09 mg g−1 FW protein while multi-detergent protocol yielded 15.07±0.11 mg g−1 FW protein. Our results are in agreement to the earlier reported studies (Cilia et al., 2009; He and Wang, 2008). They have also documented the highest protein yield by TCA-acetone protocol. But based on the quality of 1-D and 2-DE analysis phenol method was chosen for extraction of proteins. Many other groups working with extraction of proteins for 2-DE has chosen phenol method directly or with modifications for their analysis (Wang et al., 2006; Cilia et al., 2009; Dam et al., 2009).
3.1. Phenol-Acetone Protocol was Better Than
Other Two Protocols
The pellets following precipitation from the three extraction protocols had unique characteristics. The precipitants from the TCA-acetone protocol were good in amount and easy to handle. These were off white in color, grainy, little viscous but solublized in lysis buffer moderately giving a turbid solution
initially. Earlier also pellets from TCA-acetone protocol have been found to be light brown in color and grainy in nature (Cilia et al., 2009). Homogenizing the sample in 10% TCA dissolved in acetone was found to almost immediately precipitate proteins. It also allowed interfering substances that dissolved in the acetone to be washed from the precipitated proteins and provided a clean sample for IEF. Although this protocol is effective for some plant tissues, it often results in the co-extraction of polymeric contaminants (Rose et al., 2004). These contaminants precipitate with proteins and cannot be removed by the final washing steps (He and Wang, 2008). The precipitants from the phenol-acetone protocol were whitish in color, flaky, non-viscous, easy to handle and solubilized immediately in the lysis buffer. It has been reported earlier that the protein pellet from phenol extraction is usually white and a yellowish pellet indicates co-precipitation of phenolic compounds. Such pellets have been reported to be easily dissolved in the rehydration buffer. Hence, qualitatively the phenol extraction has been considered to give the cleanest and most soluble pellet (Cilia et al., 2009). Interestingly, another study has reported that non-protein contaminants can be removed using phenol protocol resulting in change in color of the ground powder from brownish to white (He and Wang, 2008). However, the precipitants from the multi-detergent protocol were yellowish in color and very difficult to handle being sticky in nature. These were not easily soluble in lysis buffer. These problems along with lower protein yield makes this protocol unfit according to our studies. It has also been reported earlier that the pellets from multi-detergent protocol are dark-brown in color and viscous in nature (Cilia et al., 2009).
Fig. 1. Flowchart of the three protocols used for the extraction of proteins for 2-DE
(A) (B) (C)
(A) (B)
(C)
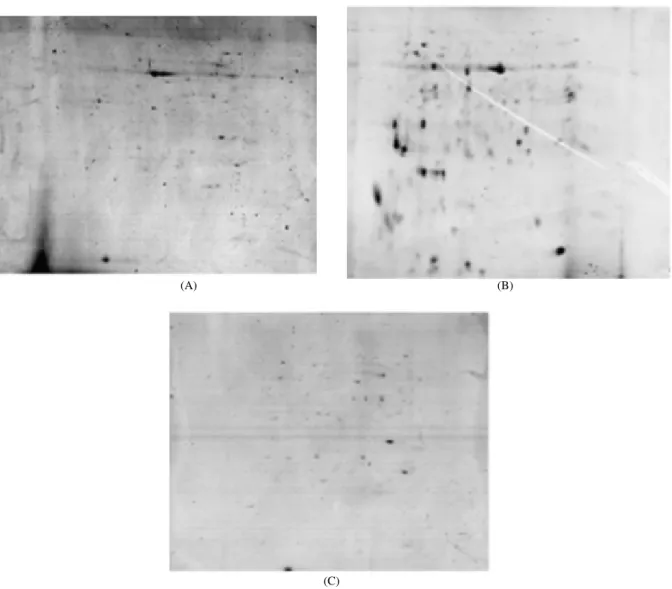
Fig. 3. Two-dimensional electrophoresis analysis of the three protocols compared for extraction of proteins from horsegram seedlings. (A) TCA-acetone (B) Phenol-acetone and (C) Multi-detergent
After the initial screening at the 1-D electrophoresis level, the quality of proteins were checked on 2-DE (Fig. 3). We observed that the phenol-acetone method gave good and clear spots on the 2-DE gel. The other two protocols gave lesser number of protein spots being difficult to observe. Most of the spots present in the phenol-acetone protocol were either absent or less visible in the 2-DE pattern of other two protocols. The enhanced performance of the phenol-acetone extraction protocol could be due to the fact that contaminants were eliminated more efficiently with the aqueous phase. It has been reported earlier that phenol protocol resulted in better 2-DE quality than TCA-acetone although latter gave higher protein yield (He and Wang, 2008). Taken together, the quantitative, qualitative, 1-D and 2-DE analysis of the protocols tested, we found the
phenol-acetone protocol better for extraction of protein from horsegram for 2-DE.
3.2. Phenol-Acetone Protocol Can be Applied to
Both Legumes and Non-Legumes
(A) (B)
(C) (D)
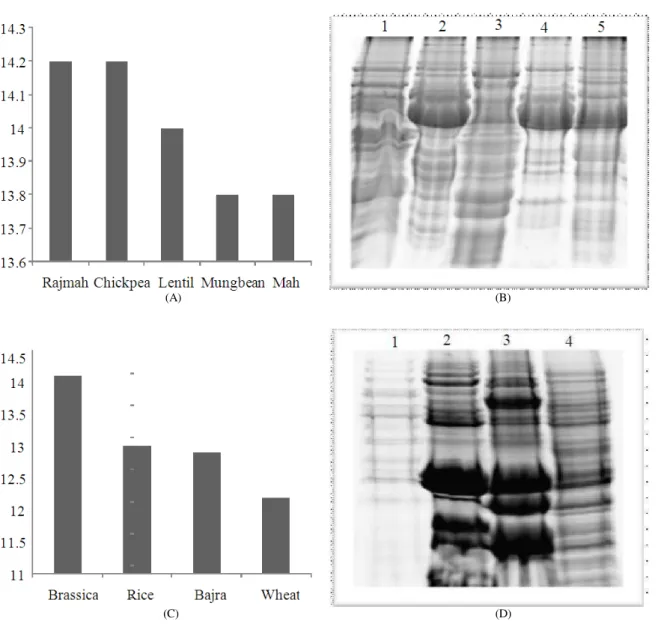
Fig. 4. Extraction of proteins from different legumes and non-legumes using phenol-acetone protocol. Protein yields in legumes (A) and non-legumes (C). SDS-PAGE of proteins from (B) legumes (Lane 1- rajmah, Lane 2- mah, Lane 3- chickpea, Lane 4-mungbean and Lane 5- lentil) and (D) non-legumes (Lane 1-wheat, Lane 2-rice, Lane 3-mustard and Lane 4-bajra)
Good banding patterns were observed in 1-D electrophoresis for different legumes and non-legumes (Fig. 4). Among non-legumes, the intensity of bands was less for wheat while rice and mustard showed good bands. Best protein bands among non-legumes were observed for bajra. This protocol extracts good and fairly equal amount of proteins from leguminous as well as non-leguminous samples as is shown by quantification of proteins. Earlier, a protocol based on phenol extraction has been reported to be highly effective for the production of high-quality protein samples from only recalcitrant plant tissues (Wang et al., 2006). Phenol protocol has also been applied for extraction of proteins from different plants. However,
there was no quantification data (Cilia et al., 2009; He and Wang, 2008).
4. CONCLUSION
2006; He and Wang, 2008; Barraclough et al., 2004). However, we have standardized a common protocol for protein extraction from legumes and non-legumes. We tried different combinations of chemicals and detergents to modify the extraction and lysis buffers. Finally, we decided not to make any changes in the first protocol. But the extraction buffers for second and third protocol were modified for better extraction as is evident by protein yield. The reason behind this could be that TCA-acetone protocol is simpler than phenol protocol. The number of steps in the phenol or multi-detergent protocol might have caused some loss of proteins quantitatively. The lysis buffer common to all three protocols was also modified for better solubilization. In phenol protocol the extraction buffer was modified to suit extraction of proteins from plant. Instead of potassium chloride we used sodium chloride as latter is more commonly used for extraction of proteins from plant sources. Polyvinylpolypyrrolidone (PVPP), PMSF and EDTA were not used. We used NP-40 and protease inhibitor cocktail in the phenol extraction buffer. One washing step with acetone was increased for the phenol protocol. Therefore, we call our method phenol-acetone protocol. In multi-detergent extraction buffer, 8 M urea was used instead of 7 M urea. Amidosulfobetaine-14 and 1% dodecyl maltoside were omitted. We used sodium chloride and tritonX-100. CHAPS and thiourea were omitted from the extraction buffer. In the lysis buffer, 9 M urea was used instead of 7 M and 1% DTT was added to enhance solubility besides the usual components.
Earlier also a combination of TCA/acetone and phenol protocol has been shown to provide enhanced 2-DE based proteomic analysis of most plant tissues (Cilia et al., 2009; Wang et al., 2006). Protein extraction from plant tissues is challenging due to relatively low protein concentration and high levels of polysaccharides, polyphenols, pigments and lipids. These all can contribute to horizontal or vertical streaking, proteolytic degradation and artificial migrations on 2-DE gels (Carpentier et al., 2005). Protein extraction methods to obtain well-resolved 2-DE maps from different samples have been reported previously (Wang et al., 2006; Charmont et al., 2005; Mijnsbrugge et al., 2000). Methanol is often used to extract polyphenolic compounds. However, in combination with ammonium acetate it facilitates the extraction of proteins by phenol at an increased pH (Wang et al., 2006). It is known that exposure to low pH may lead to protein degradation or modifications,
therefore buffers were kept within pH 7-8. Earlier also in a study on Aloe vera, a lysis buffer with pH around or above 8 for all three methods has been used resulting in better performance at 2-DE (Wang et al., 2006; He and Wang, 2008). The strips chosen (pH 3-10) have allowed a good resolution of the legume proteins that mostly range in pI from 4-7. Despite the fact that phenol-acetone protocol involves more number of steps, its reproducibility, good protein yield and high intensity bands/spots makes it a better protocol.
4.1. Funding Information
This study was supported by Department of Science and Technology, GOI in the form of project (SR/WOS-A/LS-243/2009) granted to JB under WSS (WOS-A) scheme.
5. ACKNOWLEDGEMENT
Researchers are full of gratitude towards the Director, CSIR-IHBT for his support and facility. Council of Scientific and Industrial Research, GOI is duly acknowledged for financial support in the laboratory.
6. REFERENCES
Barraclough, D., D.M. Obenland, W. Laing and T. Carrol, 2004. A general method for two-dimensional protein electrophoresis of fruit samples. Postharvest
Biol. Tecnol., 32: 175-181. DOI:
10.1016/j.postharvbio.2003.11.002
Bradford, M.M., 1976. A rapid and sensitive method for the quantitation of microgram quantities of protein utilizing the principle of protein-dye binding. Anal. Biochem., 72: 248-254. DOI: 10.1016/0003-2697(76)90527-3
Brandon, H.L., J.A. Wagmaister, T. Kawashima, A.Q. Bui and J.J. Harada et al., 2007. Using genomics to study legume seed development. Plant Physiol., 144: 562-574. DOI: 10.1104/pp.107.100362 Broughton, W.J., G. Hernandez, M. Blair, S. Beebe and
P. Gepts et al., 2003. Beans (Phaseolus spp.)-model food legumes. Plant Soil, 252: 55-128. DOI: 10.1023/A:1024146710611
Carpentier, S.C., E. Witters, K. Laukens, P. Deckers and R. Swennen et al., 2005. Preparation of protein extracts from recalcitrant plant tissues: An evaluation of different methods for two-dimensional gel electrophoresis analysis.
Proteomics, 5: 2497-2507. DOI:
Charmont, S., E. Jamet, R. Pont-Lezica and H. Canut, 2005. Proteomic analysis of secreted proteins from Arabidopsis thaliana seedlings: Improved recovery following removal of phenolic compounds.
Phytochem, 66: 453-461. DOI:
10.1016/j.phytochem.2004.12.013
Cilia, M., T. Fish, X. Yang, M. Mclaughlin and T.W. Thannhauser et al., 2009. A comparison of protein extraction methods suitable for gel-based proteomic studies of aphid proteins. J. Biomol. Tech., 20: 201-215. PMID: 19721822
Coste, F., B. Ney and Y. Crozat, 2001. Seed development and seed physiological quality of field grown beans (Phaseolus vulgaris L.). Seed Sci. Technol., 29: 121-136.
Dam, S., S.B. Laursen, J.H. Ornfelt, B. Jochimsen and H.H. Stærfeldt et al., 2009. The proteome of seed development in the model legume Lotus japonicas. Plant Physiol., 149: 1325-1340. DOI: 10.1104/pp.108.133405
Gallardo, K., C.L. Signor, J. Vandekerckhove, R.D. Thompson and J. Burstin, 2003. Proteomics of Medicago truncatula seed development establishes the time frame of diverse metabolic processes related to reserve accumulation. Plant Physiol., 133: 664-682. DOI: 10.1104/pp.103.025254
Gepts, P., W.D. Beavis, E.C. Brummer, R.C. Shoemaker and H.T. Stalker et al., 2005. Legumes as a model plant family. Genomics for food and feed report of the cross-legume advances through genomics Conference. Plant
Physiol., 137: 1228-1235. DOI:
10.1104/pp.105.060871
Goldberg, R.B., S.J. Barker and L. Perez-Grau, 1989. Regulation of gene expression during plant embryogenesis. Cell, 56: 149-160. PMID: 2643470
Graham, P.H. and C.P. Vance, 2003. Legumes: Importance and constraints to greater use. Plant Physiol., 131: 872-877. DOI: 10.1104/pp.017004 Gygi, S.P., Y. Rochon, B.R. Franza and R. Aebersold,
1999. Correlation between protein and mRNA abundance in yeast. Mol. Cell Biol., 19: 1720-1730. PMID: 10022859
He, C.F. and Y.M. Wang, 2008. Protein extraction from leaves of Aloe vera L., a succulent and recalcitrant plant, for proteomic analysis. Plant Mol. Biol. Rep., 26: 292-300. DOI: 10.1007/s11105-008-0040-9
Imin, N., F.D. Jong, U. Mathesius, G.V. Noorden and N.A. Saeed et al., 2004. Proteome reference maps of Medicago truncatula embryogenic cell cultures generated from single protoplasts. Proteomics, 4: 1883-1896. DOI: 10.1002/pmic.200300803
Jackson, S.A., D. Rokhsar, G. Stacey, R.C. Shoemaker and J. Schmutz et al., 2006. Toward a reference sequence of the soybean genome: A multiagency effort. Crop Sci., 46: S55-S61. DOI: 10.2135/cropsci2006.08.0514tpg
Johnson, S., C.M. Liu, C.L. Hedley and T.L. Wang, 1994. An analysis of seed development in Pisum sativum XVIII. The isolation of mutants defective in embryo development. J. Exp. Bot., 45: 1503-1511. DOI: 10.1093/jxb/45.11.1503
Kadam, S.S. and D.K. Salunkhe, 1985. Nutritional composition, processing and utilization of horse gram and moth bean. Crit. Rev. Food Sci. Nutr., 22: 1-26. PMID: 3899515
Lei, Z., A.M. Elmer, B.S. Watson, R.A. Dixon and P.J. Mendes et al., 2005. A two-dimensional electrophoresis proteomic reference map and systematic identification of 1367 proteins from a cell suspension culture of the model legume Medicago truncatula. Mol. Cell Proteom., 4: 1812-1825. DOI: 10.1074/mcp.D500005-MCP200 Mathesius, U., G. Keijzers, S.H. Natera, J.J. Weinman and M.A. Djordjevic et al., 2001. Establishment of a root proteome reference map for the model legume Medicago truncatula using the expressed sequence tag database for peptide mass fingerprinting. Proteomics, 1: 1424-1440. DOI: 10.1002/1615-861200111
Mijnsbrugge, K.V., H. Meyermans, M. Van Montagu, G. Bauw and W. Boerjan, 2000. Wood formation in poplar: Identification, characterization and seasonal variation of xylem proteins. Planta, 210: 589-598. DOI: 10.1007/s004250050048.
Prakash, B.G., M.B. Guled and A.M. Bhosale, 2008. Identification of suitable horsegram varieties for northern dry zone of Karnataka. Karnataka. J. Agric. Sci., 21: 343-345.
Rose, J.K., S. Bashir, J.J. Giovannoni, M.M. Jahn and R.S. Saravanan, 2004. Tackling the plant proteome: Practical approaches, hurdles and experimental tools. Plant J., 39: 715-733. DOI: 10.1111/j.1365-313X.2004.02182.x
Wang, W., R. Vignani, M. Scali and M. Cresti, 2006. A universal and rapid protocol for protein extraction from recalcitrant plant tissues for proteomic analysis. Electrophoresis, 27: 2782-2786. DOI: 10.1002/elps.200500722
Weber, H., L. Borisjuk and U. Wobus, 2005. Molecular physiology of legume seed development. Ann. Rev.
Plant Biol., 56: 253-279. DOI:
10.1146/annurev.arplant.56.032604.144201
Weterings, K., N.R. Apuya, Y. Bi, R.L. Fischer and J.J. Harada et al., 2001. Regional localization of suspensor mRNAs during early embryo development. Plant Cell, 13: 2409-2425. DOI: 10. 1105/tpc.010326
Young, N.D., S.B. Cannon, S. Sato, D. Kim and D.R. Cook et al., 2005. Sequencing the genespaces of Medicago truncatula and Lotus japonicus. Plant
Physiol., 137: 1174-1181. DOI: