A simple, economical and reproducible protein extraction protocol
for proteomics studies of soybean roots
Elisete Pains Rodrigues
1,2, Adalgisa Ribeiro Torres
1, Jesiane Stefânia da Silva Batista
1, Luciano Huergo
3and Mariangela Hungria
11
Embrapa Soja, Londrina, PR, Brazil.
2
Departamento de Biologia, Universidade Estadual de Londrina, Londrina, PR, Brazil.
3
Deptartamento de Bioquímica e Biologia Molecular, Universidade Federal do Paraná, Curitiba, PR,
Brazil.
Abstract
Sample preparation is a critical step in two-dimensional gel electrophoresis (2-DE) of plant tissues. Here we describe a phenol/SDS procedure that, although greatly simplified, produced well-resolved and reproducible 2-DE profiles of protein extracts from soybean [Glycine max (L.) Merril] roots. Extractions were made in three replicates using both the original and simplified procedure. To evaluate the quality of the extracted proteins, ten spots were randomly se-lected and identified by mass spectrometry (MS). The 2-DE gels were equally well resolved, with no streaks or smears, and no significant differences were observed in protein yield, reproducibility, resolution or number of spots. Mass spectra of the ten selected spots were compared with database entries and allowed high-quality identification of proteins. The simplified protocol described here presents considerable savings of time and reagents without com-promising the quality of 2-DE protein profiles and compatibility with MS analysis, and may facilitate the progress of proteomics studies of legume-rhizobia interactions.
Key words:2-DE, protein extraction, proteomics, soybean roots, symbiosis.
Introduction
Sample preparation, a critical step in proteomics re-search using two-dimensional gel electrophoresis (2-DE) (Saravanan and Rose, 2004) is particularly troublesome in studies with plants, the tissues of which are often rich in proteases and interfering compounds such as polysaccha-rides, lipids and phenols (Carpentier et al., 2005). Such contaminants interfere with protein separation and analy-sis, resulting in horizontal and vertical streaking, smearing, and in decreased number of distinctly resolved spots. In ad-dition, plant tissues have low protein content in comparison to animal and bacterial sources, therefore effective extrac-tion of proteins is essential to obtain successful results (Saravanan and Rose, 2004; Carpentieret al., 2005).
Proteomics studies allow quantitative and qualitative comparisons of proteins, therefore any loss of protein at any step in the analysis process is critical. Furthermore, it is es-sential to obtain high-quality gels with well-resolved spots showing reproducible protein patterns (Hurkman and Tana-ka, 1986). The extraction method must preserve the quality
and quantity of the proteins extracted and for that sample treatment must be kept to a minimum number of steps, to minimize protein loss (Hurkman and Tanaka, 1986; Wes-termeier and Naven, 2002).
Root-nodule symbioses of rhizobia with legumes, re-sulting in biological nitrogen fixation, represent a major subject of study, due to their contribution to the global ni-trogen cycle and to the economic importance of legume crops such as soybean [Glycine max(L.) Merr.]. Research in our laboratory is focused mainly on soybean and com-mon bean (Phaseolus vulgarisL.) symbioses, generally in-volving nodulated roots. Although a one-step procedure for protein extraction would be highly desirable, no single method of sample preparation can be universally applied to 2-DE analysis (Dunn, 1999). Due to the need for a simple method that could be applied routinely to proteomics stud-ies of symbiotic interactions, we optimized a phenol/SDS based method described previously (Wang et al., 2006). The simplified method presented here was able to produce well-resolved and reproducible 2-DE protein profiles of soybean roots and it was also compatible with matrix-assisted laser desorption ionization time-of-flight/mass spectrometry (MALDI-TOF/MS) analysis, enabling the successful identification of the proteins. This study offers a Send correspondence to Mariangela Hungria. Embrapa Soja,
Caixa Postal 231, 86001-970 Londrina, PR, Brazil. E-mail: [email protected]; [email protected].
useful workflow for proteomics of legume-rhizobia symbi-oses using 2-DE and MS analysis.
Materials and Methods
Plant material
Surface-sterilized soybean seeds were inoculated with Bradyrhizobium japonicum strain CPAC 15 (= SEMIA 5079) and grown aseptically receiving sterile N-free nutrient solution. Roots of 13-day-old soybean seed-lings were harvested, immediately frozen in liquid nitrogen and stored at -80 °C until extraction. At this stage only ule primordia were present, with no fully developed nod-ules. Roots were finely powdered by grinding in a mortar and pestle with liquid nitrogen, which, as emphasized ear-lier (Giavaliscoet al., 2003), is a critical step in obtaining high resolution of proteins in 2-DE gels.
Protein extraction
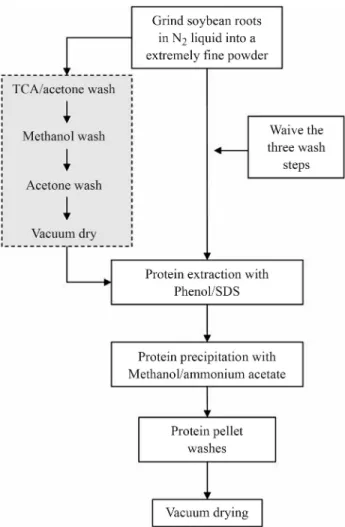
The simplified protocol is based on the phenol/SDS method described previously (Wanget al., 2006), which comprises three successive washes with trichloroacetic acid (TCA) in acetone, methanol and acetone, followed by a vacuum-drying step before the phenol/SDS extraction. The modifications in our method are the elimination of three preliminary wash steps and of the vacuum-drying step, representing considerable economy of reagents and time (Figure 1).
For comparison, proteins were extracted from soy-bean root samples using the simplified method described here and the original phenol/SDS method (Wang et al., 2006). For both methods, protein extraction and 2-DE were performed with three replicates and comparisons were made for protein yields and 2-DE gel resolution and repro-ducibility.
Pulverized samples (250 mg) were resuspended in 0.8 mL of Tris-buffered phenol, pH 8.0, and 0.8 mL of SDS buffer [0.1 M Tris-HCl pH 8.0, 2% SDS, 5%b -mercapto-ethanol, 30% sucrose, 1 mM phenylmethylsulfonyl fluo-ride (PMSF)]. The samples were vigorously vortexed for 10 min and centrifuged at 16,000gfor 5 min at 4 °C, and the top phenol layer (0.5 mL) was transferred to a new tube. Proteins were precipitated for 2 h at -20 °C with three vol-umes of pre-cooled 0.1 M ammonium acetate in absolute methanol and then pelleted by centrifugation (16,000gfor 5 min at 4 °C). The pellet was washed once with pre-cooled 0.1 M ammonium acetate in methanol and once with pre-cooled 80% v/v acetone, followed by vacuum drying.
The protein pellets were solubilized in isoelectric fo-cusing (IEF) buffer (7 M urea, 2 M thiourea, 4% 3-[(3-cholamidopropyl)dimethylammonio]-1-propanesulfonate (CHAPS), 20 mMdithiothreitol (DTT), 0.5% immobilized pH gradient (IPG) buffer, pH 3-10 or 4-7), by pipetting fol-lowed by sonication for 30 s (2x) in a water bath sonicator at 15-20 °C. The solubilized proteins were quantified using
the Bradford protein assay (Bradford, 1976) with a bovine serum albumin (BSA) standard curve.
Isoelectric focusing
For the first dimension, 350mg of solubilized protein was transferred to a fresh tube and the volume was brought up to 0.25 mL with De Streak buffer (GE Biosciences). The protein suspensions were rehydrated overnight into IPG strips (linear pH 3-10 or 4-7, 13 cm, GE Biosciences). Next, IEF was carried out on the IPGphor II (Amersham Biosci-ences) with a current limit of 50mA/strip at 20 °C using a focusing protocol: 1 h at 200 V, 1 h at 500 V, 1 h at 1,000 V (gradient), 2.5 h at 8,000 V (gradient) and then 1.5 h at 8,000 V, reaching a total of 24.8 kVh.
SDS-PAGE
(11.6%) and overlaid with agarose solution. Second dimen-sion electrophoresis was carried out using an SE 600 Ruby (GE Biosciences) with the first current cycle at 15 mA per gel (30 min) and a second cycle at 30 mA per gel (4 h). Next, gels were stained overnight with Comassie Brilliant Blue (CBB) R-350 (GE Biosciences), destained in a solu-tion of 40% ethanol and 10% acetic acid and scanned (ImageScanner LabScan v. 5.0). The 2-DE gel images were analyzed using the Image Master 2-D Platinum v.5.0 soft-ware (GE Biosciences).
MALDI-TOF/MS analysis and protein identification
Randomly selected spots were excised and processed as described before (Chaveset al., 2009), with slight modi-fications on the digestion procedure, done with trypsin (Gold, mass spectrometry grade, Promega, Madison, WI) at 37 °C overnight. For MALDI-TOF analysis, 0.5mL of the tryptic peptide was mixed with a matrix solution of sat-urateda-cyano-4-hydroxycinnamic acid (HCCA) in aceto-nitrile 50%/trifluoroacetic acid (TFA) 0.1%. The mixture was spotted onto a MALDI sample plate and allowed to crystallize at room temperature. The same procedure was used for the standard peptide calibration mix (Bruker Dal-tonics).
Mass spectra were acquired using a MALDI-TOF-MS Autoflex spectrometer (Bruker Daltonics) operated in the reflector for MALDI-TOF peptide mass fingerprint (PMF) with a fully manual mode, using FlexControl soft-ware. For protein identification, PMFs generated were sear-ched against the NCBInr database using the MASCOT software (Matrix Science). For the protein search, monoi-sotopic masses were used and a peptide tolerance of 100 ppm and one missed cleavage was allowed. Carbami-domethylation of cysteine and oxidation of methionine were taken into consideration as fixed and variable modifi-cations, respectively.
Results and Discussion
Quantitative comparison of protein samples obtained with the two extraction protocols indicated that protein yields were statistically equal (ANOVA, p < 0.05) (Ta-ble 1). The protein values recovered by both methods were within the range of those reported in the literature for plant roots (Westermeier and Naven, 2002; Saravanan and Rose, 2004); however, the slightly higher protein yield obtained
in our modified method might be attributed to the removal of the preliminary washes, which were part of the original method, and potentially preventing protein loss. Any in-crease in protein yield is important when the material under analysis is limited or when the protein content is low, as is the case with soybean roots.
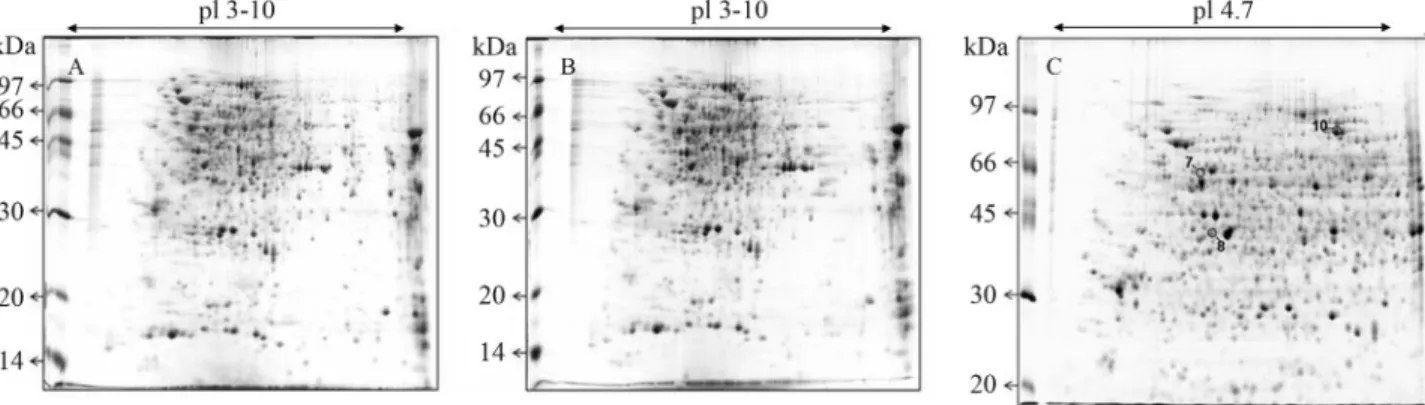
A prerequisite, but also a major challenge in proteo-mic analysis, is the separation of proteins from complex bi-ological samples with high resolution and reproducibly (Görg et al., 2004). Both the original and the modified methods tested in this study have proven to be suitable to obtain proteins from soybean roots, resulting in high-qua-lity 2-DE gels (Figure 2). The proteins were well resolved on gels, with no streaks or smears, indicating insignificant degradation of proteins and efficient removal of contami-nant compounds.
The removal of interfering compounds prior to pro-tein extraction may also be critical (Saravanan and Rose, 2004; Carpentieret al., 2005), and washes with TCA and acetone are usually performed to eliminate salts, poly-phenols, and also to minimize protein degradation (Görget al., 2004). However, no evident improvements were ob-served by preliminary TCA/acetone, methanol and acetone washes (Figure 2), proving that our modified protocol is suitable both for removing interfering compounds and min-imizing protein degradation in extracts from soybean root tissues.
Another limitation may result from changes in factors such as pH, ionic strength, and temperature that may lead to selective losses of proteins; the more steps in the extraction process, the greater are the chances of losing or erroneously detecting differentially expressed protein subsets (Roseet al., 2004). Decreasing the number of treatment steps in our method may help to avoid protein losses and, at the same time, enable high-quality images, with no need of cleanup steps to reduce background smear or to remove horizontal and/or vertical streaks.
Both protocols gave well-resolved and reproducible spot patterns (Figure 2). Fully automatic spot detection and matching were performed, and the data indicating the re-producibility of each protocol are shown in Table 1. Statis-tically similar numbers (ANOVA, p < 0.05) of detected spots were observed when both methods were compared. Spots matched in all three replicate gels ranged from 84% in the original phenol/SDS (Wanget al., 2006) to 88% in our modified method (Table 1).
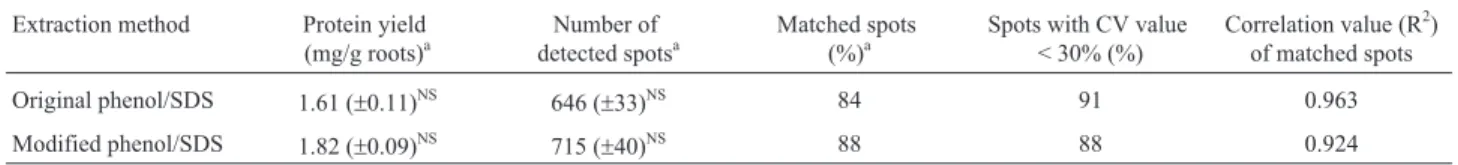
Table 1- Recovered protein yield and reproducibility from soybean root proteins using two protein extraction methods and IPG strips (13 cm) with a lin-ear pH range 3-10. a: Values represent the means of three independent biological replicates with standard deviation in parentheses; NS: Values show no statistically significant difference (ANOVA test, p < 0.05).
Extraction method Protein yield (mg/g roots)a
Number of detected spotsa
Matched spots (%)a
Spots with CV value < 30% (%)
Correlation value (R2) of matched spots
Original phenol/SDS 1.61 (±0.11)NS 646 (±33)NS 84 91 0.963
To assess reproducibility of the protein patterns, we performed a correlation analysis and estimated the coeffi-cient of variation (CV) of the calculated normalized spot volumes (% vol) from pairwise matched spots obtained in each extraction protocol (Table 1). Considering the similar-ities between gels, the correlation (R2) of the %vol of spots was higher than 0.92 for both protocols, indicating high reproducibility. In agreement with previously reported data (Molloyet al., 2003), CV values lower than 30% were con-sidered as indicative of the quality of the experiment, and for our modified method and the original phenol/SDS me-thod (Wanget al., 2006), the CV% for the %vol was lower than 30% for 88% and 91% of matched spots, respectively. CV values higher than 30% were obtained only for spots prone to mismatches due to local pattern distortions.
In 2-DE gels using 3-10 pH IPG strips, about 65% of total spots were concentrated in the 4-7 pH range, prompt-ing us to choose this narrower range to increase the resolu-tion of the proteins concentrated in this pH region and to facilitate comparative studies of soybean root proteins. A total of 512±42 spots were detected on the gel by using a pH 4-7 IPG strip (Figure 2). Three of these spots were ran-domly selected (Figure 2) and subjected to MALDI-TOF mass spectrometry analysis. The searching of MS data against the NCBInr protein database using Mascot allowed the protein identification of all selected spots, as listed (Ta-ble 2). In all cases, both significant protein score values in Mascot identifications and a high percentage of sequence
coverage were obtained. The high quality of MS data indi-cated the compatibility of the optimized protein extraction method with MALDI-TOF/MS.
Among the proteins identified, one is related to the peroxisomal betaine-aldehyde dehydrogenase that cata-lyzes the conversion of betaine aldehyde to betaine, a carbon or nitrogen source and an important osmo-protectant agent (Pocardet al., 1997). Betaine was also known to be one of the non-flavonoid compounds that is able to inducenodgenes in rhizobia (Subramanianet al., 2007).
We have also identified a cytosolic glutamine syn-thetaseb1 (GS-b1), a key enzyme responsible for the pri-mary assimilation of ammonia in root nodules of legumes. Theb1-form is considered the constitutive isoform, but it is expressed in relatively high levels in nodules. It has been demonstrated that, in soybean, the GS-b1 gene (glnb1) is induced in nodules by reduced N or its assimilation prod-ucts, showing that its expression is regulated by physiologi-cal changes (Moreyet al., 2002). Methionine synthase was the third identified protein.
In conclusion, the protocol presented here, although greatly simplified, allowed well-resolved and reproducible spot patterns on 2-DE gels of soybean root proteins. Our sample preparation helped avoid protein modifications or losses and facilitated reproducibility. The modified method presented in this study proved to be efficient, simple, eco-nomical and appropriate for proteomics studies with
Table 2- Selected protein spots identified by MALDI-TOF.
Spot no. Protein name and organism GenBank accession
number
Mascot score
N1 Cov2 pI3 MW4(kDa)
Exp.5 The.6 Exp.5 The.6
7 Peroxisomal betaine-aldehyde dehydrogenase (Glycine max) gi|167962545 79 10 22 5.03 5.23 65 55.4
8 Cytosolic glutamine synthetase (Glycine max) gi|10946357 78 9 29 5.15 5.48 45 39.1
10 Methionine synthase (Glycine max) gi|33325957 107 13 18 6.26 5.93 85 84.4
1Number of peptides identified;2Sequence coverage (%);3Isoelectric point;4Molecular weight (kDa);5Experimental value;6Theoretical value.
soybean roots, and will likely be applicable to the root tis-sues of other plants.
Acknowledgments
Research described herein was partially supported by CNPq (Conselho Nacional de Desenvolvimento Científico e Tecnológico, Brazil), Project Genosoja. The MALDI-TOF system was acquired with resources from Fundação Araucária. The authors would like to thank Dr. E.M. Souza and F. Pedrosa for their help and suggestions in the proteo-me analysis. E. Rodrigues and A. Torres received fellow-ships from CNPq and J.S.S. Batista a fellowship from CAPES (Coordenação de Aperfeiçoamento de Pessoal de Nível Superior, Brazil). M. Hungria is also a research fel-low of CNPq.
References
Bradford MM (1976) A dye binding assay for protein. Anal Biochem 72:248-254.
Carpentier SC, Witters E, Laukens K, Deckers RS and Panis B (2005) Preparation of protein extracts from recalcitrant plant tissues: An evaluation of different methods for two-dimen-sional gel electrophoresis analysis. Proteomics 5:2497-2507.
Chaves DFS, Souza EM, Monteiro RA and Pedrosa FO (2009) A two-dimensional electrophoretic profile of the proteins se-creted by Herbaspirillum seropedicae strain Z78. J Pro-teomics 73:50-56.
Dunn MJ (1999) Detection of total proteins on western blots of 2-D polyacrylamide gels. In: Link AJ (ed) Methods in Mo-lecular Biology: 2-D Proteome Analysis Protocols, vol. 112. Humana Press, New Jersey, pp 319-329.
Giavalisco P, Nordhoff E, Lehrach H, Gobom J and Klose J (2003) Extraction of proteins from plant tissues for two-dimensional electrophoresis analysis. Electrophoresis 24:207-216.
Görg A, Weiss W and Dunn MJ (2004) Current two-dimensional electrophoresis technology for proteomics. Proteomics 4:3665-3685.
Hurkman WJ and Tanaka CK (1986) Solubilization of plant mem-brane proteins for analysis by two-dimensional gel electro-phoresis. Plant Physiol 81:802-806.
Molloy MP, Brzezinski EE, Hang J, McDowell MT and VanBo-gelen RA (2003) Overcoming technical variation and bio-logical variation in quantitative proteomics. Proteomics 3:1912-1919.
Morey KJ, Ortega JL and Sengupta-Gopalan C (2002) Cytosolic glutamine synthetase in soybean is encoded by a multigene family, and the members are regulated in an organ-specific and developmental manner. Plant Physiol 128:182-193. Pocard JA, Vincent N, Boncompagni E, Smith LT, Poggi MC and
Le Rudulier D (1997) Molecular characterization of thebet
genes encoding glycine betaine synthesis inSinorhizobium meliloti102F34. Microbiology 143:1369-1379.
Rose JKC, Bashir S, Giovannoni JJ, Jahn MM and Saravanan RS (2004) Tackling the plant proteome: Practical approaches, hurdles and experimental tools. Plant J 39:715-733. Saravanan RS and Rose JKC (2004) A critical evaluation of
sam-ple extraction techniques for enhanced proteomic analysis of recalcitrant plant tissues. Proteomics 4:2522-2532. Subramanian S, Stacey G and Yu O (2007) Distinct, crucial roles
of flavonoids during legume nodulation. Trends Plant Sci 12:282-285.
Wang W, Vignani R, Scali M and Cresti M (2006) A universal and rapid protocol for protein extraction from recalcitrant plant tissues for proteomic analysis. Electrophoresis 27:2782-2786.
Westermeier R and Naven T (2002) Proteomics in Practice: A Laboratory Manual of Proteome Analysis. Wiley-VCH Verlag-GmbH, Weinheim, 342 pp.