www.ache.org.rs/CICEQ
Chemical Industry & Chemical Engineering Quarterly 18 (1) 103−113 (2012) CI&CEQ
SEYED ALI JOZI1 PARINAZ SALATI2
1Islamic Azad University, North
Tehran Branch, Tehran, Iran 2
Department of Environment and Energy, Science and Research Branch, Islamic Azad University, Tehran, Iran
SCIENTIFIC PAPER
UDC 665.71:502/504 DOI 10.2298/CICEQ110504051J
ENVIRONMENTAL RISK ASSESSMENT OF
LOW DENSITY POLYETHYLENE UNIT
USING THE METHOD OF FAILURE MODE
AND EFFECT ANALYSIS
The ninth olefin plant of Arya Sasol Petrochemical Company (A.S.P.C.) is re-garded as the largest gas Olefin Unit located on Pars Special Economic Energy Zone (P.S.E.E.Z). Considering the importance of the petrochemical unit, its environmental assessment seems necessary in order to identify and reduce potential hazards. For this purpose, after determining the scope of the study area, identification and measurement of the environmental parameters, environmental risk assessment of the unit was carried out using Environment Failure Mode and Effect Analysis (EFMEA). Using the noted method, sources causing environmental risks were identified, rated and prioritized. The impacts of the environmental aspects derived from the unit activities, as well as their consequences, were also analyzed. Furthermore, the identified impacts were prioritized based on Risk Priority Number (RPN) and severity level of the con-sequences imposed on the affected environment. After performing statistical calculations, it was found that the environmental aspects owing the risk priority number higher than 15 have a high level of risk. Results obtained from Low Density Polyethylene Unit revealed that the highest risk belongs to the emer-gency vent system with risk priority number equal to 48. It occurs due to im-perfect performance of the reactor safety system leading to the emissions of ethylene gas, particles, and radioactive steam as well as air and noise pollu-tions. Results derived from secondary assessment of the environmental as-pects, through difference in calculated RPN and activities risk levels showed that employing modern methods and risk assessment have remarkably re-duced the severity of risk and consequently detracted the damages and losses incurred on the environment.
Keywords: risk assessment; risk priority number; low density poly-ethylene; environmental failure modes and effects analysis; emergency vent system.
Nowadays, regarding the increasing difficulties caused by environmental issues, environmental risk assessment has been considered more than ever [1- –3]. The application of managerial tools and quality engineering such as the Environment Failure Mode and Effect Analysis (EFMEA) is widespread through the world [4-6]. Implementation of risk identification,
Correspondening author: P. Salati, Department of Environment and Energy, Science and Research Branch, Islamic Azad Uni-versity, Tehran, Iran.
E-mail: parinazsalati@gmail.com Paper received: 4 May, 2011 Paper revised: 18 October, 2011 Paper accepted: 29 October, 2011
prioritization and assessment plans using EFMEA is among progressive methods used in risk assessment and management of oil, gas and petrochemical indus-tries. The EFMEA method has been applied in va-rious industries like automotive, electronics, aero-space, etc., to identify, assess and prioritize defects and errors that have tremendous potential to create hazards particularly at different stages before offering
the product, i.e., designing stage [7-9]. Environmental
environ-ment. Accordingly, in addition to analysis of various aspects of risk, the sensitivity of the affected envi-ronment and the values of the regional envienvi-ronment are considered using a full understanding of the en-vironment [10-12]. The study ahead aims to identify the important environmental aspects affected by the Low Density Polyethylene Unit (LDPU) based on dif-ferent production processes [13]. Recently, there have been some studies published regarding the applica-tion of FMEA in identificaapplica-tion and assessment of en-vironmental aspects as well as the introduction of EFMEA method. The results indicate that EFMEA is an appropriate qualitative method to assess environ-mental consequences derived from production pro-cesses. It aims at providing a suitable tool to facilitate the tasks of the companies so that their development would be accompanied by environmental considera-tions [14-17]. In 2002, Paul and Van [18] carried out a research study about pipeline risk management. The purpose of the study was to reduce of the adverse impacts of pipelines on the environment, increase the positive impacts of the process on the society, enhan-cement of the equipment, facilities and employees’ safety and reduction of damage caused by leaking pi-pelines. The authors were looking to reach an alter-native to minimize adverse impacts to their lowest possible extent by eliminating unsafe conditions and protecting the environment as much as possible. There have also been many research studies con-ducted regarding risk assessment of petrochemical
industries. Gharabagh et al. [19] conducted a
compre-hensive risk assessment and management for petro-chemical feed and product transportation pipelines. Heavy Gas Dispersion Model was applied in envi-ronment of ALOHA software for the consequence
analysis of chlorine gas at different concentrations. In 2000, Khan and Abbasi [20] presented a new tool called TORAP for conducting rapid risk-assessments in petrochemical industries.
A.S.P.C. is one of the major petrochemical com-plexes in Iran. In 2006, the petrochemical complex was put into operation in an area with extent of 72 ha located on P.S.E.E.Z (situated in Bushehr Province) within the Assaluyeh Port. The complex includes low, medium and high-density polyethylene as well as C2 Cracker Units. The section under study includes the low-density polyethylene unit with a production capa-city of 300,000 ton/year. Assaluyeh is regarded as Iran’s main economic base and the world’s largest energy production region [21,22]. The area, situated near a village in adjacent the Persian Gulf, is located 276 km southeast of Bushehr. It is the nearest ter-restrial spot of the Persian Gulf northern margin to the South Pars Gas Field. It is worth noting that Gonbade Shomali sphere (belonged to Qatar) is located along the study area. Approximate area of the Assaluyeh in-dustrial zone is equal to 14000 ha, in which the con-struction capability is almost equal to 10000 ha re-garding deduction of alluvial lands and environmental buffer zones [23,24]. The nearest protected area to the considered petrochemical complex is Nayband Protected Area situated approximately 30 km away from the complex. The location of Arya Sasol Petro-chemical Company is shown in Figure 1.
MATERIAL AND METHODS
EFMEA is a method that helps examine environ-mental demands and legal requirements systema-tically and focuses on the most important activities to
improve the environment [26]. The method takes into account the most serious environmental aspects and facilitates conscious implementation of environmental activities. Implementation stages of the research are presented in Figure 2.
In this study, parameters related to air pollution
including O3, CO2, CO, NO, NO2, NOx, SO2, H2S and
THC (total hydrocarbon) were measured. Initially, the exact location of the chimneys was investigated, and then chimneys No. 101, 102, 103, 106 and 109 avail-able through the unit were specified for sampling. It is noteworthy that the exact sampling locations were identified using the EPA1 Method. Afterward, the out-put flow rate and diameter of the chimney were deter-mined. In this regard, three points were appointed on the chimney at distances of 50.7, 16 and 83.3 m away from the chimney. Subsequently, the device prop was fixed in each of the mentioned points to record the measured values on the screen accurately. To sure the sound level, the exact location of the mea-suring stations was determined based on the sources,
distances, periods and emissions of the sound, as well as the noise coherence. After conducting the re-quired investigations, places including the northwest corner (next to the exit door), northeast side (in front of the Olefin Unit), southeastern side (in front of the
effluent pond), the south side (in front of the TK-
-51602 Tank) and west side (next to the entrance)
were selected as noise measurement locations. The microphone of the device was directly placed towards the sound source without any angle. It should be noted that the placement height of the device was determined based on the sound barriers. Acoustic and electric calibrations were done using the device construction. Meanwhile, the sound level meter was set on the A-weighting frequency network, and then, the results were recorded. The clean air standard measuring was examined in places such as the HSE Building roof, east side of the site, the southern side of the site, the west side of the site (along with heat exchangers). Initially, particulate matter (PM10) of the site was measured based on the BS-EN-12341
dard method using a DUST TRAK photometer. The amount of the particles was shown by an aerosol photometer by measuring the amount of light re-leased from them. The light intensity rere-leased from the particles is a function of the size, shape and anal-ytical parameters of light. The amount and intensity of light in the Dust Trak Monitor were recorded for va-rious suspended particles and aerosols and it was shown that the obtained data is a function of particle size at the same concentration. Fine particles (less than 1 µm) (fine particles) released more light per volume unit than larger particles. In this method the device was initially calibrated and placed in the appro-priate position, 1.5 m above the ground level. The de-vice flow was regulated and sampling was performed in a specific duration. Considering the capabilities of the device, the maximum, minimum and mean num-bers of air-suspended particles per unit volume were measured. After measuring the suspended particles, the indoor air gases were evaluated. The model of the
device used to measure gases including O3, CO, NO,
NO2 and SO2 was BABUC/A equipped by a
replace-able electrochemical sensor. The parameters were transported from the sensor into the system based on voltage change and displayed in terms of the stan-dard unit. Meanwhile, to measure the hydrocarbon compounds a PhoCheck 5000 device was applied based on PID (photo-ionization detector) with 2% pre-cision. Parameters measured in effluent samples are included COC (continuously oily contaminated), POC (potentially oily contaminated), sea water olefin, sea water offsite, electrical connectivity (EC), pH, COD (chemical oxygen demand), BOD (biological oxygen demand), ammonium, phosphate, alkalinity, sulfide, detergent, oil, total dissolved solid (TDS), total suspended solids (TSS), lead, iron, copper, cadmium and trivalent chromium as well as the total amount of coli forms in the consumed drinking water samples. Finally, the results of the measurements were com-pared with the standards announced by Environmen-tal Protection Agency (EPA). Subsequently, according to EFMEA Method, a checklist was designed to as-sess the environmental degradation coefficient. In the checklist, variables such as process identification, po-tential failure mode (environmental aspects), popo-tential effects of the failure (outcomes), potential causes of the failure, the initial assessment of the environmental aspects (severity, probability of occurrence, pollution extent or recycling possibility, RPN and risk level), control measure and the secondary assessment of the environmental aspects (severity, occurrence pro-bability, pollution extent or recycling possibility, RPN and risk level) were investigated. The checklist had required justifiability whereas it was prepared by
parti-cipation and opinion of expertise in the field of occu-pational health, Health Safety and Environment (HSE), environment, chemical and process engineers at the Low Density Polyethylene Unit. After gathering re-quired information, the environmental degradation co-efficient assessment was performed using EFMEA.
In order to apply the EFMEA method for each aspect identified at “environmental aspect identifyca-tion stage”, the aspects were divided into two groups as follows:
a) Environmental aspects that cause emissions or produce various kinds of pollution, waste, and se-wage in the environment.
b) Environmental aspects that cause reduction in natural resources due to indiscriminate consump-tion; for example, the use of a variety of fossil fuels, cooling water beds, electricity, compressed air and oxygen.
Accordingly, the considered RPN was calculated by multiplying three parameters including severity, oc-currence probability, pollution extent or possibility of recycling.
For the first group of the environmental aspects the following formula was applied to obtain environ-mental degradation coefficient:
Environmental degradation coefficient =
= Severity×Occurrence probability×Pollution extent
For the second group, the following equation was used:
Environmental degradation coefficient =
= Severity×Occurrence probability×Recycling possibility
The scoring manner was such that for the “in-tensity” parameter (as presented in Table 1) the sco-ring range was within 1 to 5. The score 5 belonged to the most intensive state, while the score 1 was as-signed to the lowest intensity case. In the case of “occurrence probability” (Table 2), a scoring number within the range of 1 to 5 was given so that for the highest and lowest occurrence probability, the scores 5 and 1 were allocated, respectively. For “pollution extent or recycling possibility” a 1-5 scoring rage was considered as well (Tables 3 and 4) so that the high-est (5) and lowhigh-est score (1) were respectively as-signed to the highest and lowest pollution extent or recycling possibility [13,27-29].
The category length, CL, was obtained by
sub-tracting the smallest RPN value, S, from the greatest
amount of risk priority number, L, over number of
ca-tegories, K:
L S CL
K −
= (1)
where K is defined as follows:
1 3.3log
K = + n (2)
where n is the total number of the environmental
as-pects.
Eventually, the final ranking was performed based on the hazardability degree and then the environmen-tal risk level was determined for each activity. Se-quentially, the aspects having RPN higher than the considered hazardability degree were counted as cri-tical activities required the mitigation measures.
RESULT AND DISCUSSION
Results obtained from the environmental para-meters of A.S.P.C. (given in Table 5) revealed that the amount of CO and other gases in all measured outputs is acceptable and less than standard limits.
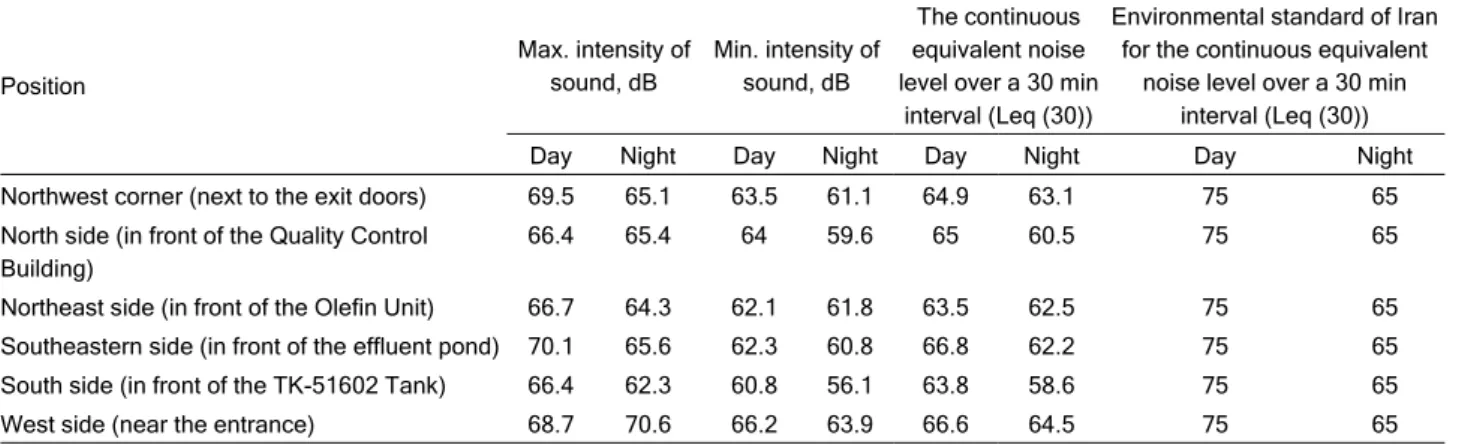
Noise pollution was assessed two times, during the day and night, based on Leq (30). The results are presented in Table 6. The measurement results indi-cate that the intensity level of the environmental noise in all stations is less than the standard limit. It is worth noting that the Leq (30) standard determined by the Department of the Environment of Iran is equal to 75 dB during the day and and 65 dB at night.
The measurement results for the suspended par-ticles (Table 7) show that the amount of suspended particles in all stations was within the standard limit but the roof of HSE Building and the eastern side of Table 1. The severity of environmental degradation [25,31]
Severity Description of severity
Score
Severe/catastrophic Potentially very harmful or destructive / high loss or consume of resources
5
Serious Is not harmful, but potentially destructive/ high loss or consume of resources
4
Medium Relatively hazardous / moderate loss or consume of resources
3
Low Low potential for harm/ low consumption or loss of resources
2
Slight Loss is slight and can be negligible/ Slight consumption or loss of resources
1
Table 2. The occurrence probability of environmental outcomes [25,32]
Probability of occurrence Score
Very high and inevitable occurrence (it is possible to happens every day) 5
Common occurrence (it is possible to happens during the week) 4
Possible and moderate occurrence (it is possible to happens during the month) 3
Trace occurrence (it is possible to happens once a year) 2
Impossible and unlikely occurrence (it is possible to happens once every 10 years) 1
Table 3. Dispersion of pollution [25,33]
Range of pollution Score
At regional level 5
At project level (Arya Sasol Petrochemical) 4
At workshop level (production line) 3
At workshop level (unit) 2
At workstation level 1
Table 4. The possibility of recycling [25]
Possibility of recycling Score
Consumption of non-recyclable resources 5
Waste of non-recyclable resources 4
Waste of resources having hard recyclables and improvement 3
Waste of resources having easy recyclables and improvement 2
the site. However, the mentioned amounts will be de-creased in order to optimize the production process and reduce pollution.
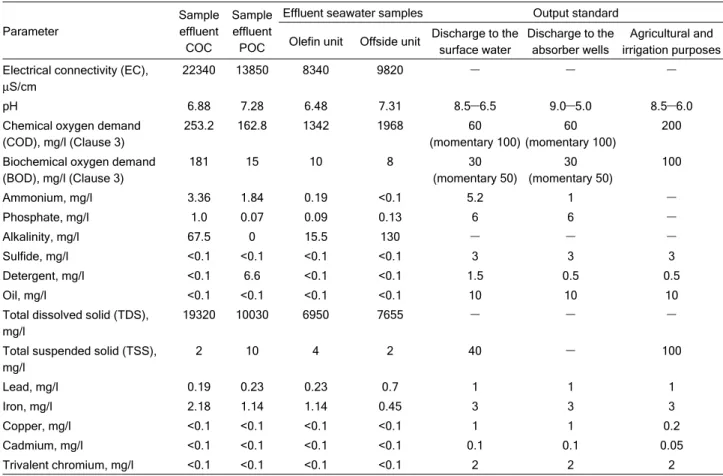
The measurements results of the effluent sample for various parameters show that the amount of COC, COD, BOD and TDS were higher than the standard limits (Table 8). It should be mentioned that the amount of COD and TDS offsite and at the Olefin Unit were beyond the standard limits. The overall rate of the coli forms in drinking water was within the standard limit.
After examination of 23 devices, a total of 116 environmental risk aspects was identified using EFMEA Method in production line of L.DP.U. After calculation of risk prioritization number it was determined that the highest (48) RPN belonged to the Emergency Vent System. Afterward, statistical calculations were per-formed based on equations presented in material and methods. Table 9 shows the results obtained from the statistical calculations. It demonstrates the number
and length of the categories equal to eight and to six. The limits of the categories are presented in Table 10. After determining the limit of the categories, the frequency of each category was gained so that 67
cases were placed within the 3-8 category limit, i.e.,
out of 116 RPNs, 67 cases were located within the category of 3-8. Accordingly, by calculation of two numbers, 3 and 8 (lower and upper limits) of the men-tioned category, the hazardability degree was found to be equal to five. According to statistics obtained from the initial assessment of the environmental as-pects, the risks presented in Table 11 were classified. As stated in the classification stage, the aspects having less than five initial RPN were ignored and displayed as low-level risks with (L) symptom. The first category related to the activities in the range of 5 to 10 were considered as aspects with moderate and acceptable risk level and displayed using (M) symp-tom. For these kinds of activities, there is no neces-Table 5. Emissions from chimneys
Permissible standard limits, 0.3% O2SO2 0.3% O2SO2
ppm Permissible standard
limits, 0.3% O2NOx 0.3% O2NOx
ppm Permissible standard
limits, 0.3% O2CO 0.3% O2CO
ppm Chimney name No 800 1.26 350 90.72 150 0 101 1 800 0 350 116.54 150 0 102 2 800 0 350 83.6 150 0 103 3 800 0 350 113.3 150 0 106 4 800 0 350 120 150 0 109 5
Table 6. Noise pollution
Environmental standard of Iran for the continuous equivalent
noise level over a 30 min interval (Leq (30)) The continuous
equivalent noise level over a 30 min
interval (Leq (30)) Min. intensity of
sound, dB Max. intensity of
sound, dB Position Night Day Night Day Night Day Night Day 65 75 63.1 64.9 61.1 63.5 65.1 69.5 Northwest corner (next to the exit doors)
65 75 60.5 65 59.6 64 65.4 66.4 North side (in front of the Quality Control
Building) 65 75 62.5 63.5 61.8 62.1 64.3 66.7 Northeast side (in front of the Olefin Unit)
65 75 62.2 66.8 60.8 62.3 65.6 70.1 Southeastern side (in front of the effluent pond)
65 75 58.6 63.8 56.1 60.8 62.3 66.4 South side (in front of the TK-51602 Tank)
65 75 64.5 66.6 63.9 66.2 70.6 68.7 West side (near the entrance)
Table 7. Suspended particles (PM10) measurement test based on clean air standard; time: 15 min, suction volume: 25.5 dm3; discharge:
0.102 m3/h; standard amount: 150 µg/m3
Amount of suspended particles (PM10), µg/m3 Position Average Min. Max. 165 130 149 HSE Building roof
218 115
143 Eastern side of the site
131 85
96 Southern side of the site
116 87
sary need to consider control and mitigation measu-res. The second category is related to activities in the range between 10 and 15, which are considered as high-level but tolerable risks aspects. H1 character was applied to show them. It is worth noting that for such activities, it is preferable to consider mitigation and control measures. The last class is related to the activities with RPN greater than 15. They were re-garded as aspects with very high-level risk and H2
symptom was used to display them. It should be noted that the list of H2 risks is inserted in Table 12. For the activities categorized in this level it is neces-sary to consider control and mitigation measures. The main purpose of such a classification was providing an appropriate basis for prioritization of risks needed to be controlled.
Table 11. The category of the risk limit in EFMEA Method
Category Risk type Risk limit
First Medium level risks 5 ≤RPN≥ 10
Second High level risks 10 < RPN≥ 15
Third Very high level risks RPN > 15
After initial assessment of the environmental as-pects in A.S.P.C. it was revealed that some activities have high level of risk. Out of 116 investigated as-pects, 37 cases were placed within the category with low level risk, 8 cases were allocated to the high level risk category and 32 cases were assigned to the very Table 10. Calculation of the category limit
Calculation Limit
3+6 = 9 L1 = 3-8
9+6 = 15 L2 = 9-14
15+6 = 21 L3 = 15-20
21+6 = 27 L4 = 21-26
27+6 = 33 L5 = 27-32
33+6 = 39 L6 = 33-38
39+6 = 45 L7 = 39-44
45+6 = 51 L8 = 45-50
Table 8. The results obtained from wastewater samples analysis
Parameter
Sample effluent COC
Sample effluent POC
Effluent seawater samples Output standard
Olefin unit Offside unit Discharge to the surface water
Discharge to the absorber wells
Agricultural and irrigation purposes
Electrical connectivity (EC), µS/cm
22340 13850 8340 9820
–
–
–
pH 6.88 7.28 6.48 7.31 8.5
–
6.5 9.0–
5.0 8.5–
6.0Chemical oxygen demand (COD), mg/l (Clause 3)
253.2 162.8 1342 1968 60
(momentary 100)
60 (momentary 100)
200
Biochemical oxygen demand (BOD), mg/l (Clause 3)
181 15 10 8 30
(momentary 50)
30 (momentary 50)
100
Ammonium, mg/l 3.36 1.84 0.19 <0.1 5.2 1
–
Phosphate, mg/l 1.0 0.07 0.09 0.13 6 6
–
Alkalinity, mg/l 67.5 0 15.5 130
–
–
–
Sulfide, mg/l <0.1 <0.1 <0.1 <0.1 3 3 3
Detergent, mg/l <0.1 6.6 <0.1 <0.1 1.5 0.5 0.5
Oil, mg/l <0.1 <0.1 <0.1 <0.1 10 10 10
Total dissolved solid (TDS), mg/l
19320 10030 6950 7655
–
–
–
Total suspended solid (TSS), mg/l
2 10 4 2 40
–
100Lead, mg/l 0.19 0.23 0.23 0.7 1 1 1
Iron, mg/l 2.18 1.14 1.14 0.45 3 3 3
Copper, mg/l <0.1 <0.1 <0.1 <0.1 1 1 0.2
Cadmium, mg/l <0.1 <0.1 <0.1 <0.1 0.1 0.1 0.05
Trivalent chromium, mg/l <0.1 <0.1 <0.1 <0.1 2 2 2
Table 9. The statistical results obtained from initial RPN
The category length The largest RPN The smallest RPN Number of the categories Number of data
high level risk category. Subsequently, based on the mentioned categories some strategies included con-trol and mitigation measures were suggested for acti-vities owing high potentiality for causing environmen-tal risks. This time, the secondary assessment of the environmental aspects was performed. The contents of Table 12 show that all parameters investigated in the secondary assessment of the environmental as-pects were placed within the acceptable and tolerable level.
CONCLUSION
According to the conducted ranking, 31.9% of the aspects have low level risks while 33.62% were placed on the medium level risk category. Moreover, 6.9% was allocated within high-level risk classification and 27.6% were belonged to the very high-risk level group. The results of the environmental risk aspects for each device suggested that the lowest risk priority number is equal to 3. The highest risk priority number related to the environmental risk is specified to the Table 12. Environmental aspects risk assessment using EFMEA Method
Equipment Environmental aspect
Failure effect
Initial assessment of the environmental aspect (risk level: H2)
Secondary assessment of the environmental aspect
Intensity Occurrence probability
Pollution extent or recycling possibility
Risk priority number, RPN
IntensityOccurrence probability
Pollution extent or recycling possibility
Risk priority number, RPN
Risk level
Initial compressor
Oil spill Soil pollution
2 4 2 16 2 2 2 8 M
Oil spill Liquid
waste
2 2 2 16 2 2 2 8 M
Ethylene gas emission
Air pollution
5 2 4 16 5 1 4 20 H2
Vibration Noise
pollution
2 5 2 20 2 3 2 12 H1
Secondary compressor
Oil spill Soil pollution
2 4 2 16 2 2 2 8 M
Oil spill Liquid
waste
2 4 2 16 2 2 2 8 M
Ethylene gas emission
Air pollution
5 2 4 40 5 1 4 20 H2
Vibration Noise
pollution
2 5 2 20 2 3 2 12 H1
Pressure breaker valve (BPV)
Hot water consumption
Waste of resources
2 3 3 18 1 2 3 6 M
Ethylene gas emission
Air Pollution
5 2 3 30 5 1 3 15 H1
Vibration Soil
pollution
4 4 2 32 4 2 2 16 H2
Primer leak Liquid
waste
4 4 2 32 4 2 2 16 H2
Extruder Melt polymer release
Solid waste
5 2 2 20 2 3 2 12 H1
Ethylene gas emission
Air pollution
5 2 3 30 5 1 3 15 H1
Coolers to set the temperature of air returned to the seconda-ry compressor
Vibration Air pollution
5 2 3 30 5 1 3 15 H1
A/B compressor
Vibration Noise pollution
process of the Emergency Vent System, which was allocated a PRN tantamount to 48. Due to the safety performance of the reactor, ethylene, particles, va-pors and radioactive materials are released which lead to air and noise pollution as well as the radio-active emissions. The main factor preventing the unit authorities to apply control methods for eliminating or reducing the potentiality of the risks is the application cost of such methods. However, it should always be considered that the incidence of environmental risk will be followed by more expenditure. From this view-point, the required control and mitigation measures should be proposed proportional to the activity type and the ongoing process with high potentiality of the environmental risk. Reformatory measures suggested at the place of ethylene gas emission include replace-ment or repair of device failure, use of pollutant gas control systems in the output of the chimney and ven-tilation outlet. Also, reformatory measures such as promotion and employees’ obligation to use personal protective equipment, sound control at receiving place like the use of hearing protection devices, Silent Ear Muff and Ear Protector (models: A615 and A812) as well as installation of silencers at noise pollution sour-ces is highly recommended to maintain the person-nel’s health. Cleaning the unit floor using a vacuum cleaner, application of cyclone or dry electrostatic fil-ters to dust removal, reducing the concentration of dust and pollutants by embedding a filter, scrubber or cyc-lone in order to air conditioning of Production Saloon and Raw Materials Storage, usage of wet scrubber system, the application of ceiling fans for air condi-tioning of workshops and reducing dust concentration, the use of filtered masks during making contact with particles, the use of dirt deflector systems in place of particulate emissions and also enclosing the resour-ces using safety guards to prevent the release of ra-diation in the environment are considered among the necessary mitigation measures to reduce the poten-tial environmental risks through the unit.
The study shows the effectiveness of the EFMEA method in identification of the affected environment, risk quantity estimation as well as identification of the appropriate risk mitigation measures. Since EFMEA is a qualitative method, it is effective in product develop-ment processes, identification of the structures and important aspects having priority regarding environ-mental outcomes throughout the life cycle of the pro-duct or process. Considering that humans are the main basis of the sustainable development, finding solutions in order to remove and reduce contaminants seems essential. In addition, applying ways with the aim of preventing waste and excessive consumption of resources is considered among the issues that
special attention should be paid to in line with envi-ronmental risks management. Following industry-spe-cific standards and environmental policies and prac-tices as well as applying proper management tech-niques will increase the confidence coefficient of miti-gation of the industrial activities and processes ad-verse effects. By examination of environmental risk assessment results of L.D.P.U. it was determined that the unit enjoys relatively high safety and environ-mental control systems. However, in cases where the devices have very high risk, implementation of control measures seem necessary.
Abbreviation list
A.S.P.C. Arya Sasol Petrochemical Company
BOD Biological Oxygen Demand
COC Continuously Oily Contaminated
COD Chemical Oxygen Demand
EFMEA Environment Failure Mode and Effect
Analysis
LDPU Low Density Polyethylene Unit
POC Potentially Oily Contaminated
P.S.E.E. Pars Special Economic Energy Zone
PID Photo-Ionization Detector
RPN Risk Priority Number
TDS Total Dissolve Solid
THC Total Hydrocarbon
TORAP Tool for Rapid risk Assessment.
Symbol list
CL The category length
H1 High-level risks aspects but tolerable
H2 Aspects with very high-level risk
L Low-level risks, the largest RPN
L1, L2,…, L8 First, second,…, eight class limits
M Aspects with moderate and acceptable
risk level
N The number of the RPN
S The smallest RPN.
REFERENCES
[1] K. Zhang, Y. Pei, Ch. Lin, Procedia Environ. Sci. 2 (2010) 643-649
[2] L. Xu, G. Liu, J. Environ. Manag. 90 (2009) 3290-3296
[3] R.M. Darbra, E., Eljarrat, D. Barceló, TrAC, Trends Anal. Chem. 27 (2008) 377-385
[4] J.C. Arnold, Comprehensive Structural Integrity, Elsevier, Chapter 4.03, (2007), pp. 77-94
[5] Z. Zhang, X. Chu, Expert Syst. Appl. 38 (2011) 206-214
[6] S. Paparella, J. Emerg. Nurs. 33(2007) 367-371
[7] H.H. Allen, Ch.-W. Hsu, T.-Ch. Kuo, W.-Ch. Wu, Expert Syst. Appl. 36 (2009) 7142-7147
[9] S. Monti, J. Jefferson, L. Mermel, S. Parenteau, S. Ken-yon, B. Cifelli, Am. J. Infect. Control. 33 (2005) e158
[10] W.K. Muhlbauer, Pipeline Risk Management Manual, Gulf Professional Publishing, second Ed., USA, 1999, pp. 428
[11] J. Wang, Sh. Chen, T. Xia, Procedia Environ. Sci. 2 (2010) 1632-1642
[12] K. Zhang, Y. Pei, Ch. Lin, Procedia Environ. Sci. 2 (2010) 643-649
[13] P.R. Danielsson, C.A. Gunnarsson, Design For Environ-ment What, Why and how at Volvo? RAVEL conference, Stockholm, 2001, pp. 11-14
[14] C. Jensen, M. Johansson, M. Lindahl, T. Magnusson, En-vironmental Effect Analysis (EEA) – Principles and struc-ture. Department of Technology, University of Kalmar, Kalmar, Sweden, 2001
[15] J. Paques, F. Gauthier, A. Perez, Int. J. Occup. Saf. Er-gon. 13 (2007) 173-187
[16] F. Quella, W. P. Schmidt, Int. J. LCA 8 (2003) 113-114
[17] J. Tixier, G. Dusserre, O. Salvi, D. Gaston, J. Loss. Pre-vent. Proc. 15 (2002) 291-303
[18] P.T. van Valkenburg, Pipeline Risk Management Recent Trends, Strategies and Accounting Implications, MBA Ac-counting and Tax Conference, Mortgage Industry Advi-sory Corporation (MIAC), New York, 2002
[19] M. Jabbari Gharabagh, H. Asilian, S.B. Mortasavi, A. Zar-ringhalam Mogaddam, E. Hajizadeh, A. Khavanin, J. Loss Prev. Process. Ind. 22 (2009) 533-539
[20] F.I. Khan, S.A. Abbasi, Appl. Energ. 65 (2000) 187-210
[21] A. Edalat, Desalination 220 (2008) 57–64
[22] F. Torkianfar, H.R. Jafari, A. Sadeghpour, J. Environ. Stud. 35 (2010) 13-15.
[23] M. Ali Zahed, F. Ruhani, S. Mohajeri, Electron. J. Envi-ron. Agr. Food Chem. 9 (2010) 411-417
[24] R. Azin, SPE International Conference on Health, Safety and Environment in Oil and Gas Exploration and Pro-duction, Rio de Janeiro, Brazil, 2010
[25] Th. A. Carbone, D.D. Tippett, Eng. Manage. J. 16 (2004) 28-35
[26] M. Lindahl, J. Tingstrom, C. Jensen, A small textbook about Environmental Effect Analysis, Department of Tech-nology, University of Kalmar, 2000 (in Swedish)
[27] P.C. Teoh, K. Case, J. Mater. Process Tech. 153-154 (2004) 253-260
[28] N. Xiao, H.-Zh. Huang, Y. Li, L. He, T. Jin, Eng Fail Anal. 18 (2011) 1162-1170
[29] M.T. Oldenhof, J.F. van Leeuwen, M.J. Nauta, D. de Kaste, Y.M.C.F. Odekerken-Rombouts, M.J. Vreden-bregt, M. Weda, D.M. Barends, J. Pharm. Biomed. Anal. 54 (2011) 592-595
[30] Zh. Chen, K.M. Feng, G.S. Zhang, T. Yuan, C.H. Pan, Fusion Eng. Des. 83 (2008) 743-746
[31] M. Tweeddale, Failure Mode and Effect Analysis [FMEA] and Failure Mode and Effect Criticality Analysis [FMECA], Gulf Professional Publishing, USA, 2003, pp. 509
SEYED ALI JOZI1
PARINAZ SALATI2
1
Islamic Azad University, North Tehran Branch, Tehran, Iran 2
Islamic Azad University, Department of Environment and Energy, Science and Research Branch, Tehran, Iran
NAUČNI RAD
PROCENA EKOLOŠKOG RIZIKA POSTROJENJA ZA
POLIETILEN MALE GUSTINE METODOM ANALIZE
NA
Č
INA I EFEKATA OTKAZA
Deveti plan petrohemijske kompanije Arya Sasol (A.S.P.C.) se tiče postrojenja gasovite olefin u specijalnoj ekonomskoj, energetskoj zoni Pars. Razmatrajući značaj ovog petro-hemijskog postrojenja, čini se neophodnim da se izvrši njegova procena zaštite životne sredine da bi se identifikovale i smanjile potencijalne opasnosti. U ovu svrhu, posle
odre-đivanja cilja istraživanja, izvršene su identifikacija i merenje ekoloških parametara i pro-cena zaštite životne sredine korišćenjem metode analize načina i efekata otkaza (EFMEA). Koristeći ovu metodu, identifikovani su i ocenjeni izvori ekoliških rizika, a zatim određeni njhovi prioriteti. Pored toga, analizirani su uticaji ekoloških aspekata koji sau rezultat rada postrojenja kao i njihovih posledica. Štaviše, napravljen je prioritet među identifikovanim uticajima na osnovu broja prioritenog rizika i nivoa ozbiljnosti posledica nametnutih oko-lini. Posle sprovedenih statističkih proračuna, utvrđeno je da ekološki aspekti sa brojem prioritetnog rizika većim od 15 imaju najveći nivo rizika. Dobijeni rezultati za postrojenje za dobijanje polietilena niske gustine su otkrili da najveći rizik pripada sistemu sigur-nosnih ventila sa brojem prioritetnog rizika 48. Ovo je rezultat nesavršenog rada bez-bedonosnog sistema reaktora koji vodi emisiji etilena, čestica I radioaktivne pare kao i zagađenju vazduhom i bukom. Rezultati dobijeni sekundarnom procenom ekoliških as-pekata, kroz razliku izračunatih brojeva prioritetnog rizika i nivoa rizika aktivnosti su po-kazali da je primena modernih metoda i procene rizika značajno smanjila ozbiljnost rizika i samim tim smanjile odštete i gubici kojima je izložena okolina.


![Table 2. The occurrence probability of environmental outcomes [25,32]](https://thumb-eu.123doks.com/thumbv2/123dok_br/17225987.244209/5.892.85.812.153.274/table-occurrence-probability-environmental-outcomes.webp)