www.atmos-meas-tech.net/9/1415/2016/ doi:10.5194/amt-9-1415-2016
© Author(s) 2016. CC Attribution 3.0 License.
Validation of TANSO-FTS/GOSAT XCO
2
and XCH
4
glint mode
retrievals using TCCON data from near-ocean sites
Minqiang Zhou1,2,3, Bart Dils2, Pucai Wang1, Rob Detmers4, Yukio Yoshida5, Christopher W. O’Dell6, Dietrich G. Feist7, Voltaire Almario Velazco8, Matthias Schneider9, and Martine De Mazière2
1Key Laboratory of Middle Atmosphere and Global Environment Observation, Institute of Atmospheric Physics,
Chinese Academy of Sciences, Beijing, China
2Belgian Institute for Space Aeronomy, Brussels, Belgium 3University of Chinese Academy of Sciences, Beijing, China
4SRON Netherlands Institute for Space Research, Utrecht, the Netherlands 5National Institute for Environmental Studies, Tsukuba, Japan
6Colorado State University, Fort Collins, CO, USA 7Max Planck Institute for Biogeochemistry, Jena, Germany
8Centre for Atmospheric Chemistry, University of Wollongong, Wollongong, Australia
9Institute of Meteorology and Climate Research (IMK-ASF), Karlsruhe Institute of Technology, Karlsruhe, Germany
Correspondence to:Minqiang Zhou ([email protected])
Received: 25 September 2015 – Published in Atmos. Meas. Tech. Discuss.: 26 October 2015 Revised: 26 February 2016 – Accepted: 18 March 2016 – Published: 1 April 2016
Abstract. The thermal And near infrared sensor for car-bon observations Fourier transform spectrometer (TANSO-FTS) on board the Greenhouse Gases Observing Satel-lite (GOSAT) applies the normal nadir mode above the land (“land data”) and sun glint mode over the ocean (“ocean data”) to provide global distributions of column-averaged dry-air mole fractions of CO2and CH4, or XCO2
and XCH4. Several algorithms have been developed to
ob-tain highly accurate greenhouse gas concentrations from TANSO-FTS/GOSAT spectra. So far, all the retrieval al-gorithms have been validated with the measurements from ground-based Fourier transform spectrometers from the To-tal Carbon Column Observing Network (TCCON), but lim-ited to the land data. In this paper, the ocean data of the SRPR, SRFP (the proxy and full-physics versions 2.3.5 of SRON/KIT’s RemoTeC algorithm), NIES (National Insti-tute for Environmental Studies operational algorithm ver-sion 02.21) and ACOS (NASA’s Atmospheric CO2
Observa-tions from Space version 3.5) are compared with FTIR mea-surements from five TCCON sites and nearby GOSAT land data.
For XCO2, both land and ocean data of NIES, SRFP and
ACOS show good agreement with TCCON measurements.
Averaged over all TCCON sites, the relative biases of ocean data and land data are−0.33 and −0.13 % for NIES, 0.03 and 0.04 % for SRFP, 0.06 and−0.03 % for ACOS, respec-tively. The relative scatter ranges between 0.31 and 0.49 %. For XCH4, the relative bias of ocean data is even less than
that of the land data for the NIES (0.02 vs.−0.35 %), SRFP (0.04 vs. 0.20 %) and SRPR (−0.02 vs. 0.06 %) algorithms. Compared to the results for XCO2, the XCH4retrievals show
larger relative scatter (0.65–0.81 %).
1 Introduction
Carbon dioxide (CO2)and methane (CH4)are the two most
abundant anthropogenic greenhouse gases and play impor-tant roles in global warming and climate change (IPCC, 2013). Despite their significance, there are still large gaps in our understanding of both gases concerning the spatial dis-tribution and time dependence of their natural and anthro-pogenic surface sources and sinks. To get a clear compre-hension of the sources and sinks of CO2and CH4 requires
based on in situ stations. Although these measurements pro-vide precise results, they are limited by their spatial cover-age and uneven distributions (Bousquet et al., 2006; Marquis and Tans, 2008). Besides, most of these stations are located in the boundary layer, and therefore sink estimates derived from these data are directly influenced by their sensitivity to the inversion model local vertical transport (Houweling et al., 1999; Stephens et al., 2007). The column-averaged dry-air mole fraction measurements (XCO2 and XCH4)are
sensi-tive not only to the surface but also to the free troposphere, which allows a better distinction between transport and lo-cal emissions (Yang et al., 2007). Additionally, total column measurements are less sensitive to vertical transport and mix-ing, and are also representative of a larger spatial area. A large set of studies used the total column or column-averaged dry molar fraction observations to improve the quality of the surface fluxes obtained by atmospheric inverse models where quality refers to reduced uncertainty considering random and systematic errors (e.g. Yang et al., 2007; Keppel-Aleks et al., 2011). Recently, the satellite missions provide us with a unique view of global XCO2and XCH4distributions.
The thermal and near infrared sensor for carbon obser-vations Fourier transform spectrometer (TANSO-FTS) on board GOSAT was successfully launched in 2009. It is the first space-based sensor in orbit specifically with the purpose of measuring greenhouse gases from high-resolution spectra at SWIR wavelengths. The field of view of GOSAT/TANSO is about 0.0158 radian, yielding footprints that are ∼10.5 km in diameter at nadir (Kuze et al., 2009). So far, sev-eral algorithms have been developed to retrieve XCO2and
XCH4, such as University of Leicester full physics retrieval
algorithm OCFP and proxy version OCPR (Boesch et al., 2011), the Bremen Optimal Estimation DOAS (BESD) algorithm (Heymann et al., 2015), the Netherlands Insti-tute for Space Research/Karlsruhe InstiInsti-tute of Technol-ogy (SRON/KIT) full physics retrieval algorithm SRFP and proxy version SRPR (Butz et al., 2009, 2011), the NASA Atmospheric CO2Observations from Space or ACOS
algo-rithm (O’Dell et al., 2012), and the National Institute for En-vironmental Studies (NIES) algorithm (Yoshida et al., 2011, 2013) and the photon path length probability density func-tion (PPDF) algorithm (Oshchepkov et al., 2008). Baker et al. (2010) and Alexe et al. (2015) pointed out that the satel-lite measurements of XCO2and XCH4help fill critical gaps
in the in situ network, reducing the uncertainty of the surface flux estimation. As the amplitude of the annual and seasonal variations of CO2 and CH4 column abundances are small
compared to their mean abundances in the atmosphere, the satellite products should reach a demanding precision of 2 % or better (< 8 ppm for XCO2and < 34 ppb for XCH4), in
or-der to improve the precision of inversion models. Besides, achieving high relative accuracy (< 0.5 ppm for XCO2 and
< 10 ppb for XCH4) is even more important and
demand-ing than precision to obtain reliable surface fluxes via inverse modelling (Buchwitz et al., 2012).
It is hard to obtain reliable retrieval results over ocean in the normal nadir mode due to the low albedo in the near- and short-wave infrared spectra. Therefore, GOSAT applies the sun glint mode over the ocean at latitudes within 20◦of the sub-solar latitude, in which the surface of the ocean serves as a mirror to reflect the solar radiance to the sensor directly, increasing the signal-to-noise ratio. Nowadays, the ground-based FTIR Total Carbon Column Observing Network (TC-CON) has become a useful tool to validate column-averaged dry-air mole fractions of CO2and CH4(Wunch et al., 2010,
2011a). Although all the GOSAT greenhouse gases retrieval algorithms have already been validated, to some degree, via the TCCON observations (e.g. Wunch et al., 2011b; Tanaka et al., 2012; Yoshida et al., 2013; Dils et al., 2014), only the land data have been selected in these previous studies. In-oue et al. (2013, 2014) made ocean data of NIES SWIR L2 products validation by aircraft measurements. To ensure that the ocean data of GOSAT can be used to achieve a more global coverage, we compare the ocean data from different algorithms with FTIR measurements from five TCCON sites close to the ocean and near-by GOSAT land data. In Sect. 2, we introduce the GOSAT retrievals and TCCON measure-ments. The validation method is described in Sect. 3. The results and summary are presented in Sects. 4 and 5, respec-tively.
2 Data
2.1 GOSAT
For this paper, we have selected XCO2and XCH4products
from the NIES v02.21, SRON/KIT v2.3.5 and ACOS v3.5 algorithms (see Table 1) with a good quality flag, which is provided by each algorithm according to the spectral resid-ual, retrieval errors and other parameters. To avoid the uncer-tainty resulting from different time coverages of each prod-uct, the selected data are limited to the April 2009 to Decem-ber 2013 period.
There are two SRON/KIT algorithms, SRFP v2.3.5 and SRPR v2.3.5, which are both based on the RemoTeC al-gorithm. Both algorithms use the products from TANSO-CAI/GOSAT as cloud screening. SRFP is a full physics version, which adjusts parameters of surface, atmosphere and satellite instrument to fit the GOSAT spectra. SRFP also allows for the retrieval of a few effective aerosol pa-rameters simultaneously with the CO2 and CH4 total
col-umn, such as particle amount, height distribution and mi-crophysical properties (Butz et al., 2009, 2011). While the proxy version (SRPR) of XCH4 accounts for the
scat-tering by taking the ratio of the XCH4/XCO2, so that
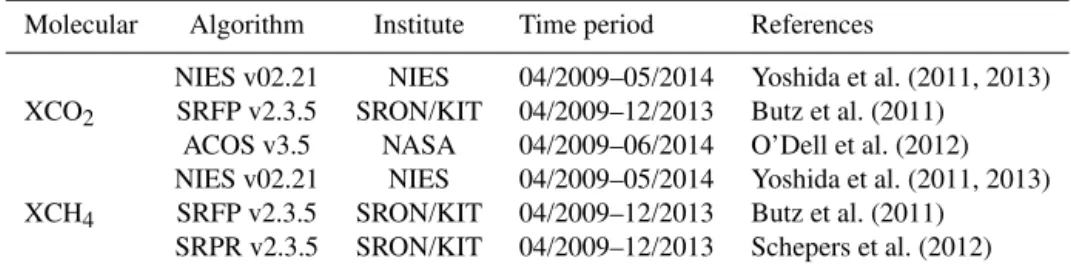
Table 1.TANSO-FTS/GOSAT retrieval algorithms.
Molecular Algorithm Institute Time period References
NIES v02.21 NIES 04/2009–05/2014 Yoshida et al. (2011, 2013)
XCO2 SRFP v2.3.5 SRON/KIT 04/2009–12/2013 Butz et al. (2011)
ACOS v3.5 NASA 04/2009–06/2014 O’Dell et al. (2012)
NIES v02.21 NIES 04/2009–05/2014 Yoshida et al. (2011, 2013)
XCH4 SRFP v2.3.5 SRON/KIT 04/2009–12/2013 Butz et al. (2011)
SRPR v2.3.5 SRON/KIT 04/2009–12/2013 Schepers et al. (2012)
SRFP and SRPR have applied post-processing and bias correction according to the modified version of GGG2012 (corrected for the laser sampling errors, also known as ghost issues). All data have been downloaded from the GHG-CCI project Climate Research Date Package (CRDP, 2015) database (http://www.esa-ghg-cci.org/sites/default/ files/documents/public/documents/GHG-CCI_DATA.html).
NIES v02.21 also applies the cloud mask from TANSO-CAI/GOSAT products with additional cloud detection scheme only for the ocean data and retrieves aerosol pa-rameters and surface pressure simultaneously with CO2and
CH4to represent the equivalent optical path length on these
cloud-screened data (Yoshida et al., 2013). The major dif-ference between SRFP and NIES retrieval algorithms is the handling of the optical path length modification that results from the scattering. In the NIES algorithm, the state vector contains the logarithms of the mass mixing ratios of fine-mode aerosols and coarse fine-mode aerosols, for which the a pri-ori values are calculated by SPRINTARS V3.84 (Takemura et al., 2009). The forward model is based on the fast radiative transfer model proposed by Duan et al. (2005) and the opti-mal solution of the Maximum A Posteriori (MAP) method is applied as the inversion method. NIES v02.21 only contains the raw retrieval values; all data have been downloaded from https://data.gosat.nies.go.jp/ (GUIG, 2015).
Similar to the SRFP and NIES algorithms, ACOS v3.5 is a full-physics algorithm, but with a different cloud fil-tering, state vector, forward model and inversion strategy (Crisp et al., 2012; O’Dell et al., 2012). ACOS uses the in-formation from the O2-A band to select the clear-sky
foot-prints (Taylor et al., 2012). The forward model is based on a fast single-scattering model (Nakajima and Tanaka, 1988), the LIDORT scalar multiple scattering model (Spurr et al., 2001), and a second-order-of scattering polarization model called 2OS (Natraj and Spurr, 2007). It fits the vertical op-tical depth of four scattering types together with CO2. The
modified Levenberg Marquardt method is used to minimize the cost function. As ACOS has been developed originally to retrieve the OCO satellite data products, only XCO2is
in-cluded in the products. Wunch et al. (2011b) pointed out that the ACOS-GOSAT v2.9 XCO2data have a small global bias
(< 0.5 ppm), and Nguyen et al. (2014) found that the ACOS v3.3 XCO2abundances tend to be larger than TCCON
mea-surements by about 1–1.5 ppm. Here, the data from the lat-est version, ACOS v3.5, are used to compare with the “near-ocean” TCCON measurements. ACOS v3.5 products have been bias corrected using TCCON GGG2014 products.
2.2 TCCON
TCCON is a network of ground-based FTIRs targeting the provision of highly accurate and precise column-averaged dry-air mole fractions of atmospheric components including CO2, CH4, N2O, HF, CO, H2O and HDO, for the
valida-tion of the corresponding satellite products, such as SCIA-MACHY, GOSAT and OCO-2. All the TCCON stations use the GGG software to derive the gas column concentrations, as has been described in detail by Wunch et al. (2011a). XCO2 and XCH4 are calculated from the ratio of the
re-trieved columns to the simultaneously rere-trieved O2column,
so as to minimize systematic errors (Yang, 2002). GGG in-cludes its own Fourier transformation algorithm to derive the spectra from the recorded interferograms: it also cor-rects for the solar intensity variations during the recording of the interferogram due to the occurrence of clouds or heavy aerosol loads (Keppel-Aleks et al., 2007). Most TCCON sta-tions have been calibrated to WMO standards by comparison to aircraft in situ overpass measurements, and global cali-bration factors for each gas (0.9898±0.001(1σ ) for XCO2
and 0.9765±0.002(1σ ) for XCH4)are applied to the
TC-CON data (Wunch et al., 2010; Messerschmidt et al., 2011; Tanaka et al., 2012; Geibel et al., 2012). To ensure network-wide consistency, Messerschmidt et al. (2010) and Dohe et al. (2013) discovered and minimized laser sampling errors. The latest version of GGG (GGG2014) has a ghost correction embedded in an interferogram to spectrum conversion pro-cess (I2S) that differs in methodology to Dohe et al. (2013), but results in similar minimization of laser sampling errors (Wunch, et al., 2015). Thanks to all these and ongoing efforts (Hase et al., 2013; Kiel et al., 2016), TCCON has been ex-tensively used to validate satellite XCO2and XCH4retrievals
(e.g. Wunch et al., 2011b; Guerlet et al., 2013; Yoshida et al., 2013; Dils et al., 2014; Kulawik et al., 2016).
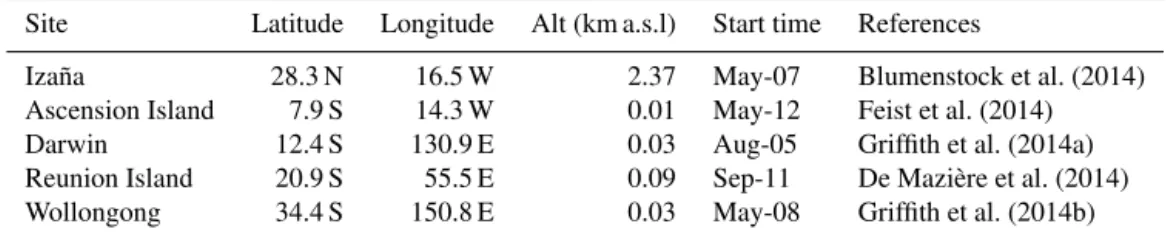
Table 2.The locations and start times of TCCON sites.
Site Latitude Longitude Alt (km a.s.l) Start time References
Izaña 28.3 N 16.5 W 2.37 May-07 Blumenstock et al. (2014)
Ascension Island 7.9 S 14.3 W 0.01 May-12 Feist et al. (2014)
Darwin 12.4 S 130.9 E 0.03 Aug-05 Griffith et al. (2014a)
Reunion Island 20.9 S 55.5 E 0.09 Sep-11 De Mazière et al. (2014)
Wollongong 34.4 S 150.8 E 0.03 May-08 Griffith et al. (2014b)
Izaña, Ascension Island, Darwin, Reunion Island and Wol-longong). The corresponding TCCON products used in this study are GGG2014 version. All data were downloaded from the TCCON Data Archive, hosted by the Carbon Dioxide In-formation Analysis Center (CDIAC) at ftp://tccon.ornl.gov/.
3 Methodology
3.1 Spatiotemporal collocation criterion
The ideal TCCON-satellite data pair should consist of mea-surements at the same place during the same time. How-ever, in order to find a sufficient number of co-located measurements to enable a robust statistical analysis, sev-eral spatiotemporal criteria were used in previous valida-tions. Wunch et al. (2011b) used the mid-tropospheric po-tential temperature field at 700 hPa (T700) to define the co-incidence criteria, as Keppel-Aleks et al. (2011) pointed out that the potential temperature coordinate is a good proxy for large-scale CO2 gradients in the Northern Hemisphere and
mid-latitudes. Guerlet et al. (2013) utilized model CO2fields
to determine coincidences and Nguyen et al. (2014) used a modified Euclidian distance weighted average of distance, time and mid-tropospheric temperature at 700 hPa. Unfortu-nately, in the present paper, five TCCON sites are located in the low-latitudes, where the correlation between XCO2
gra-dients and potential temperature is less effective. Addition-ally, contrary to the relatively large amount of measurements over land, the ocean data are quite scarce. Even with a 500 or 1000 km radius collocation area around the FTIR stations, the number of TCCON-satellite data pairs turns out to be in-sufficient to obtain stable results.
The co-location area is finally set as ±5◦ latitude ±15◦ longitude around each TCCON site. Within this co-location box, we do not detect any significant latitude or longitude dependent bias for XCO2and XCH4. Figure 1 depicts the
lo-cations of TCCON sites and co-located XCH4retrieval
foot-prints from the SRPR algorithm from April 2009 to Decem-ber 2013. The blue points represent the GOSAT sun glint data over ocean, and the green ones correspond to the nor-mal nadir data above land. The collocation time is set to ±2 h. That means that all the FTIR measurements occur-ring within ±2 h of a single satellite observation, meeting the spatial requirement, are averaged to acquire one TCCON-satellite data pair. Dils et al. (2014) demonstrated that the
typ-Figure 1.TCCON stations and SRPR XCH4co-located footprints from April 2009 to December 2013. The colocation box is chosen
as±5◦ latitude±15◦longitude around the TCCON station. The
blue footprints are sun glint data over ocean, and the green ones are data above land.
ical variability (1σ ), of the FTIR measurements within a 4 h time window, including random errors and real atmospheric variability, is on average 2.5 ppb for XCH4and 0.4 ppm for
XCO2; this meets the precision requirement of the
ground-based measurements (better than 0.25 % for XCO2and 0.2–
0.3 % for XCH4)(Wunch et al., 2011a, 2015). Therefore, in
this study, the statistical analyses are based on the individual data pairs or daily averaged data pairs, and all data pairs are assumed to be of equal weight.
3.2 A priori and averaging kernel corrections
Rodgers and Connor (2003) pointed out that it is not reason-able to directly compare the measurements made by different remote sounders due to their different a priori profiles and av-eraging kernels.
To deal with the a priori issue, TCCON a priori profile is applied as the common a priori profile to correct the satellite retrievals:
ccor=c+
X
i
hi(1−Asati )(xap, iTCCON−xap, isat ) (1)
hi=
mi
P mi
, (2)
in which,ccor andcare the a priori-corrected and original
normal-XCO (corr–orig) (ppm) XCO (corr–orig) (ppm)
Land Ocean Land Ocean
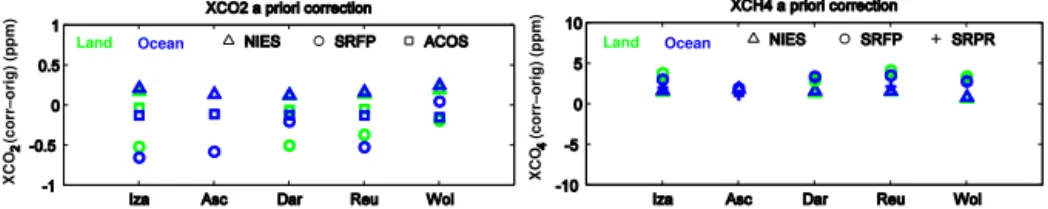
Figure 2.The average of the differences between a priori-corrected and original satellite XCO2and XCH4retrievals (corrected – original) at five TCCON stations. Iza, Asc, Dar, Reu and Wol stand for Izaña, Ascension Island, Darwin, Reunion Island and Wollongong. The blue footprints are sun glint data over ocean and the green ones are data above land.
ized airmass-weight function of layer i; mi corresponds to
the mass of dry air in layeri.
The prior CO2profiles of ACOS are derived from the
out-put of the Laboratoire de Meteorologie Dynamique (LMDz) model, with fluxes optimized to match surface observations. The prior CO2 and CH4 profiles of NIES are calculated
for every observed day by an offline global atmospheric transport model developed by the NIES (Maksyutov et al., 2008). The a priori CO2 profiles of SRON/KIT algorithms
come from the forward run of the Carbon Tracker Initiative with extrapolation based on in situ measurements, while the XCH4 a priori is derived from the TM4 model (Meirink et
al., 2006).
Figure 2 shows the impact of a priori correction for dif-ferent retrieval algorithms both on ocean and land data. For each algorithm, the a priori correction factor of ocean data is similar to that of land data. For XCO2, the correction factor
(a priori-corrected – original) ranges from−0.6 to 0.3 ppm. SRFP has stronger and more erratic correction factors com-pared to NIES and ACOS. For XCH4, the correction factor
ranges from 1.0 to 5.0 ppb with quasi-constant value at these TCCON stations.
It should be noted that we apply the spline interpolation “interpolation method” to re-grid the TCCON gas concen-trations to the satellite retrieval levels or layers. It will result in errors for Izaña station, because the a priori of TCCON starts from 2.37 km, which could not cover the whole verti-cal range of the a priori of the satellite products. Therefore, we do the test using the same a priori of satellite retrievals below 2.37 km to do the a priori correction “fixed method”. As the difference between the interpolation method and fixed method is within 0.5 ppb for XCH4and 0.05 ppm for XCO2,
this error can be ignored.
We have not dealt with the impact of the difference be-tween the averaging kernels of TCCON and GOSAT data, because the true atmospheric variability is unavailable. For-tunately, the TCCON stations are located at low-latitudes, so that the solar zenith angle (during the ±2 h when GOSAT pass the TCCON sites) remains small, and GOSAT and TC-CON averaging kernels look very similar.
3.3 Altitude correction
Different from other stations, the Izaña FTIR is located on a steep mountain, with an altitude of 2.37 km a.s.l. If we di-rectly compare the GOSAT data with Izaña FTIR measure-ments, a large bias could be generated. Therefore, in this section, we present an altitude-correction method to modify the GOSAT retrievals around the Izaña site. To that end, we calculate the ratio (α)between the column-averaged dry-air mole fractions of the target gasG above two different al-titudes or pressure levels P1 and P2, based on the a priori profile shape, as
α=cP1G,ak/cP2G,ak. (3) In Eq. (3), the column-averaged dry-air mole fraction of the target gas above pressure level P1 or P2,cG,ak(P1 or P2), is
computed as
cG,ak(P1 or P2)=
V CG(P1 or P2)
V Cair(P1 or P2)
(4)
=
RPtop
P1 or P2
fGdryakdp
gmdryair[1+fH2Odry(mH2O/mdryair)]
RPtop
P1 or P2
dp
gmdryair[1+fH2Odry(mH2O/mdryair)] ,
with
fH2Odry =fH2O/(1−fH2O). (5)
In Eqs. (4) and (5)fH2Oandf dry
H2Oare the mole and dry-air
mole fractions of H2O, respectively,f dry
G is the a priori
dry-air mole fraction of the target gasG;mdryairandmH2Oare the
molar weights of dry air and H2O, respectively. P1 or P2 and
Ptoprepresent the bottom and top pressure of the column, and
gis the gravitational acceleration, which varies with altitude and latitude. Here, “ak” stands for the averaging kernel value at pressure levelpof the satellite product: it appears in order to account for the retrieval sensitivity at each pressure level in the correction factorαthat we apply to the satellite data (we always apply the correction factor to the satellite product, not to the TCCON product).
To compute fHdry
2O, we use the 6-hour European Centre
Time (month/year) Time (month/year) Time (month/year)
Time (month/year) Time (month/year) Time (month/year)
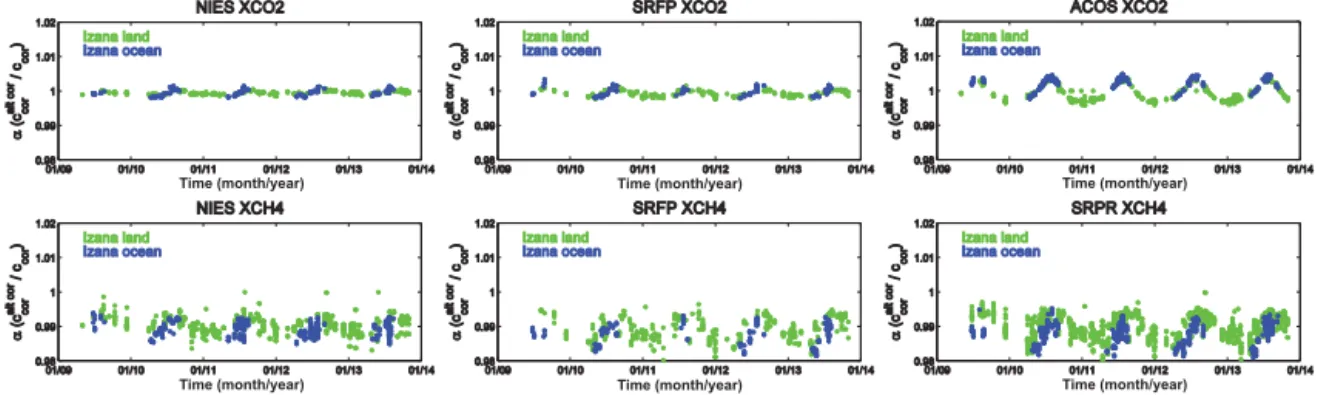
Figure 3.The time series plots of XCO2and XCH4altitude-correction factors for different GOSAT algorithms at the Izaña site. Blue data points are sun glint data over ocean and the green ones are data above land.
reanalysis specific humidity (SH), interpolated linearly in space and time to the GOSAT field of view, which is given as the ratio of the mass of water vapour to the mass of moist air (Dee et al., 2011):
SH=mH2OfH2O/(m dry airf
dry
air +mH2OfH2O), (6)
and thus
fHdry
2O=(m dry
air/mH2O)·SH/(1−SH). (7)
Equation (4) can then be rewritten as
cG,ak(P1 or P2)=
V CG,ak(P1 or P2)
V Cair(P1 or P2)
(8)
=
RPtop
P1 or P2
fGdryakdp
gmdryair[1+SH/(1−SH)]
RPtop
P1 or P2
dp gmdryair[1+SH/(1−SH)]
.
The correction factor α(in Eq. 3) is applied as follows: P1 corresponds to the pressure level of the TCCON station and P2 corresponds to the pressure level of the GOSAT footprint. For example, for Izaña, the altitude of FTIR station is gener-ally higher than that of GOSAT footprint; therefore P1 < P2, and the a priori profile of satellite product is used as fGdry
in Eq. (8). Note that if the altitude of the GOSAT footprint is higher than the altitude of the TCCON station (P1 > P2), then the a priori profile of TCCON would be used asfGdry.
The corrected GOSAT retrieval product is calculated as
calt_corcor =αccor. (9)
To avoid additional errors coming from the uncertainties on the gas and water vapour profiles, we applied the altitude cor-rection only to the GOSAT products compared with the Izaña TCCON data. Figure 3 shows the time series of altitude-correction factor of XCO2 and XCH4 for each algorithm
with its own a priori profile asfGdry. Since the concentrations decrease rapidly above the tropopause, almost all the ratios for XCH4are below 1. Additionally, the altitude correction
factor has a seasonal variation which is caused by the sea-sonal variation of the tropopause height. The XCO2
altitude-correction factors of NIES and SRFP are near 1 due to the constant vertical profile of CO2, but the correction factor of
ACOS shows a seasonal variation. This is due to the strong seasonal fluctuation in near-surface CO2 concentrations of
the a priori CO2profile of the ACOS algorithm.
3.4 Statistical parameters
After corrections of each TCCON-satellite data pair, several statistical parameters are derived for each of the five stations.
N means the total number of co-located individual or daily averaged TCCON-satellite data pairs;Ris the Pearson’s cor-relation coefficient between the paired data; relative bias and scatter are defined as follows:
relative bias=mean(x)×100 %, (10) relative scatter=std(x)×100 %, (11) with
x=(XSAT−XTCCON)/XTCCON. (12)
In whichXTCCON(SAT)stands for the TCCON or satellite data
product, respectively.
We assume that relative bias follows a Gaussian distribu-tion; then, the 95 % confidence interval of bias is computed as follows:
(x¯−s/√n·t0.025(n−1),x¯+s/√n·t0.025(n−1)), (13)
s= v u u t
1
n−1
n
X
i=1
(xi− ¯x)2. (14)
Table 3.XCO2results of NIES, SRFP and ACOS algorithms at 5 TCCON stations based on all individual satellite–TCCON data pairs. The
95 % confidence interval of relative bias, relative scatter,RandNare defined in Sect. 3.4. Between brackets are the results without altitude
correction. Positive/negative bias means the FTIR measurement is less/larger than the GOSAT product.
Site Target NIES_XCO2 SRFP_XCO2 ACOS_XCO2
95 % Bias Scatter R N 95 % Bias Scatter R N 95 % Bias Scatter R N
Iza Ocean −0.24±0.036 0.37 0.88 397 0.05±0.052 0.38 0.92 205 0.09±0.030 0.33 0.92 458
(−0.27±0.038) (0.39) (0.88) (0.07±0.056) (0.41) (0.91) (−0.13±0.030) (0.33) (0.92)
Land 0.03±0.030 0.42 0.87 740 0.06±0.058 0.67 0.78 521 −0.04±0.024 0.40 0.90 1061
(0.03±0.030) (0.42) (0.88) (0.13±0.057) (0.66) (0.79) (0.07±0.021) (0.34) (0.92)
Asc Ocean −0.31±0.035 0.39 0.91 436 −0.03±0.024 0.30 0.12 98 0.03±0.022 0.30 0.13 718
Land – – – – – – – – – – – –
Dar Ocean −0.06±0.041 0.38 0.92 337 −0.01±0.059 0.30 0.94 101 0.15±0.025 0.31 0.95 614
Land −0.26±0.019 0.37 0.89 1519 0.02±0.014 0.41 0.86 3103 −0.06±0.013 0.34 0.91 2774
Reu Ocean −0.47±0.033 0.36 0.84 467 0.03±0.056 0.35 0.83 153 0.03±0.019 0.27 0.87 766
Land −0.24±0.030 0.33 0.81 477 0.20±0.055 0.56 0.62 402 −0.05±0.025 0.30 0.82 542
Wol Ocean −0.49±0.046 0.41 0.81 302 0.08±0.058 0.38 0.92 162 −0.01±0.026 0.31 0.92 520
Land −0.08±0.022 0.53 0.82 2339 0.03±0.026 0.52 0.82 2513 −0.00±0.014 0.40 0.88 3026
All Ocean −0.33±0.018 0.41 0.89 1939 0.03±0.026 0.35 0.92 719 0.06±0.011 0.31 0.93 3076
Land −0.13±0.013 0.47 0.85 5075 0.04±0.012 0.49 0.84 6539 −0.03±0.008 0.37 0.90 7403
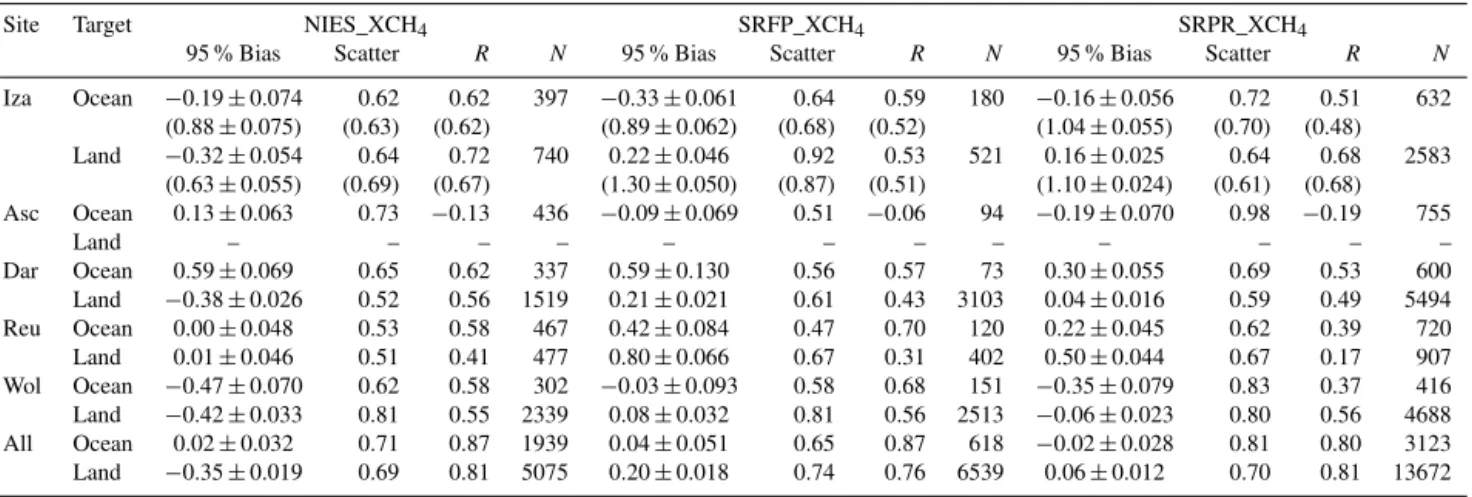
Table 4.XCH4results of NIES, SRFP and SRPR algorithms at 5 TCCON stations based on all individual satellite–TCCON data pairs. The
95 % confidence interval of relative bias, relative scatter,RandNare defined in Sect. 3.4. Between brackets are the results without altitude
correction. Positive/negative bias means the FTIR measurement is less/larger than the GOSAT product.
Site Target NIES_XCH4 SRFP_XCH4 SRPR_XCH4
95 % Bias Scatter R N 95 % Bias Scatter R N 95 % Bias Scatter R N
Iza Ocean −0.19±0.074 0.62 0.62 397 −0.33±0.061 0.64 0.59 180 −0.16±0.056 0.72 0.51 632
(0.88±0.075) (0.63) (0.62) (0.89±0.062) (0.68) (0.52) (1.04±0.055) (0.70) (0.48)
Land −0.32±0.054 0.64 0.72 740 0.22±0.046 0.92 0.53 521 0.16±0.025 0.64 0.68 2583
(0.63±0.055) (0.69) (0.67) (1.30±0.050) (0.87) (0.51) (1.10±0.024) (0.61) (0.68)
Asc Ocean 0.13±0.063 0.73 −0.13 436 −0.09±0.069 0.51 −0.06 94 −0.19±0.070 0.98 −0.19 755
Land – – – – – – – – – – – –
Dar Ocean 0.59±0.069 0.65 0.62 337 0.59±0.130 0.56 0.57 73 0.30±0.055 0.69 0.53 600
Land −0.38±0.026 0.52 0.56 1519 0.21±0.021 0.61 0.43 3103 0.04±0.016 0.59 0.49 5494
Reu Ocean 0.00±0.048 0.53 0.58 467 0.42±0.084 0.47 0.70 120 0.22±0.045 0.62 0.39 720
Land 0.01±0.046 0.51 0.41 477 0.80±0.066 0.67 0.31 402 0.50±0.044 0.67 0.17 907
Wol Ocean −0.47±0.070 0.62 0.58 302 −0.03±0.093 0.58 0.68 151 −0.35±0.079 0.83 0.37 416
Land −0.42±0.033 0.81 0.55 2339 0.08±0.032 0.81 0.56 2513 −0.06±0.023 0.80 0.56 4688
All Ocean 0.02±0.032 0.71 0.87 1939 0.04±0.051 0.65 0.87 618 −0.02±0.028 0.81 0.80 3123
Land −0.35±0.019 0.69 0.81 5075 0.20±0.018 0.74 0.76 6539 0.06±0.012 0.70 0.81 13672
4 Results
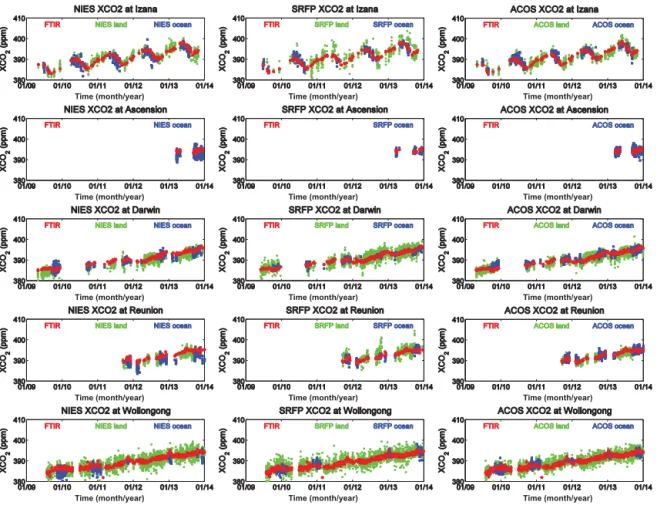
After a priori and altitude correction, the time series of GOSAT retrievals and TCCON measurements are shown in Figs. 4 and 6 and the statistics are listed in Tables 3 and 4, for XCO2and XCH4, respectively. In the figures, red points
represent the FTIR measurements, blue and green ones cor-respond to the GOSAT sun glint data over ocean and the nor-mal nadir data above land, respectively.
4.1 XCO2
For XCO2, the products of three full-physics algorithms
(NIES, SRFP and ACOS) have been compared with the TC-CON FTIR measurements. In general, both ocean and land data of all algorithms show good agreement with FTIR mea-surements, capturing the seasonal and annual variations of
XCO2. There are several data gaps at each site mainly due to
missing TCCON measurements.
cor-Time (month/year) Time (month/year)
Time (month/year)
Time (month/year) Time (month/year)
Time (month/year)
Time (month/year) Time (month/year)
Time (month/year)
Time (month/year) Time (month/year)
Time (month/year)
Time (month/year) Time (month/year)
Time (month/year)
Figure 4.Time series plots of TCCON and GOSAT XCO2measurements based on the individual data pairs. Left, middle and right panels correspond to NIES, SRFP and ACOS algorithms, respectively. Red points represent the FTIR measurements; blue and green ones represent the GOSAT glint data over ocean and the normal nadir data above land, respectively.
rection, especially for ocean data. ACOS provides the largest data density both for land and ocean retrievals and NIES has more ocean data but less land data than SRFP.
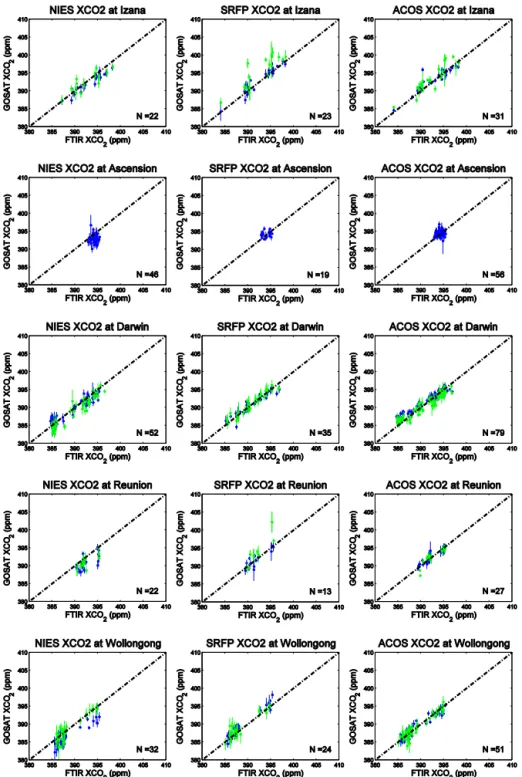
The sub-solar latitude changes throughout the year, con-sequently, the glint ocean data around each TCCON station only exist in several specific months. To better compare the ocean data and land data, we choose the GOSAT soundings when both data co-exist within±1 day. Figure 5 shows the scatter plots of daily median of XCO2from FTIR
measure-ments and different GOSAT algorithms retrievals over five TCCON stations. The error bar represents the standard devi-ation of all the measurements during±1 day. Due to the un-availability of land data, only ocean data are shown at Ascen-sion. It is clear that the ocean XCO2of NIES is smaller than
the land XCO2or FTIR measurements at Izaña, Ascension,
Reunion and Wollongong. For SRPF and ACOS, the accu-racy of the ocean data is close to that of the land data and the scatter of the ocean data is even less than that of the land data. However, it is found that the land data of SRFP at Izaña have a larger bias than those of NIES and ACOS. As the land data around Izaña are located above the Saharan desert, the reason probably is that the scattering model applied by SRFP could
not account correctly for the dust aerosol in the atmosphere, or it could be due to the fact that the gain M bias correction of SRFP is mostly based on comparison with TCCON stations in Australia.
4.2 XCH4
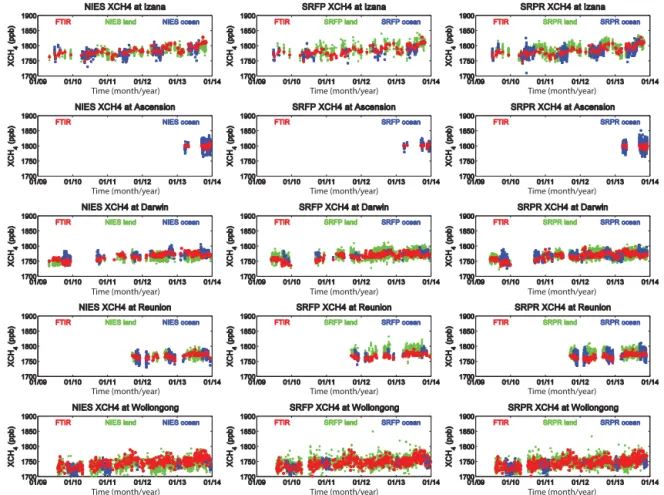
Figure 6 shows the time series of GOSAT XCH4retrievals
from NIES, SRFP and SRPR together with TCCON FTIR measurements. At first glance, similar to the results of XCO2,
both ocean and land data of all algorithms show good agree-ment with FTIR measureagree-ments. Note that it has been found that there is a systematic underestimation of SRPR XCH4
in December 2013 (∼10 ppb) due to an error in the XCO2
algo-Figure 5.The scatter plots of daily median of XCO2from FTIR measurements and different GOSAT algorithms retrievals over 5 TCCON
sites. Only the ocean and land data co-existing within±1 day are selected;Nis the total number of days. The error bar represents the standard
deviation of all the measurements within±1 day. The blue and green points present the glint mode over ocean and the normal nadir mode
above land, respectively.
rithms also see these variations, the emissions probably cover a large area.
Table 4 lists the statistical results for XCH4. Almost all the
biases for ocean and land data at all sites are within 0.5 %, and the scatters are within 1.0 %; this means that they meet
post-Time (month/year) Time (month/year) Time (month/year)
Time (month/year) Time (month/year) Time (month/year)
Time (month/year) Time (month/year) Time (month/year)
Time (month/year) Time (month/year) Time (month/year)
Time (month/year) Time (month/year) Time (month/year)
Figure 6.Time series plots of TCCON and GOSAT XCH4measurements based on the individual data pairs. Left, middle and right panels correspond to NIES, SRFP and SRPR algorithms, respectively. Red, blue and green points represent the FTIR measurements, the GOSAT glint data over ocean and the normal nadir data above land, respectively.
filter is applied that sets a threshold on the scattering param-eters (Butz et al., 2010) . Averaged over all TCCON sites, the relative bias with 95 % confidence intervals of ocean data is less than that of the land data for NIES (0.02±0.032 % vs. −0.35±0.019 %), SRFP (0.04±0.051 vs. 0.20±0.018 %) and SRPR (−0.02±0.028 vs. 0.06±0.012 %). It is found that the XCH4products of SRFP have a smaller data density
than the XCO2 products for ocean data, which means that
some extra filter was applied to the XCH4retrievals.
Note that it is indispensable to do altitude correction when comparing the GOSAT XCH4retrievals with the FTIR
mea-surements for Izaña. The altitude-corrected biases between the GOSAT and FTIR are smaller than the ones obtained without altitude correction, and show similar scatter and higher correlation coefficient. The bias decrease for ocean data is larger than that for land data (1.17 and 0.95 % for NIES, 1.21 and 1.08 % for SRFP, 1.20 and 0.94 % for SRPR), because the GOSAT footprints over ocean have a lower al-titude; this could also be recognized in the time series of altitude-correction factors (see Fig. 3).
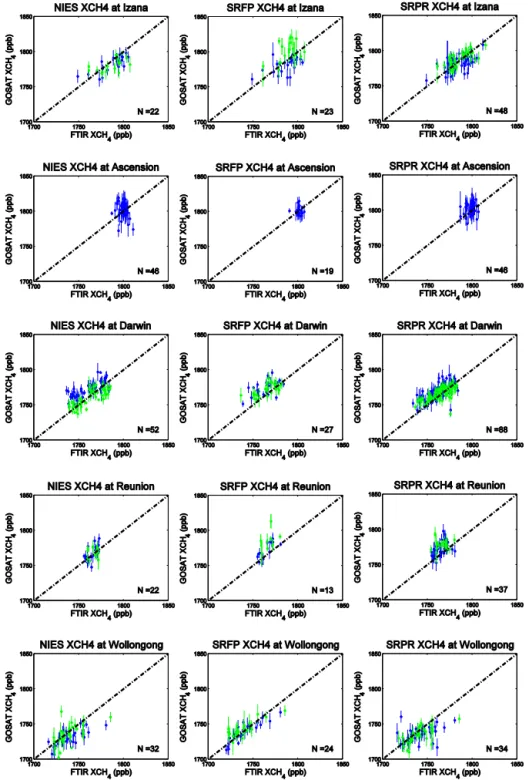
Figure 7 shows the scatter plots of XCH4 daily median
of FTIR measurements and different GOSAT retrievals over
TCCON sites. As in Fig. 5, it is found that the land data of SRFP at Izaña have large bias and scatter. As mentioned at Sect. 4.1, this error probably results from the dust aerosol in the air. Apart from that, the XCH4abundances of ocean data
at Darwin are larger than the FTIR measurements, and the bi-ases range from 0.30 % to 0.59 % for these three algorithms. This systematic bias may originate in the fact that almost all the ocean footprints near Darwin site are limited to a small area (near 125◦E, see Fig. 1), and are a little bit further away from the FTIR location compared with the distances at the other four sites. For the other sites, the accuracy of ocean data of the three algorithms is close to that of the land data.
4.3 Stability
Figure 7.The scatter plots of daily median of XCH4from FTIR measurements and different GOSAT algorithms retrievals over 5 TCCON
sites. Only the ocean and land data co-existing within±1 day are selected;Nis the total number of days. The error bar represents the standard
deviation of all the measurements within±1 day. The blue and green points present the glint mode over ocean and the normal nadir mode
above land, respectively.
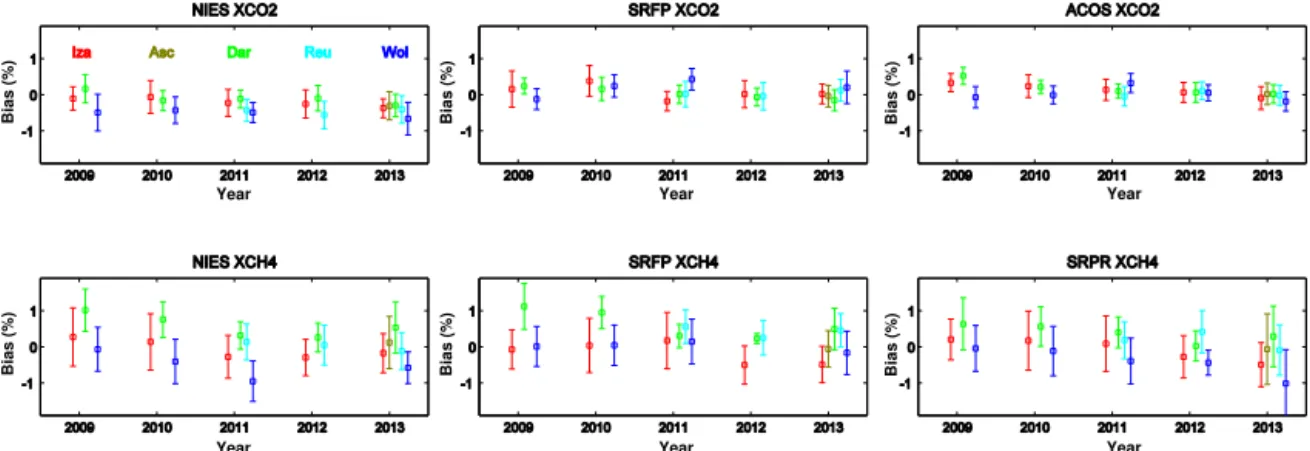
the ocean data from the different algorithms and molecules at each TCCON station, based on individual co-located ocean data pairs. Almost all annual mean biases are within 1 % dur-ing the measurement period 2009–2013 and the differences between adjacent years at are within 0.4 % for XCO2 and
0.7 % for XCH4 at each station. The maximum differences
between each station in the same year are about 0.3 % for XCO2 and 1.2 % for XCH4. The XCO2 ocean data from
Year Year Year
Year Year Year
Bias (%)
Bias (%)
Bias (%)
Bias (%)
Bias (%)
Bias (%)
Figure 8.Annual mean bias of ocean data for each TCCON stations from different algorithms from 2009 to 2013. The error bar represents the standard deviation. Each colour represents one TCCON site (red: Izaña; olive green: Ascension Island; green: Darwin; light blue: Reunion Island; navy blue: Wollongong).
smaller. The XCO2 ocean data from NIES have a
system-atic bias (less than the FTIR measurements), and their stan-dard deviations are similar to those of SPFP. The stability of XCH4ocean data from SRFP tends to be slightly better than
that from NIES and SRPR, but the biases of all three algo-rithms at Darwin are quite large compared with other sites in 2009 and 2010. In addition, we should keep in mind that the XCH4 data from SRFP algorithm have the lowest data
density.
5 Summary
The XCO2and XCH4GOSAT sun glint mode retrievals from
NIES v02.21, SRFP v2.3.5, SRPR v2.3.5 and ACOS v3.5 al-gorithms were validated with the FTIR measurements from five TCCON stations and nearby GOSAT land data. As the GOSAT land data have already been validated with TCCON measurements in previous studies, we mainly focused on the differences between ocean data and nearby land data. Due to the low data density of sun glint mode retrievals, all the GOSAT footprints located within±5◦latitude and±15◦ lon-gitude around each TCCON site were selected. The a priori profile of TCCON is used as the common profile to elimi-nate the differences between GOSAT and FTIR data due to the use of different a priori profiles in their retrievals. An altitude-correction method is applied to eliminate the bias due to altitude differences between the FTIR station loca-tion and the GOSAT footprints, but only in the comparisons made at Izaña; it is particularly important when comparing the XCH4data.
For XCO2, NIES, SRFP and ACOS algorithms are all
full-physics methods but with different cloud filters, forward models and inversion schemes. ACOS provides the largest data density both for land and ocean products and NIES has more ocean data but less land data than SRFP. Averaged over all TCCON sites, the relative biases of ocean data and land data with 95 % confidence intervals are −0.33±0.018 and
−0.13±0.013 % for NIES, 0.03±0.026 and 0.04±0.012 % for SRFP, 0.06±0.011 and−0.03±0.008 % for ACOS, re-spectively. Apart from the XCO2ocean data from NIES
in-dicating a slight systematic bias, other retrievals show good agreement with TCCON measurements, among which the ACOS products have the most robust stability.
For all algorithms, the XCH4retrievals have a worse
sta-bility and smaller precision than the XCO2 retrievals.
Al-though the SRPR and SRFP are both derived from the Re-moTeC algorithm, SRPR provides more data, and its ocean data show a larger scatter. The lower density of SRFP ocean data probably results from the application of a severe cloud and aerosol post-filtering. Averaged over all 5 TCCON sites, the relative bias with 95 % confidence intervals of ocean data is less than that of the land data for NIES (0.02±0.032 vs. −0.35±0.019 %), SRFP (0.04±0.051 vs. 0.20±0.018 %) and SRPR (−0.02±0.028 vs. 0.06±0.012 %) along with the numbers refer to ocean and to land for NIES (1939 vs. 5075), SRFP (618 vs. 6539) and SRPR (3123 vs. 13672).
Acknowledgements. This work is supported by the National
the Carbon Dioxide Information Analysis Center (CDIAC) – ftp://tccon.ornl.gov/. The ACOS/GOSAT retrievals were developed and carried out at the NASA Jet Propulsion Laboratory and Colorado State University, with funding from the NASA ACOS project. The SRON/GOSAT has been supported by the ESA Climate Change Initiative-Greenhouse Gases project. The authors thank D. Wunch for useful comments to the manuscript. The authors also wish to thank the Université de la Réunion, as well as the French regional and national (INSU, CNRS) organizations, for supporting the TCCON operations in Reunion Island. Filip Desmet (used to work at BIRA-IASB) and Jean-Marc Metzger (UMS3365 of the OSU Réunion) are also acknowledged for their support in the operation of the Reunion Island FTIR instrument.
Edited by: J. Notholt
References
Alexe, M., Bergamaschi, P., Segers, A., Detmers, R., Butz, A., Hasekamp, O., Guerlet, S., Parker, R., Boesch, H., Frankenberg, C., Scheepmaker, R. A., Dlugokencky, E., Sweeney, C., Wofsy,
S. C., and Kort, E. A.: Inverse modelling of CH4 emissions
for 2010–2011 using different satellite retrieval products from GOSAT and SCIAMACHY, Atmos. Chem. Phys., 15, 113–133, doi:10.5194/acp-15-113-2015, 2015.
Baker, D. F., Bösch, H., Doney, S. C., O’Brien, D., and Schimel,
D. S.: Carbon source/sink information provided by column CO2
measurements from the Orbiting Carbon Observatory, Atmos. Chem. Phys., 10, 4145–4165, doi:10.5194/acp-10-4145-2010, 2010.
Blumenstock, T., Hase, F., Schneider, M., García, O. E., and Sepúlveda, E.: TCCON data from Izaña, Tenerife, Spain, Re-lease GGG2014R0. TCCON data archive, hosted by the Car-bon Dioxide Information Analysis Center, Oak Ridge Na-tional Laboratory, Oak Ridge, Tennessee, USA, available at: doi:10.14291/tccon.ggg2014.izana01.R0/1149295, last access: 21 October 2014.
Boesch, H., Baker, D., Connor, B., Crisp, D., and Miller, C.: Global
characterization of CO2 column retrievals from
shortwave-infrared satellite observations of the orbiting carbon observatory-2 mission, Remote Sens., 3, observatory-270–304, doi:10.3390/rs30observatory-20observatory-270, 2011.
Bousquet, P., Ciais, P., Miller, J. B., Dlugokencky, E. J., Hauglus-taine, D. A., Prigent, C., Van der Werf, G. R., Peylin, P., Brunke, E.-G., Carouge, C., Langenfelds, R. L., Lathiere, J., Papa, F., Ramonet, M., Schmidt, M., Steele, L. P., Tyler, S. C., and White, J.: Contribution of anthropogenic and natural sources to atmospheric methane variability, Nature, 443, 439– 443, doi:10.1038/nature05132, 2006.
Buchwitz, M., Chevallier, F., and Bergamaschi, P.: User Re-quirements Document (URD) for the GHG-CCI project of ESA’s Climate Change Initiative, Technical Report, 45 pp., ver-sion 25 1(URDv1), 3 February 2011, available at: http://www. esa-ghg-cci.org/?q=webfm_send/21 (last access: 5 June 2014), 2012.
Butz, A., Hasekamp, O. P., Frankenberg, C., and Aben, I.:
Retrievals of atmospheric CO2 from simulated space-borne
measurements of backscattered near-infrared sunlight:
ac-counting for aerosol effects, Appl. Optics, 48, 3322–3336, doi:10.1364/AO.48.003322, 2009.
Butz, A., Hasekamp, O. P., Frankenberg, C., Vidot, J., and Aben,
I.: CH4 retrievals from space-based solar backscatter
mea-surements: Performance evaluation against simulated aerosol and cirrus loaded scenes. J. Geophys. Res., 115, D24302, doi:10.1029/2010jd014514, 2010.
Butz, A., Guerlet, S., Hasekamp, O., Schepers, D., Galli, A., Aben, I., Frankenberg, C., Hartmann, J.-M., Tran, H., Kuze, A., Keppel-Aleks, G., Toon, G., Wunch, D., Wennberg, P., Deutscher, N., Griffith, D., Macatangay, R., Messerschmidt, J.,
Notholt, J., and Warneke, T.: Toward accurate CO2 and CH4
observations from GOSAT, Geophys. Res. Lett., 38, L14812, doi:10.1029/2011gl047888, 2011.
Crisp, D., Fisher, B. M., O’Dell, C., Frankenberg, C., Basilio, R., Bösch, H., Brown, L. R., Castano, R., Connor, B., Deutscher, N. M., Eldering, A., Griffith, D., Gunson, M., Kuze, A., Man-drake, L., McDuffie, J., Messerschmidt, J., Miller, C. E., Morino, I., Natraj, V., Notholt, J., O’Brien, D. M., Oyafuso, F., Polonsky, I., Robinson, J., Salawitch, R., Sherlock, V., Smyth, M., Suto, H., Taylor, T. E., Thompson, D. R., Wennberg, P. O., Wunch, D., and
Yung, Y. L.: The ACOS CO2retrieval algorithm – Part II: Global
XCO2data characterization, Atmos. Meas. Tech., 5, 687–707,
doi:10.5194/amt-5-687-2012, 2012.
CRDP: the GHG-CCI project Climate Research Date Package (CRDP) database, available at: http://www.esa-ghg-cci.org/sites/ default/files/documents/public/documents/GHG-CCI_DATA. html (last access: 29 February 2016), 2015.
Dee, D., Uppala, S., Simmons, A., Berrisford, P., Poli, P., Kobayashi, S., Andrae, U., Balmaseda, M., Balsamo, G., and Bauer, P.: The ERA-Interim reanalysis: Configuration and per-formance of the data assimilation system, Q. J. Roy. Meteor. Soc., 137, 553–597, 2011.
De Mazière, M., Sha, M. K., Desmet, F., Hermans, C., Sco-las, F., Kumps, N., Metzger, J.-M., Duflot, V., and Cam-mas, J.-P.:TCCON data from Réunion Island (La Reunion), France, Release GGG2014R0. TCCON data archive, hosted by the Carbon Dioxide Information Analysis Center, Oak Ridge National Laboratory, Oak Ridge, Tennessee, USA, available at: doi:10.14291/tccon.ggg2014.reunion01.R0/1149288 (last ac-cess: 9 February 2015), 2014.
Dils, B., Buchwitz, M., Reuter, M., Schneising, O., Boesch, H., Parker, R., Guerlet, S., Aben, I., Blumenstock, T., Burrows, J. P., Butz, A., Deutscher, N. M., Frankenberg, C., Hase, F., Hasekamp, O. P., Heymann, J., De Mazière, M., Notholt, J., Suss-mann, R., Warneke, T., Griffith, D., Sherlock, V., and Wunch, D.: The Greenhouse Gas Climate Change Initiative (GHG-CCI): comparative validation of GHG-CCI SCIAMACHY/ENVISAT
and TANSO-FTS/GOSAT CO2 and CH4 retrieval algorithm
products with measurements from the TCCON, Atmos. Meas. Tech., 7, 1723–1744, doi:10.5194/amt-7-1723-2014, 2014. Dohe, S., Sherlock, V., Hase, F., Gisi, M., Robinson, J., Sepúlveda,
E., Schneider, M., and Blumenstock, T.: A method to correct sampling ghosts in historic near-infrared Fourier transform spec-trometer (FTS) measurements, Atmos. Meas. Tech., 6, 1981– 1992, doi:10.5194/amt-6-1981-2013, 2013.
Feist, D. G., Arnold, S. G., John, N., and Geibel, M. C.: TC-CON data from Ascension Island, Saint Helena, Ascension and Tristan da Cunha, Release GGG2014R0. TCCON data archive, hosted by the Carbon Dioxide Information Analysis Center, Oak Ridge National Laboratory, Oak Ridge, Tennessee, USA, avail-able at: doi:10.14291/tccon.ggg2014.ascension01.R0/1149285, last access: 21 October 2014.
Fraser, A., Chan Miller, C., Palmer, P. I., Deutscher, N. M., Jones, N. B., and Griffith D. W. T.: The Australian methane bud-get: Interpreting surface and train-borne measurements using a chemistry transport model, J. Geophys. Res., 116, D20306, doi:10.1029/2011JD015964, 2011.
Geibel, M. C., Messerschmidt, J., Gerbig, C., Blumenstock, T., Chen, H., Hase, F., Kolle, O., Lavric, J. V., Notholt, J., Palm, M., Rettinger, M., Schmidt, M., Sussmann, R., Warneke, T.,
and Feist, D. G.: Calibration of column-averaged CH4over
Eu-ropean TCCON FTS sites with airborne in-situ measurements, Atmos. Chem. Phys., 12, 8763–8775, doi:10.5194/acp-12-8763-2012, 2012.
Griffith, D. W. T., Deutscher, N., Velazco, V. A., Wennberg, P. O., Yavin, Y., Keppel Aleks, G., Washenfelder, R., Toon, G. C., Blavier, J.-F., Murphy, C., Jones, N., Kettlewell, G., Con-nor, B., Macatangay, R., Roehl, C., Ryczek, M., Glowacki, J., Culgan, T., and Bryant, G.: TCCON data from Darwin, Aus-tralia, Release GGG2014R0. TCCON data archive, hosted by the Carbon Dioxide Information Analysis Center, Oak Ridge National Laboratory, Oak Ridge, Tennessee, USA, available at: doi:10.14291/tccon.ggg2014.darwin01.R0/1149290 (last access: 21 October 2014), 2014a.
Griffith, D. W. T., Velazco, V. A., Deutscher, N., Murphy, C., Jones, N., Wilson, S., Macatangay, R., Kettlewell, G., Buchholz, R. R., and Riggenbach, M.: TCCON data from Wollongong, Aus-tralia, Release GGG2014R0. TCCON data archive, hosted by the Carbon Dioxide Information Analysis Center, Oak Ridge National Laboratory, Oak Ridge, Tennessee, USA, available at: doi:10.14291/tccon.ggg2014.darwin01.R0/1149290 (last access: 21 October 2014), 2014b.
Guerlet, S., Butz, A., Schepers, D., Basu, S., Hasekamp, O. P., Kuze, A., Yokota, T., Blavier, J.-F., Deutscher, N. M., Griffith, D. W., Hase, F., Kyro, E., Morino, I., Sherlock, V., Sussmann, R., Galli, A., and Aben, I.: Impact of aerosol and thin cirrus on
retrieving and validating XCO2from GOSAT shortwave infrared
measurements, J. Geophys. Res.-Atmos., 118, 4887–4905, 2013. GUIG: GOSAT User Interface Gateway, TANSO-FTS/GOSAT NIES v02.21 products, available at: https://data.gosat.nies.go. jp/ (last access: 23 March 2016), 2015.
Hase, F., Drouin, B. J., Roehl, C. M., Toon, G. C., Wennberg, P. O., Wunch, D., Blumenstock, T., Desmet, F., Feist, D. G., Heikkinen, P., De Mazière, M., Rettinger, M., Robinson, J., Schneider, M., Sherlock, V., Sussmann, R., Té, Y., Warneke, T., and Weinzierl, C.: Calibration of sealed HCl cells used for TCCON instrumen-tal line shape monitoring, Atmos. Meas. Tech., 6, 3527–3537, doi:10.5194/amt-6-3527-2013, 2013.
Hasekamp, O. P. and Landgraf, J.: Linearization of vector ra-diative transfer with respect to aerosol properties and its use in satellite remote sensing, J. Geophys. Res. 110, D04203, doi:10.1029/2004JD005260, 2005.
Heymann, J., Reuter, M., Hilker, M., Buchwitz, M., Schneising, O., Bovensmann, H., Burrows, J. P., Kuze, A., Suto, H., Deutscher,
N. M., Dubey, M. K., Griffith, D. W. T., Hase, F., Kawakami, S., Kivi, R., Morino, I., Petri, C., Roehl, C., Schneider, M., Sher-lock, V., Sussmann, R., Velazco, V. A., Warneke, T., and Wunch,
D.: Consistent satellite XCO2retrievals from SCIAMACHY and
GOSAT using the BESD algorithm, Atmos. Meas. Tech., 8, 2961–2980, doi:10.5194/amt-8-2961-2015, 2015.
Houweling, S., Kaminski, T., Dentener, F., Lelieveld, J., and Heimann, M.: Inverse modeling of methane sources and sinks using the adjoint of a global transport model, J. Geophys. Res., 104, 26137–26160, 1999.
Inoue, M., Morino, I., Uchino, O., Miyamoto, Y., Yoshida, Y., Yokota, T., Machida, T., Sawa, Y., Matsueda, H., Sweeney, C., Tans, P. P., Andrews, A. E., Biraud, S. C., Tanaka, T., Kawakami,
S., and Patra, P. K.: Validation of XCO2 derived from SWIR
spectra of GOSAT TANSO-FTS with aircraft measurement data, Atmos. Chem. Phys., 13, 9771–9788, doi:10.5194/acp-13-9771-2013, 2013.
Inoue, M., Morino, I., Uchino, O., Miyamoto, Y., Saeki, T., Yoshida, Y., Yokota, T., Sweeney, C., Tans, P. P., Biraud, S. C., Machida, T., Pittman, J. V., Kort, E. A., Tanaka, T., Kawakami, S., Sawa,
Y., Tsuboi, K., and Matsueda, H.: Validation of XCH4
de-rived from SWIR spectra of GOSAT TANSO-FTS with air-craft measurement data, Atmos. Meas. Tech., 7, 2987–3005, doi:10.5194/amt-7-2987-2014, 2014.
IPCC, 2013: Climate Change 2013: The Physical Science Basis. Contribution of Working Group I to the Fifth Assessment Report of the Intergovernmental Panel on Climate Change, edited by: Stocker, T. F., Qin, D., Plattner, G.-K., Tignor, M., Allen, S. K., Boschung, J., Nauels, A., Xia, Y., Bex, V., and Midgley P. M., Cambridge University Press, Cambridge, UK and New York, NY, USA, 1535 pp., doi:10.1017/CBO9781107415324, 2013. Kiel, M., Wunch, D., Wennberg, P. O., Toon, G. C., Hase, F., and
Blumenstock, T.: Improved retrieval of gas abundances from near-infrared solar FTIR spectra measured at the Karlsruhe TC-CON station, Atmos. Meas. Tech., 9, 669–682, doi:10.5194/amt-9-669-2016, 2016.
Keppel-Aleks, G., Toon, G. C., Wennberg, P. O., and Deutscher, N.: Reducing the impact of source brightness fluctuations on spectra obtained by FTS, Appl. Optics, 46, 4774–4779, doi:10.1364/AO.46.004774, 2007.
Keppel-Aleks, G., Wennberg, P. O., and Schneider, T.: Sources of variations in total column carbon dioxide, Atmos. Chem. Phys., 11, 3581–3593, doi:10.5194/acp-11-3581-2011, 2011.
Kulawik, S., Wunch, D., O’Dell, C., Frankenberg, C., Reuter, M., Oda, T., Chevallier, F., Sherlock, V., Buchwitz, M., Osterman, G., Miller, C. E., Wennberg, P. O., Griffith, D., Morino, I., Dubey, M. K., Deutscher, N. M., Notholt, J., Hase, F., Warneke, T., Sussmann, R., Robinson, J., Strong, K., Schneider, M., De Maz-ière, M., Shiomi, K., Feist, D. G., Iraci, L. T., and Wolf, J.: Consistent evaluation of ACOS-GOSAT, BESD-SCIAMACHY, CarbonTracker, and MACC through comparisons to TCCON, Atmos. Meas. Tech., 9, 683–709, doi:10.5194/amt-9-683-2016, 2016.
Maksyutov, S., Patra, P. K., Onishi, R., Saeki, T., and Nakazawa, T.: NIES/FRCGC global atmospheric tracer transport model: De-scription, validation, and surface sources and sinks inversion, Journal of the Earth Simulator, 9, 3–18, 2008.
Marquis, M. and Tans, P.: Carbon Crucible, Science, 320, 460–461, doi:10.1126/science.1156451, 2008.
Meirink, J. F., Eskes, H. J., and Goede, A. P. H.: Sensitivity analysis of methane emissions derived from SCIAMACHY observations through inverse modelling, Atmos. Chem. Phys., 6, 1275–1292, doi:10.5194/acp-6-1275-2006, 2006.
Messerschmidt, J., Macatangay, R., Notholt, J., Petri, C., Warneke,
T., and Weinzierl, C.: Side by side measurements of CO2 by
ground-based Fourier transform spectrometry (FTS), Tellus B, 62, 749–758, doi:10.1111/j.1600-0889.2010.00491.x, 2010. Messerschmidt, J., Geibel, M. C., Blumenstock, T., Chen, H.,
Deutscher, N. M., Engel, A., Feist, D. G., Gerbig, C., Gisi, M., Hase, F., Katrynski, K., Kolle, O., Lavric, J. V., Notholt, J., Palm, M., Ramonet, M., Rettinger, M., Schmidt, M., Suss-mann, R., Toon, G. C., Truong, F., Warneke, T., Wennberg, P. O., Wunch, D., and Xueref-Remy, I.: Calibration of TCCON
column-averaged CO2: the first aircraft campaign over
Euro-pean TCCON sites, Atmos. Chem. Phys., 11, 10765–10777, doi:10.5194/acp-11-10765-2011, 2011.
Nakajima, T. and Tanaka, M.: Algorithms for radiative inten-sity calculations in moderately thick atmospheres using a trun-cation approximation, J. Quant. Spectrosc. Ra., 40, 51–69, doi:10.1016/0022-4073(88)90031-3, 1988.
Natraj, V. and Spurr, R. J. D.: A fast linearized pseudo-spherical two orders of scattering model to account for polarization in verti-cally inhomogeneous scattering absorbing media, J. Quant. Spec-trosc. Ra., 107, 263–293, doi:10.1016/j.jqsrt.2007.02.011, 2007. Nguyen, H., Osterman, G., Wunch, D., O’Dell, C., Mandrake, L., Wennberg, P., Fisher, B., and Castano, R.: A method for
colocat-ing satellite XCO2data to ground-based data and its application
to ACOS-GOSAT and TCCON, Atmos. Meas. Tech., 7, 2631– 2644, doi:10.5194/amt-7-2631-2014, 2014.
O’Dell, C. W., Connor, B., Bösch, H., O’Brien, D., Frankenberg, C., Castano, R., Christi, M., Eldering, D., Fisher, B., Gunson, M., McDuffie, J., Miller, C. E., Natraj, V., Oyafuso, F., Polonsky, I., Smyth, M., Taylor, T., Toon, G. C., Wennberg, P. O., and Wunch,
D.: The ACOS CO2retrieval algorithm – Part 1: Description and
validation against synthetic observations, Atmos. Meas. Tech., 5, 99–121, doi:10.5194/amt-5-99-2012, 2012
Oshchepkov, S., Bril, A., and Yokota, T.: PPDF-based method to account for atmospheric light scattering in observations of carbon dioxide from space, J. Geophys. Res., 113, D23210, doi:10.1029/2008JD010061, 2008.
Rodgers, C. D. and Connor, B. J.: Intercomparison of re-mote sounding instruments, J. Geophys. Res., 108, 4116, doi:10.1029/2002jd002299, 2003.
Schepers, D., Guerlet, S., Butz, A., Landgraf, J., Frankenberg, C., Hasekamp, O., Blavier, J. F., Deutscher, N., M. Griffith, D. W. T., Hase, F., Kyro, E., Morino, I., Sherlock, V., Sussmann, R., and Aben, I.: Methane retrievals from Greenhouse Gases Observ-ing Satellite (GOSAT) shortwave infrared measurements: Perfor-mance comparison of proxy and physics retrieval algorithms. J. Geophys. Res., 117, D10307, doi:10.1029/2012jd017549, 2012. Spurr, R. J. D., Kurosu, T. P., and Chance, K. V.: A lin-earized discrete ordinate radiative transfer model for atmospheric
remote-sensing retrieval, J. Quant. Spectrosc. Ra., 68, 689–735, doi:10.1016/S0022-4073(00)00055-8, 2001.
Stephens, B. B., Gurney, K. R., Tans, P. P., Sweeney, C., Pe-ters, W., Bruhwiler, L., Ciais, P., Ramonet, M., Bousquet, P., Nakazawa, T., Aoki, S., Machida, T., Inoue, G., Vinnichenko, N., Lloyd, J., Jordan, A., Heimann, M., Shibistova, O., Lan-genfelds, R. L., Steele, L. P., Francey, R. J., and Denning, A. S.: Weak northern and strong tropical land carbon Uptake from
vertical profiles of atmospheric CO2, Science, 316, 1732–1735,
doi:10.1126/science.1137004, 2007.
Takemura, T., Egashira, M., Matsuzawa, K., Ichijo, H., O’ishi, R., and Abe-Ouchi, A.: A simulation of the global distribution and radiative forcing of soil dust aerosols at the Last Glacial Max-imum, Atmos. Chem. Phys., 9, 3061–3073, doi:10.5194/acp-9-3061-2009, 2009.
Tanaka, T., Miyamoto, Y., Morino, I., Machida, T., Nagahama, T., Sawa, Y., Matsueda, H., Wunch, D., Kawakami, S., and Uchino, O.: Aircraft measurements of carbon dioxide and methane for the calibration of ground-based high-resolution Fourier Trans-form Spectrometers and a comparison to GOSAT data measured over Tsukuba and Moshiri, Atmos. Meas. Tech., 5, 2003–2012, doi:10.5194/amt-5-2003-2012, 2012.
Taylor, T. E., O’Dell, C. W., O’Brien, D. M., Kikuchi, N., Yokota, T., Nakajima, T. Y., Ishida, H., Crisp, D., and Nakajima, T.: Comparison of Cloud-Screening Methods Applied to GOSAT Near-Infrared Spectra. IEEE T. Geosci. Remote., 50, 295–309, doi:10.1109/TGRS.2011.2160270, 2012.
Wunch, D., Toon, G. C., Wennberg, P. O., Wofsy, S. C., Stephens, B. B., Fischer, M. L., Uchino, O., Abshire, J. B., Bernath, P., Bi-raud, S. C., Blavier, J.-F. L., Boone, C., Bowman, K. P., Browell, E. V., Campos, T., Connor, B. J., Daube, B. C., Deutscher, N. M., Diao, M., Elkins, J. W., Gerbig, C., Gottlieb, E., Griffith, D. W. T., Hurst, D. F., Jiménez, R., Keppel-Aleks, G., Kort, E. A., Macatangay, R., Machida, T., Matsueda, H., Moore, F., Morino, I., Park, S., Robinson, J., Roehl, C. M., Sawa, Y., Sherlock, V., Sweeney, C., Tanaka, T., and Zondlo, M. A.: Calibration of the Total Carbon Column Observing Network using aircraft pro-file data, Atmos. Meas. Tech., 3, 1351–1362, doi:10.5194/amt-3-1351-2010, 2010.
Wunch, D., Toon, G. C., Blavier, J. F., Washenfelder, R. A., Notholt, J., Connor, B. J., Griffith, D. W., Sherlock, V., and Wennberg, P. O.: The total carbon column observing network. Philos. T. R. Soc. A, 369, 2087–2112. doi:10.1098/rsta.2010.0240, 2011a. Wunch, D., Wennberg, P. O., Toon, G. C., Connor, B. J., Fisher,
B., Osterman, G. B., Frankenberg, C., Mandrake, L., O’Dell, C., Ahonen, P., Biraud, S. C., Castano, R., Cressie, N., Crisp, D., Deutscher, N. M., Eldering, A., Fisher, M. L., Griffith, D. W. T., Gunson, M., Heikkinen, P., Keppel-Aleks, G., Kyrö, E., Lindenmaier, R., Macatangay, R., Mendonca, J., Messerschmidt, J., Miller, C. E., Morino, I., Notholt, J., Oyafuso, F. A., Ret-tinger, M., Robinson, J., Roehl, C. M., Salawitch, R. J., Sher-lock, V., Strong, K., Sussmann, R., Tanaka, T., Thompson, D. R., Uchino, O., Warneke, T., and Wofsy, S. C.: A method for
eval-uating bias in global measurements of CO2total columns from
space, Atmos. Chem. Phys., 11, 12317–12337, doi:10.5194/acp-11-12317-2011, 2011b.
Wunch, D., Toon, G. C., Sherlock, V., Deutscher, N. M., Liu, X., Feist, D. G., and Wennberg P. O.: The Total Carbon
Carbon Dioxide Information Analysis Center, Oak Ridge National Laboratory, Oak Ridge, Tennessee, USA, available at:
doi:10.14291/tccon.ggg2014.documentation.R0/1221662, last
access: 11 June 2015.
Yang, Z.: Atmospheric CO2 retrieved from ground-based
near IR solar spectra, Geophys. Res. Lett., 29, 1339, doi:10.1029/2001gl014537, 2002.
Yang, Z., Washenfelder, R. A., Keppel-Aleks, G., Krakauer, N. Y., Randerson, J. T., Tans, P. P., Sweeney, C., and Wennberg, P. O.: New constraints on Northern Hemisphere growing season net flux, Geophys. Res. Lett., 34, L12807, doi:10.1029/2007GL029742, 2007.
Yoshida, Y., Ota, Y., Eguchi, N., Kikuchi, N., Nobuta, K., Tran, H.,
Morino, I., and Yokota, T.: Retrieval algorithm for CO2and CH4
column abundances from short-wavelength infrared spectral ob-servations by the Greenhouse gases observing satellite, Atmos. Meas. Tech., 4, 717–734, doi:10.5194/amt-4-717-2011, 2011.
Yoshida, Y., Kikuchi, N., Morino, I., Uchino, O., Oshchepkov, S., Bril, A., Saeki, T., Schutgens, N., Toon, G. C., Wunch, D., Roehl, C. M., Wennberg, P. O., Griffith, D. W. T., Deutscher, N. M., Warneke, T., Notholt, J., Robinson, J., Sherlock, V., Connor, B., Rettinger, M., Sussmann, R., Ahonen, P., Heikkinen, P., Kyrö, E., Mendonca, J., Strong, K., Hase, F., Dohe, S., and Yokota, T.: Improvement of the retrieval algorithm for GOSAT SWIR
XCO2and XCH4and their validation using TCCON data,