D I A B E T E S & M E T A B O L I S M J O U R N A L
This is an Open Access article distributed under the terms of the Creative Commons At-tribution Non-Commercial License (http://creativecommons.org/licenses/by-nc/3.0/) which permits unrestricted non-commercial use, distribution, and reproduction in any medium, provided the original work is properly cited.
Hemoglobin A1c May Be an Inadequate Diagnostic
Tool for Diabetes Mellitus in Anemic Subjects
Jung Il Son1
, Sang Youl Rhee1,2
, Jeong-taek Woo1,2
, Jin Kyung Hwang1
, Sang Ouk Chin1,2
, Suk Chon1,2
, Seungjoon Oh1,2 , Sung Woon Kim1,2
, Young Seol Kim1,2
1Department of Endocrinology and Metabolism, 2Research Institute of Endocrinology, Kyung Hee University School of Medicine, Seoul, Korea
Background: Recently, a hemoglobin A1c (HbA1c) level of 6.5% has been determined to be a criterion for diabetes mellitus (DM), and it is a widely used marker for the diagnosis of DM. However, HbA1c may be influenced by a number of factors. Ane-mia is one of the most prevalent diseases with an influence on HbA1c; however, its effect on HbA1c varies based on the variable pathophysiology of anemia. The aim of this study was to determine the effect of anemia on HbA1c levels.
Methods: Anemic subjects (n=112) and age- and sex-matched controls (n=217) who were drug naive and suspected of having
DM were enrolled. The subjects underwent an oral glucose tolerance test and HbA1c simultaneously. We compared mean HbA1c and its sensitivity and specificity for diagnosing DM between each subgroup.
Results: Clinical characteristics were found to be similar between each subgroup. Also, when glucose levels were within the nor-mal range, the difference in mean HbA1c was not significant (P=0.580). However, when plasma glucose levels were above the
diagnostic cutoff for prediabetes and DM, the mean HbA1c of the anemic subgroup was modestly higher than in the nonanemic group. The specificity of HbA1c for diagnosis of DM was significantly lower in the anemic subgroup (P<0.05).
Conclusion: These results suggest that the diagnostic significance of HbA1c might be limited in anemic patients.
Keywords: Anemia; Diabetes mellitus; Diagnosis; Hemoglobin A, glycosylated
Corresponding author: Jeong-taek Woo
Department of Endocrinology and Metabolism, Kyung Hee University School of Medicine, 26 Kyungheedae-ro, Dongdaemun-gu, Seoul 130-701, Korea
E-mail: jtwoomd@khmc.or.kr
INTRODUCTION
The prevalence of diabetes mellitus (DM) has been on the rise over the past few decades and the disease is associated with a number of complications. DM affects many organ systems and is responsible for patient morbidity and mortality, so early di-agnosis of DM is important for the prevention of complica-tions [1].
The International Expert Committee and American Diabe-tes Association (ADA) has recommended using hemoglobin A1c (HbA1c) to diagnose DM, since the test is more conve-nient compared to previous methods that required patients to fast for more than 8 hours and has achieved worldwide
stan-dardization [2]. In addition to convenience, HbA1c has good reproducibility and reflects the chronic hyperglycemic state of diabetic patients better than fasting blood glucose. However, HbA1c is affected by a number of factors. Age, ethnicity, ge-netic, hematologic, and many disease-related factors can influ-ence HbA1c levels [3-6]. In terms of various disease entities that can affect measurement, previous studies have suggested that anemia, hemoglobinopathy, chronic liver, or renal disease, and rheumatoid arthritis can influence HbA1c, and this influ-ence is variable depending on the pathogenesis of disease [5]. Anemia is the most prevalent disease with an influence on HbA1c, and its prevalence rate is about 7% for the total popu-lation and about 12% for women in Korea [7]. The pathogene-http://dx.doi.org/10.4093/dmj.2013.37.5.343
sis of anemia varies depending on the cause and the influence on HbA1c is also variable. Iron deficiency and vitamin defi-ciency anemia, which are associated with decreased erythro-poiesis and erythrocyte turnover rate, have been found to in-crease HbA1c levels [8-11]. In contrast, hemolytic anemia, acute hemorrhage, and hemoglobinopathies, which are associ-ated with increased erythropoiesis and decreased erythrocyte life span, have been found to decrease HbA1c levels [5]. Ane-mia due to chronic renal failure has factors that both increase (decreased erythropoiesis, increased carbamylated hemoglo-bin, increased contact with external glucose-like dialysate) and decrease (decreased erythrocyte life span) HbA1c levels. The influence of anemia due to chronic disease on HbA1c lev-el is not clear, but it has been reported that rheumatoid arthri-tis can decrease HbA1c due to the decreased erythrocyte life span [5,12,13].
Therefore, if a physician uses only HbA1c to diagnose DM in patients with anemia, a false diagnosis or management can occur. However, the influence of anemia to HbA1c is difficult to study as has variable influence according to the specific cause of anemia. In Korea, there have been studies on the ade-quacy of HbA1c for diagnosing DM; however, only a few stud-ies have addressed the influence of anemia on HbA1c. The aim of this study was to determine the effect of clinically common anemia on HbA1c level and to examine the feasibility of diag-nosing DM using HbA1c as a marker in anemic patients in Korea.
METHODS
Subjects
We retrospectively reviewed the medical records of 2,119 pa-tients who were ≥20 years old and underwent oral glucose tol-erance testing (OGTT) between January 2006 and June 2008 in the Department of Endocrinology and Metabolism at the Kyung Hee University Medical Center. Among the total sub-jects, 169 patients were anemic and 112 patients were finally analyzed after exclusion. In addition, 217 age- and sex-matched control subjects were selected and analyzed.
Anemia was defined as a hemoglobin level of less than 13 g/ dL in men and less than 12 g/dL in women, according to criteria from the World Health Organization [14]. Subjects were ex-cluded if they were diagnosed with DM previously, had a histo-ry of transfusion in the past 3 months, or a lag of more than 1 month between OGTT and HbA1c test. Subjects who had
chronic renal failure, elevated bilirubin level of more than 1.2 mg/dL, hematologic neoplasms, and acute anemia due to surgi-cal operation or hemorrhage were also excluded. There were no patients with hemoglobinopathies or hemolytic anemia.
Methods
The following data were collected from medical records: age, gender, body mass index, hemoglobin, mean corpuscular vol-ume, mean concentration of hemoglobin, total bilirubin, lipid profile, white blood cell and platelet counts, blood urea nitro-gen (BUN), serum creatinine, and HbA1c.
All subjects underwent a 75 g OGTT and were stratified into normal, prediabetic, and DM subgroups. HbA1c was com-pared between the anemic and nonanemic groups at each glu-cose tolerance test. Subjects were also classified according to glucose tolerance status by fasting plasma glucose (FPG) and postprandial 2-hour glucose (PP2) and the mean HbA1c of both groups was also compared. Furthermore, we compared the sensitivity and specificity of HbA1c for the diagnosis of DM between each subgroup.
The OGTT was conducted after fasting more than 8 hours and venous blood was drawn at fasting and 2 hours after glu-cose loading. After centrifuging the blood samples, plasma glucose levels were measured by the hexokinase method. Ac-cording to criteria suggested by the ADA, DM was defined as a plasma glucose level equal to or greater than 126 mg/dL in the fasting state or equal to or greater than 200 mg/dL 2 hours af-ter glucose load. Impaired fasting glucose (IFG) was defined as a FPG level between 100 and 125 mg/dL, and impaired glucose tolerance (IGT) was defined as a 2-hour plasma glucose level between 140 and 199 mg/dL [15].
Complete blood count parameters were measured by an ADVIA 2120 analyzer (Siemens Healthcare Diagnostics, Sur-rey, UK) and blood chemistry parameters were measured using a TBA-200FR analyzer (Toshiba, Tokyo, Japan). HbA1c con-centrations were determined using high performance liquid chromatography on the HLC-723G8 (Tosoh Biosciences Inc., San Francisco, CA, USA) instrument, which received National Glycohemoglobin Standardization Program certification.
Statistical analysis
variables which were not normally distributed were analyzed by the Mann-Whitney U test. Differences of mean hemoglobin level
according to glucose tolerance status were analyzed by the one-way analysis of variance test. Difference in sensitivities and speci-ficities were compared using the two-sample proportion z test.
The sensitivity and specificity of HbA1c for diagnosing DM were measured using a receiver operating characteristic (ROC) curve by STATA 12.0 program (Stata Corp., College station, TX, USA).
RESULTS
Clinical characteristics
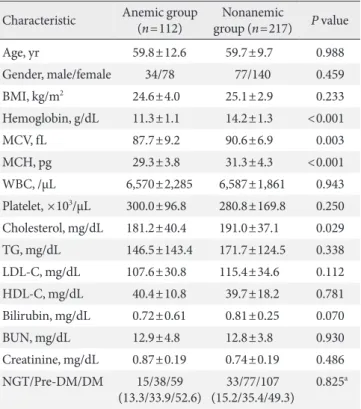
Clinical characteristics and glucose levels of the subjects are shown in Table 1. The age and sex ratios of both groups were not significantly different. The mean hemoglobin was 11.3±1.1 g/dL (range, 8.2 to 12.9 g/dL) in the anemic group and 14.2± 1.3 g/dL (range, 12.2 to 20.1 g/dL) in the nonanemic group (P<
0.05) and the mean corpuscular volume was 87.7±9.2 fL in the
anemic group and 90.6±6.9 fL in the nonanemic group (P<
0.05). There were no significant differences observed in any other hematologic parameters, such as white blood cell and platelet counts or blood chemistry parameters, including BUN, serum creatinine, and total bilirubin. Lipid profiles, including total cholesterol, triglyceride, low density lipoprotein cholester-ol, and high density lipoprotein cholesterol were similar be-tween the two groups with the exception of total cholesterol, which was higher in the nonanemic group than in the anemic group (P<0.05). There was no significant difference in the
pro-portion of each glucose tolerance status between the anemic and nonanemic groups. Mean hemoglobin levels were not dif-ferent according to glucose tolerance status in either the anemic or nonanemic group (Table 2).
Comparison of mean HbA1c levels in various glucose tolerance statuses between anemic and nonanemic subjects
We compared mean HbA1c and mean glucose levels between anemic and nonanemic groups according to FPG and PP2 (Ta-ble 3). The mean HbA1c of subjects with an FPG of less than 100 mg/dL was 5.7%±0.7% in the anemic group and 5.6%± 0.5% in the nonanemic group, and no significant difference was observed between the two groups. However, in the IFG group, mean HbA1c was 6.4%±1.0% in the anemic group and 6.1%± 0.7% in the nonanemic group, a difference with borderline sig-nificance (P=0.050). Similarly, in diabetics, mean HbA1c was
7.8%±1.6% in the anemic group and 7.2%±1.4% in the non-anemic group, a difference with borderline significance (P=
0.059). Mean glucose levels were not significantly different be-tween groups. A similar tendency was also observed in post-prandial glucose. In subjects with a level of less than 140 mg/ dL, mean HbA1c was not different between the anemic and nonanemic groups (5.5% ±0.6% vs. 5.5% ±0.3%; P=0.745).
However, in subjects with IGT, there were modestly higher
Table 1. Clinical characteristics and glucose status of subjects
Characteristic Anemic group (n=112)
Nonanemic
group (n=217) P value
Age, yr 59.8±12.6 59.7±9.7 0.988
Gender, male/female 34/78 77/140 0.459
BMI, kg/m2 24.6±4.0 25.1±2.9 0.233
Hemoglobin, g/dL 11.3±1.1 14.2±1.3 <0.001
MCV, fL 87.7±9.2 90.6±6.9 0.003
MCH, pg 29.3±3.8 31.3±4.3 <0.001
WBC, /µL 6,570±2,285 6,587±1,861 0.943
Platelet, ×103/µL 300.0±96.8 280.8±169.8 0.250
Cholesterol, mg/dL 181.2±40.4 191.0±37.1 0.029
TG, mg/dL 146.5±143.4 171.7±124.5 0.338
LDL-C, mg/dL 107.6±30.8 115.4±34.6 0.112
HDL-C, mg/dL 40.4±10.8 39.7±18.2 0.781
Bilirubin, mg/dL 0.72±0.61 0.81±0.25 0.070
BUN, mg/dL 12.9±4.8 12.8±3.8 0.930
Creatinine, mg/dL 0.87±0.19 0.74±0.19 0.486
NGT/Pre-DM/DM 15/38/59 (13.3/33.9/52.6)
33/77/107 (15.2/35.4/49.3)
0.825a
Values are presented as mean±standard deviation or number (%). BMI, body mass index; MCV, mean corpuscular volume; MCH, mean concentration of hemoglobin; WBC, white blood cell; TG, tri-glyceride; LDL-C, low density lipoprotein cholesterol; HDL-C, high density lipoprotein cholesterol; BUN, blood urea nitrogen; NGT, normal glucose tolerance; DM, diabetes mellitus.
aBy chi-square test.
Table 2. Mean hemoglobin levels according to glucose toler-ance status
Anemic group Nonanemic group P value
NGT 11.34±1.09 14.30±1.29 <0.001
Pre-DM 11.35±0.98 14.00±1.23 <0.001
DM 11.41±1.33 14.25±1.27 <0.001
P valuea 0.964 0.507
Values are presented as mean±standard deviation. NGT, normal glucose tolerance; DM, diabetes mellitus.
HbA1c levels in the anemic group (5.9%±0.8% vs. 5.7%±0.4%;
P=0.051). Likewise, in subjects with a PP2 of more than 200
mg/dL, the mean HbA1c was also higher in the anemic group with borderline significance (7.3%±1.5% vs. 6.9%±1.2%; P=
0.057), although there were no significant differences in mean PP2 levels between groups.
Sensitivity and specificity of HbA1c for the diagnosis of diabetes mellitus in anemic subjects
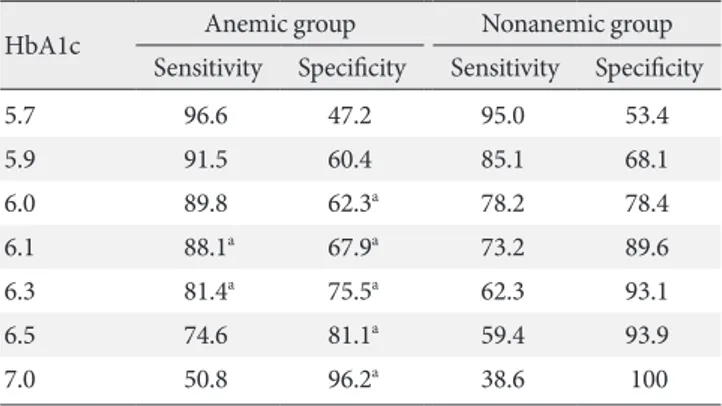
The sensitivity and specificity of HbA1c for the diagnosis of DM were determined using ROC curve analysis. In the non-anemic group, the HbA1c optimal cutoff value of 6.1% had an area under the curve (AUC) of 0.884 with 73.2% sensitivity and 89.6% specificity (Table 4). In the anemic group, the HbA1c optimal cutoff value of 6.2% had an AUC of 0.859 with 86.4% sensitivity and 73.6% specificity. At HbA1c 6.5%, which is cur-rently the diagnostic cutoff, the sensitivity of DM was 59.4% and the specificity was 93.1% in the nonanemic group. In con-trast, in the anemic group, the diagnostic sensitivity of DM was 74.6% and the specificity was 81.1%. The specificity of the ane-mic group was significantly lower than that of the nonaneane-mic group (P<0.05).
DISCUSSION
HbA1c has been proposed as a new diagnostic criterion for DM [16] due to its convenience and high reproducibility and its role in the diagnosis of DM is expected to grow. This study was conducted to determine the effect of anemia on HbA1c, since anemia is highly prevalent among the diseases that can affect HbA1c levels and only a few studies have been performed to investigate the relationship between anemia and HbA1c in Korea. Moreover, although there have been many previous studies conducted in the United States and Europe on the influ-ence of anemia on HbA1c, there is a vacuum in the literature concerning the sensitivity and specificity of using HbA1c in anemic subjects for the diagnosis of DM [8,17-19]. We limited our survey to common forms of anemia and other rare causes of anemia such as aplastic, hemolytic anemia, and other inher-ited disorders, and acute anemia due to hemorrhage or surgery was excluded.
Danescu et al. [17] reported a case of a β-thalassemia minor patient with an HbA1c level of 1.6% despite an elevated blood glucose concentration and explained that the cause was de-creased hemoglobin life span. In a Turkish study, the mean HbA1c level was 7.4% among nondiabetic patients with iron deficiency anemia (IDA) and 5.2% among the controls, with mean HbA1c level decreasing in patients with IDA from 7.4% to 6.2% after iron supplementation [8]. On the contrary, Rai and Pattabiraman [18] were unable to find a difference in the mean concentrations of HbA1c between nondiabetic patients with IDA and controls. The analysis of the National Health and
Table 4. Sensitivity and specificity of hemoglobin A1c for di-agnosing diabetes mellitus in anemic and nonanemic groups
HbA1c Anemic group Nonanemic group Sensitivity Specificity Sensitivity Specificity
5.7 96.6 47.2 95.0 53.4
5.9 91.5 60.4 85.1 68.1
6.0 89.8 62.3a 78.2 78.4
6.1 88.1a 67.9a 73.2 89.6
6.3 81.4a 75.5a 62.3 93.1
6.5 74.6 81.1a 59.4 93.9
7.0 50.8 96.2a 38.6 100
Values are presented as percentage. HbA1c, hemoglobin A1c.
aP<0.05, compared with nonanemic group.
Table 3. Comparison of mean hemoglobin A1c and mean glu-cose levels according to the result of fasting and postprandial glucose between anemic and nonanemic groups
Anemic group
Nonanemic group P value
Fasting glucose
<100 mg/dL HbA1c, % 5.7±0.7 5.6±0.5 0.675
Mean FPG, mg/dL 91.0±5.3 91.4±6.0 0.731
100-125 mg/dL
HbA1c, % Mean FPG, mg/dL
6.4±1.0 110.9±6.8
6.1±0.7 111.0±7.1
0.050 0.911
≥126 mg/dL HbA1c, % 7.8±1.6 7.2±1.4 0.063
Mean FPG, mg/dL 149.6±21.1 154.0±42.2 0.581
Postprandial glucose
<140 mg/dL HbA1c, % 5.5±0.6 5.5±0.3 0.745
Mean PP2, mg/dL 104.0±24.7 114.8±15.9 0.074
140-199 mg/dL
HbA1c, % Mean PP2, mg/dL
5.9±0.8 165.1±17.7
5.7±0.4 166.2±15.2
0.051 0.757
≥200 mg/dL HbA1c, % 7.3±1.5 6.9±1.2 0.057
Mean PP2, mg/dL 275.5±57.0 264.8±53.4 0.238
Values are presented as mean±standard deviation.
Nutrition Examination Survey (NHANES) population data for 8 years revealed that iron deficiency was associated with shifts in HbA1c distribution from less than 5.5% to more than 5.5% in nondiabetic women. However, another NHANES analysis did not detect a significant difference in mean HbA1c level ac-cording to IDA status [20,21].
In the present study, the mean HbA1c level of the anemic group in which the result of OGTT was prediabetes or DM was higher than in the nonanemic group with borderline signifi-cance, although how decreased erythropoiesis and altered red blood cell life span affect glycosylation of hemoglobin in those with elevated blood glucose levels remains unanswered. ROC curve analysis indicated that the sensitivity and speci-ficity of the nonanemic group were not significantly different from previous studies. However, in the anemic group, the specificity was 81.1% at an HbA1c level of 6.5%, the diagnostic cutoff for DM, and was significantly lower than that in the nonanemic group. The diagnostic value of HbA1c was initially suggested to be higher than the optimal cutoff value in order to increase specificity, therefore, the low specificity of HbA1c in the anemic group in this study is meaningful. The results of this study imply that a diagnosis of DM in an anemic patient based primarily on HbA1c levels may have decreased diagnos-tic significance.
Some limitations of this study should be noted. First, selec-tion bias could have occurred in the selecselec-tion of subjects in the nonanemic group. However, we considered several factors that can affect HbA1c levels and tried to minimize this bias. Sec-ond, because the specific causes of anemia in subjects were not clarified, the influence of specific causes of anemia on HbA1c level could not be determined. However, we excluded relative-ly rare and specific disease-related anemias, so it could be as-sumed that most patients had iron or vitamin deficiency ane-mias or anemia due to chronic disease, and those are the most prevalent forms and easily seen in clinical settings. Third, in the comparison of mean HbA1c, the number of subjects was not large enough to draw statistically significant conclusions. To overcome these limitations, further studies with a greater number of subjects are needed to determine the relationship between anemia and HbA1c.
In conclusion, the data suggest that the mean HbA1c level of the anemic group in which the OGTT result was prediabe-tes or DM was higher than in the nonanemic group with bor-derline significance. Moreover, HbA1c had decreased specific-ity for diagnosing DM in those with anemia and an abnormal
glucose tolerance status. Therefore, HbA1c may be a limited tool for diagnosing DM in patients with anemia and clinicians should be cautious in those cases.
CONFLICTS OF INTEREST
No potential conflict of interest relevant to this article was re-ported.
ACKNOWLEDGMENTS
This study was supported by a grant from the Korea Health-care Technology R&D Project, Ministry of Health and Wel-fare, Republic of Korea (A102065).
REFERENCES
1. Rhee SY, Chon S, Kwon MK, Park IeB, Ahn KJ, Kim IJ, Kim SH, Lee HW, Koh KS, Kim DM, Baik SH, Lee KW, Nam MS, Park YS, Woo JT, Kim YS. Prevalence of chronic complications in Korean patients with type 2 diabetes mellitus based on the Korean national diabetes program. Diabetes Metab J 2011; 35:504-12.
2. American Diabetes Association. Diagnosis and classification of diabetes mellitus. Diabetes Care 2010;33 Suppl 1:S62-9. 3. Sung YA. HbA1c for diagnosis of type 2 diabetes in Korea.
Ko-rean J Med 2011;80:288-90.
4. International Expert Committee. International Expert Com-mittee report on the role of the A1C assay in the diagnosis of diabetes. Diabetes Care 2009;32:1327-34.
5. Gallagher EJ, Le Roith D, Bloomgarden Z. Review of hemoglo-bin A(1c) in the management of diabetes. J Diabetes 2009;1:9-17.
6. Kirk JK, D’Agostino RB Jr, Bell RA, Passmore LV, Bonds DE, Karter AJ, Narayan KM. Disparities in HbA1c levels between African-American and non-Hispanic white adults with diabe-tes: a meta-analysis. Diabetes Care 2006;29:2130-6.
7. Korea Centers for Disease Control and Prevention. National Health and Nutrition Examination Survey: The 4th (2008) Re-sults Report. Seoul: Ministry of Health and Welfare; 2010. 8. Coban E, Ozdogan M, Timuragaoglu A. Effect of iron
defi-ciency anemia on the levels of hemoglobin A1c in nondiabetic patients. Acta Haematol 2004;112:126-8.
deficiency. J Intern Med 1990;227:133-6.
10. Hashimoto K, Noguchi S, Morimoto Y, Hamada S, Wasada K, Imai S, Murata Y, Kasayama S, Koga M. A1C but not serum glycated albumin is elevated in late pregnancy owing to iron deficiency. Diabetes Care 2008;31:1945-8.
11. Tarim O, Kucukerdogan A, Gunay U, Eralp O, Ercan I. Effects of iron deficiency anemia on hemoglobin A1c in type 1 diabe-tes mellitus. Pediatr Int 1999;41:357-62.
12. Gomez-Perez FJ, Aguilar-Salinas CA, Almeda-Valdes P, Cue-vas-Ramos D, Lerman Garber I, Rull JA. HbA1c for the diag-nosis of diabetes mellitus in a developing country. A position article. Arch Med Res 2010;41:302-8.
13. Bernstein RM, Freedman DB, Liyanage SP, Dandona P. Glyco-sylated haemoglobin in rheumatoid arthritis. Ann Rheum Dis 1982;41:604-6.
14. Izaks GJ, Westendorp RG, Knook DL. The definition of ane-mia in older persons. JAMA 1999;281:1714-7.
15. American Diabetes Association. Executive summary:
stan-dards of medical care in diabetes: 2011. Diabetes Care 2011;34 Suppl 1:S4-10.
16. Malkani S, Mordes JP. Implications of using hemoglobin A1C for diagnosing diabetes mellitus. Am J Med 2011;124:395-401. 17. Danescu LG, Levy S, Levy J. Markedly low hemoglobin A1c in a patient with an unusual presentation of beta-thalassemia mi-nor. Endocr Pract 2010;16:89-92.
18. Rai KB, Pattabiraman TN. Glycosylated haemoglobin levels in iron deficiency anaemia. Indian J Med Res 1986;83:234-6. 19. Brooks AP, Metcalfe J, Day JL, Edwards MS. Iron deficiency
and glycosylated haemoglobin A. Lancet 1980;2:141.
20. Ford ES, Cowie CC, Li C, Handelsman Y, Bloomgarden ZT. Iron-deficiency anemia, non-iron-deficiency anemia and HbA1c among adults in the US. J Diabetes 2011;3:67-73. 21. Kim C, Bullard KM, Herman WH, Beckles GL. Association