http://dx.doi.org/10.1590/1516-635x1703293-300
Author(s)
Han CI
Ye FI
Shen XI
Liu DI
He FI
Wei SI
Xu HI
Li LI
Liu HI
I Farm Animal Genetic Resources Exploration
and Innovation Key Laboratory of Sichuan Province, Sichuan Agricultural University, Chengdu, Sichuan 611130, P.R. China
Mail Address
Corresponding author e-mail address Chunchun Han, Associate Researcher Institute of Animal Breeding and Genetics,
Sichuan Agricultural University, 211, Huimin Road, Wenjiang Qu, Chengdu, Sichuan 611130, People’s Republic of China.
Phone/Fax: ( 86) 18783580359 E-mail: [email protected]
Keywords
Goose, mTOR pathway, overfeeding, tissues.
Submitted: November/2014 Approved: March/2015
ABSTRACT
This study aimed at examining the effect of overfeeding on the activity of the mTOR pathway in the liver and muscle tissues of Gang geese. Eighty healthy male Gang geese were reared under the same feeding conditions, and were divided at 14 weeks of age into a control group and an overfed group. All birds were slaughtered after three weeks of over feeding. Gene expression and protein content of several genes involved in the mTOR pathway were evaluated. The results showed that the gene expression of mTOR, raptor, and rictor, and the protein contents of mTOR and PI3K were higher in liver, breast muscle, and leg muscle of the overfed group than that of control group. However, the S6K expression level was clearly lower in the liver of the overfed group than that of control group, and there was no evident difference in both breast muscle and leg muscle between the control group and the overfed group. These results suggest that overfeeding induces the activity of raptor, rictor, and mTOR, and that mTOR signaling pathway was closely linked with PI3K pathway in the evaluated geese.
INTRODUCTION
The tissues in Landes geese present different sensitivity to over feeding (Chunchun et al. 2008; Xu et al. 2010). The liver is naturally susceptible steatosis, which may increase more than 10-fold in two weeks and account for up to 10% of the body weight after overfeeding with a carbohydrate-rich diet for less than two weeks (Hermier et al., 1994), while muscle and adipose tissue were less developed (Davail et al., 2000). In recent years, several evidences point to an important role of the mTOR signaling pathway for controlling specific aspects of cellular growth and metabolism through various mechanisms (Howell & Manning, 2011; Laplante & Sabatini, 2009a; Yecies & Manning, 2011). However, considering the specific mechanisms of body metabolism in avian species, little is known about the relationship between the activity of mTOR pathway and the effect of overfeeding with high-carbohydrate diet in goose tissues.
functions. The binding of raptor to mTOR is necessary for the activity of S6K. Studies have suggested that upstream signals regulate the raptor-mTOR interaction and thereby the activity of mTORC1. When activated, mTORC1 positively regulates cellular metabolism by promoting S6K phosphorylation and the expression of genes involved in metabolic regulation (Sipula et al. 2006a). An inhibitor of mTOR1, rapamycin, is able to revert this phenotype and almost completely abolish p70 S6 kinase phosphorylation(Brown et al., 2007; Sipula et al., 2006b). Several studies suggest the best-characterized function of rictor–mTOR plays an important role in Akt/PKB activation (Khamzina et al., 2005b; Rivas et al., 2009a; Watanabe et al., 2011), but the physiological roles and molecular mechanisms of action of mTORC2 are not so clear (Jones et al., 2009).
Gang goose is a Chinese goose breed famous for its high capability of fatty liver production. Overfeeding has been regarded as the main method for goose fatty liver (foie gras) production. Considering the differences of susceptibility to overfeeding among tissues, the present study was designed to identify whether overfeeding induces the mTOR path way activation in goose tissues. The mRNA level of several genes involved in mTOR pathway, such as mTOR, raptor and rictor, S6K and the enzyme activity of mTOR and PI3K(a vital upstream activator of mTOR) in the liver were examined in a control group and overfed group of Gang geese. The relevant gene expression of the mTOR signaling pathway at different stages of overfeeding was also identified in the breast and leg muscles.
MATERIALS AND METHODS
Experimental animals
Eighty healthy male Gang geese, hatched on the same day, were reared under natural conditions of light and temperature at Xichang Huanong Qinye Co. Ltd. Between 0 and 13 weeks, geese were housed collectively and then raised in separated pens during the over feeding period. Between 0 and 4 week of age, the geese had free access to a starter diet containing 2,900 kcal and 205 g protein/kg. Between 4 and 13 weeks, they were fed a grower diet containing 11 MJ/kg and 13.8% protein. The daily amount of feed provided was 200 g between four and five weeks, 300 g between five and eight weeks, and 150 g between eight and 13 weeks. At 14 weeks of age, the geese were divided into two groups: a control group, including 20 geese, and an overfed group including 60 geese. The control group still had free access to the diet, and the over fed
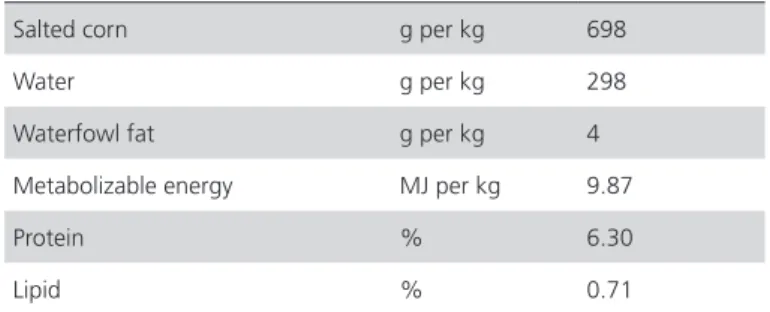
group began the period of “pre-overfeeding”, during which the feed restriction was released progressively to increase the volume of the esophagus and to initiate the metabolic adaptation to over feeding. The three weeks of overfeeding period began. On days 1-3 of the overfeeding period, the geese were received two meals a day of a carbohydrate-rich diet consisting of corn and broken rice (14 MJ/kg, 9% protein, and 0.45% fat), 0.2% pig fat, 0.2% rapeseed oil, 0.8% salt, and 0.5% bee sugar. The final mixture consisted of approximately 70% feed and 30% water (9.87 MJ, 63 g protein, and 7.15 g lipid per kg) (Table 1). All birds were sacrificed on the next day after overfeeding period ended. Birds had free access to water at any time during the entire rearing period. They were supplied with water, but deprived of feed overnight for 18 h before sacrifice. All experimental procedures were approved by the Guidelines on Humane Treatment of Laboratory Animals in Sichuan Agricultural University (2014).
Table 1 – Composition of the overfeeding diet.
Salted corn g per kg 698
Water g per kg 298
Waterfowl fat g per kg 4
Metabolizable energy MJ per kg 9.87
Protein % 6.30
Lipid % 0.71
Tissue samples (20 g) including the liver, breast muscle, and leg muscle were collected from individual geese immediately after slaughter. The samples were frozen in liquid nitrogen and stored at -80°C until analysis of enzymatic activity and mRNA level.
RNA isolation and cDNA synthesis
Quantitative analysis of mTOR, raptor, rictor, andS6K mRNA expression
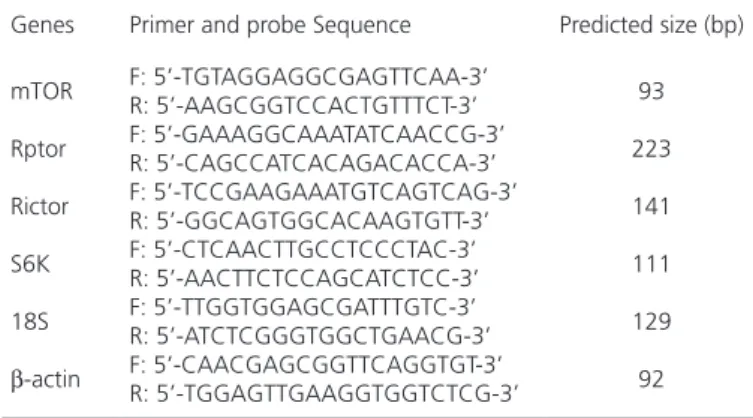
Quantitative RT-PCR was used to detect the gene expression level of the mTOR pathway in different tissues using the SYBR PrimerScript RT-PCR kit (Takara, Dalian) in the iCycler CFX multicolor Real-time PCR Detection System (Bio-Rad, USA). The whole PCR was performed on the Cycler system with a reaction volume of25mL, which included 12.5 μLSYBR Premix EX Taq, 10.5μLsterile water, 2.0 μLcDNA, and 0.5 μLof each gene-specific primer. Real-time PCR was performed using the Cycler system (starting cycle of 95°C for 10 s, followed by 40 cycles of 95°C for 5 s and 60°C for 40 s). An 80-cycle melt curve was performed, starting at 55°C and increasing by 0.5°C/10 s to determine primer specificity. Specific primers for every gene were designed according to the goose gene sequences and are listed in Table 2. The relative expression ratio of target gene, normalized by β-actin and 18S (housekeeping genes) expression level, was calculated using the Multicolor Real-Time PCR Detection System CFX software (Bio-Rad) using the calibrator-normalized relative quantification method 2−ΔΔCT.
Table 2 – Primers sequences for real-time PCR in the study
Genes Primer and probe Sequence Predicted size (bp)
mTOR
Rptor
Rictor
S6K
18S
β-actin
F: 5’-TGTAGGAGGCGAGTTCAA-3’ R: 5’-AAGCGGTCCACTGTTTCT-3’ F: 5’-GAAAGGCAAATATCAACCG-3’ R: 5’-CAGCCATCACAGACACCA-3’ F: 5’-TCCGAAGAAATGTCAGTCAG-3’ R: 5’-GGCAGTGGCACAAGTGTT-3’ F: 5’-CTCAACTTGCCTCCCTAC-3’ R: 5’-AACTTCTCCAGCATCTCC-3’ F: 5’-TTGGTGGAGCGATTTGTC-3’ R: 5’-ATCTCGGGTGGCTGAACG-3’ F: 5’-CAACGAGCGGTTCAGGTGT-3’ R: 5’-TGGAGTTGAAGGTGGTCTCG-3’
93
223
141
111
129
92
F: Forward; R: Reverse
Measurement of PI3K and mTOR enzyme activity in the liver
The PI3K and mTOR enzyme activity were examined using Geese PI3K and mTOR ELISA kit (Yanhui, China). The assay procedure followed the manufacturer’s instructions. The purified geese antibody was used to coat microtiter platewells, then target proteins were added to the wells, which, combined protein with labeled HRP, become antibody-antigen-enzyme-antibody complex. Then, TMb substrate solution was added after complete washing. The color change was measured by spectrophotometry at a wavelength of 450nm. The concentrations of the target proteins were
determined by comparing the optical density (OD) of the samples with the standard curve.
Statistical analysis
Results were shown as means ± standard deviation (SD). The differences were considered significant as p<0.05. The data were submitted to analysis of variance (SAS, 1999) and means were compared by Tukey’s test. Analysis of variance and t-tests were performed using the SAS 9.13 package (SAS Institute Inc., Cary, NC).
RESULTS
Effect of overfeeding on gene expression of mTOR pathway in the liver, breast muscle, and leg muscle
The mTOR gene expression in tissues examined was shown in Figure 1. The mTOR gene expression in the liver of overfed geese was higher than that in the control group (p<0.05). No significant differences were detected in breast muscle and leg muscle between the control group and overfed group.
Figure 1 – Expression level of mTOR in the liver, breast muscle, and leg muscle of Gang geese in the control and experimental groups.
n=3. The different letters indicate significant differences among the different tissues (p﹤0.05)
Figure 3 showsS6K expression levels in the liver, breast and leg muscle tissues. The expression level of S6K in the liver was lower in the overfed group than in the control group (p<0.05), while no significant differences were observed in the leg and breast muscle tissues between groups.
Figure 4 – S6K expression level in the liver, breast muscle, and leg muscle of Gang geese in the control and experimental groups.
n=3. The different letters indicate significant differences among the different tissues (p﹤0.05)
Protein content of mTOR and PI3K in the liver, breast muscle, and leg muscle
In order to determine if overfeeding-stimulated mTOR pathway activation was dependent on the PI3K pathway, mTOR and PI3K protein contents in the liver, breast muscle and leg muscle were measured and are reported in Figure 5. The PI3K protein content was higher in all the three tissues of the overfed group compared with the control group (p<0.05; Figure5A).
In addition, mTOR protein content was also higher in the three evaluated tissues of the overfed group compared with the control group (p<0.05; Figure 5B), and the mRNA abundance of mTOR was also higher in the experimental group. Our result suggested that mTOR pathway activation was closely linked to the PI3K pathway.
Figure 5 – Protein content of mTOR and PI3K in the liver, breast muscle, and leg muscle of Gang geese in the control and experimental groups.
n=3. The different letters indicate significant differences among the different tissues (p﹤ 0.05).
Figure 3 – Rictor expression level in the liver, breast muscle, and leg muscle of Gang geese in the control and experimental groups.
n=3. The different letters indicate significant differences among the different tissues (p﹤0.05)
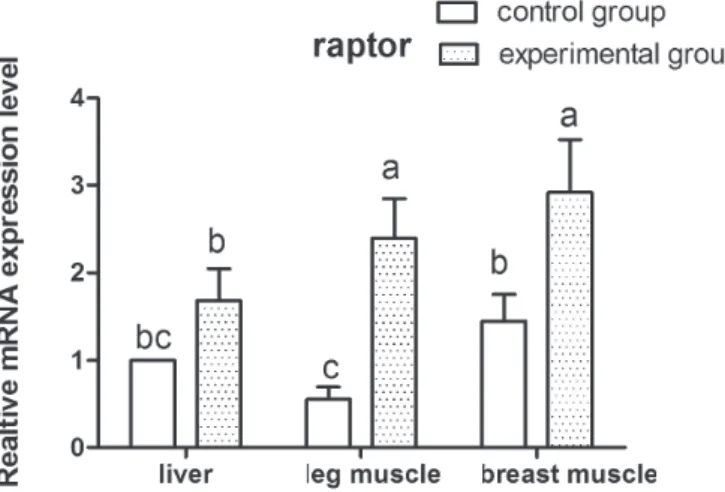
Figure 2 – Raptor expression level in the liver, breast muscle, and leg muscle of Gang geese in the control and experimental groups.
n=3. The different letters indicated significant differences among the different tissues (p﹤0.05)
A
DISCUSSION
Several studies have revealed that both HC (high-carbohydrate) and HF (high-fat) overfeeding led to significant increases in activation of the nutrient sensor, mTOR, and its downstream target, S6K1 (Adochio et al., 2009; Khamzina et al., 2005a). The in-vivo formation and activation of mTORC1 and 2 and the activation of their respective downstream substrates were up-regulated in rats fed a high-fat diet (Rivas et al., 2009b). Our results support the above conclusion that high-carbohydrate overfeeding stimulates the activity of the mTOR pathway in goose tissues. The activation pattern of mTOR pathway may be explained as follows: overfeeding induces mTOR activation by mTORC1-dependent feedback mechanisms (Adochio et al., 2009; Howell & Manning, 2011; Tremblay & Marette, 2001). Overfeeding with a high-carbohydrate diet leads to significant increases in the activation of mTORC1 when mTOR is bound to the protein partner raptor. When activated, mTORC1 can exert negative regulatory effects on upstream signaling molecules, which leads to an attenuation of PI3K phosphorylation and activation, partially decreasing the activity of the downstream targets, mTOR and S6K1. On the other hand, previous studies have shown that S6K1-mediated phosphorylation of the core mTORC2 component Rictor was associated with the attenuation of Akt phosphorylation and activation (Dibble et al., 2009; Julien et al., 2010). Knockdown of either mTOR or rictor, but not raptor, significantly decreases Akt phosphorylation (Sarbassov et al., 2005b). In the present study, the results showed that both rictor and raptor gene expressions were higher in the overfed group than in the control group, which indicates that mTOR/S6K activity may rely on both rictor- and raptor-mediated Aktactivity.
In some palmipedes species, such as geese, overfeeding with a carbohydrate-rich diet results in high lipid synthesis and accumulation. Also fatty acids are also synthesized in the adipose tissue, he liver is the main site of this synthesis(Hermier, 1997; Saadoun & Leclercq, 1987). In overfed geese, Because of a less efficient secretion of the hepatic lipids towards secretion into the plasma and adipose storage tissues (Davail et al., 2003; Hermier et al., 2003) and by inhibiting the absorption of plasma lipids by extrahepatic tissues (Zechner, 1997), excessive carbohydrates are converted into fatty acids and preferentially deposited for storage as triglycerides in liver, while muscle tissues are less sensitive to overfeeding in geese (Davail et
al., 2000). In addition, as lipid deposition increases in the liver, the capacity of lipid deposition and other metabolism functions of this organ dramatically change, and consequently, the lipids synthetized by liver are transferred to extrahepatic tissues for storage. In contrast with the mechanism of lipid metabolism regulation in other animals, our data demonstrated that mTOR and raptor expression levels were higher in the overfed group, but rictor and S6Kexpression level showed a clear difference among different tissues. In the control group, higher mTOR gene expression were found in the breast and leg muscles compared with the liver, whereas in the overfed group, mTOR protein content was higher in liver than in the other evaluated tissues. Recent studies found that changes in the expression of mTOR, which is at the heart of a nutrient-sensing signaling network that controls cellular metabolism (Howell & Manning, 2011; Xu et al., 2010), may be related to the different susceptibility levels to overfeeding and to lipid storage and transport in goose tissues.
novel protein rictor (rapamycin-insensitive companion of mTOR) (Sarbassov et al. 2004). It is well known that the mTOR-rictor complex has a positive role in Aktphosphorylation and activity (Sarbassov et al., 2005b). Rictor knockdown mediated by siRNA does not reduce S6K phosphorylation(Sarbassov et al., 2004). Thus, rictor is not a positive regulator of S6K phosphorylation. Intracellularly, the composition of the mTOR complex is dynamic that reductions in rictor levels lead increase the levels of the raptor-containing mTOR complex (Sarbassov et al., 2004). These studies indicate that changes in mTOR activation are not associated with the downstream target S6K.
In conclusion, the present study demonstrated that overfeeding geese with carbohydrate-rich corn-based diet may induce mTOR pathway changes in the liver and muscle tissues, and that mTOR signaling pathway is closely linked with the PI3K pathway.
ACKNOWLEDGEMENTS
This study was supported by the National Natural Science Funds of China (No. 31101712) and the Research Fund for the Doctoral Program of Higher Education of China (No.20115103120006).
REFERENCES
Adochio RL, Leitner JW, Gray K, Draznin B, Cornier M-A. Early responses of insulin signaling to high-carbohydrate and high-fat overfeeding. Nutrition & Metabolism 2009;6(1):37.
Alessi DR, Kozlowski MT, Weng Q-P, Morrice N, Avruch J. 3-Phosphoinositide-dependent protein kinase 1 (PDK1) phosphorylates and activates the p70 S6 kinase in vivo and in vitro. Current Biology 1998;8(2):69-81.
Blanchard P-G, Festuccia WT, Houde VP, St-Pierre P, Brûlé S, Turcotte V, et al. Major involvement of mTOR in the PPARγ-induced stimulation of adipose tissue lipid uptake and fat accretion. Journal of Lipid Research 2012;53(6):1117-1125.
Brown NF, Stefanovic-Racic M, Sipula IJ, Perdomo G. The mammalian target of rapamycin regulates lipid metabolism in primary cultures of rat hepatocytes. Metabolism: Clinical and Experimental 2007;56(11):1500-1507.
Chunchun H, Jiwen W, Hengyong X, Liang L, Jianqiang Y, Li J, Weihua Z. Effect of overfeeding on plasma parameters and mRNA expression of genes associated with hepatic lipogenesis in geese. Australasian Journal of Animal Sciences 2008;21(4):590.
Davail S, Guy G, André J-M, Hermier D, Hoo-Paris R. Metabolism in two breeds of geese with moderate or large overfeeding induced liver-steatosis. Comparative Biochemistry and Physiology Part A: Molecular & Integrative Physiology 2000;126(1):91-99.
Davail S, Rideau N, Guy G, André J-M, Hermier D, Hoo-Paris R. Hormonal and metabolic responses to overfeeding in three genotypes of ducks. Comparative Biochemistry and Physiology-Part A: Molecular & Integrative Physiology 2003;134(4):707-715.
Dibble CC, Asara JM, Manning BD. Characterization of Rictor phosphorylation sites reveals direct regulation of mTOR complex 2 by S6K1. Molecular and Cellular Biology 2009;29(21):5657-5670.
Hay N, Sonenberg N. Upstream and downstream of mTOR. Genes & Development 2004;18(16):1926-1945.
Hermier D. Lipoprotein metabolism and fattening in poultry. The Journal of Nutrition 1997;127(5):805S-808S.
Hermier D, Guy G, Guillaumin S, Davail S, André J-M, Hoo-Paris R. Differential channelling of liver lipids in relation to susceptibility to hepatic steatosis in two species of ducks. Comparative Biochemistry and Physiology Part B: Biochemistry and Molecular Biology 2003;135(4):663-675.
Hermier D, Rousselot-Pailley D, Peresson R, Sellier N. Influence of orotic acid and estrogen on hepatic lipid storage and secretion in the goose susceptible to liver steatosis. Biochimica et Biophysica Acta (BBA)-Lipids and Lipid Metabolism 1994;1211(1):97-106.
Howell JJ, Manning BD. mTOR couples cellular nutrient sensing to organismal metabolic homeostasis. Trends in Endocrinology & Metabolism 2011;22(3):94-102.
Jones KT, Greer ER, Pearce D, Ashrafi K. Rictor/TORC2 regulates Caenorhabditis elegans fat storage, body size, and development through sgk-1. PLoS Biology 2009;7(3):e1000060.
Julien L-A, Carriere A, Moreau J, Roux PP. mTORC1-activated S6K1 phosphorylates Rictor on threonine 1135 and regulates mTORC2 signaling. Molecular and Cellular Biology 2010;30(4):908-921.
Khamzina L, Veilleux A, Bergeron S, Marette A. Increased activation of the mammalian target of rapamycin pathway in liver and skeletal muscle of obese rats: possible involvement in obesity-linked insulin resistance. Endocrinology 2005a;146(3):1473-1481.
Khamzina L, Veilleux A, Bergeron S, Marette A. Increased activation of the mammalian target of rapamycin pathway in liver and skeletal muscle of obese rats: possible involvement in obesity-linked insulin resistance. Endocrinology 2005b;146(3):1473-1481.
Laplante M, Sabatini DM. An emerging role of mTOR in lipid biosynthesis. Current Biology 2009a;19(22):R1046-R1052.
Laplante M, Sabatini DM. An emerging role of mTOR in lipid biosynthesis. Current Biology 2009b;19(22):R1046-1052.
Pullen N, Dennis PB, Andjelkovic M, Dufner A, Kozma SC, Hemmings BA, Thomas G. Phosphorylation and activation of p70s6k by PDK1. Science 1998;79(5351):707-710.
Rivas DA, Yaspelkis BB, 3rd, Hawley JA, Lessard SJ. Lipid-induced mTOR activation in rat skeletal muscle reversed by exercise and 5’-aminoimidazole-4-carboxamide-1-beta-D-ribofuranoside. The Journal of Endocrinology 2009a;202(3):441-451.
Rivas DA, Yaspelkis BB, Hawley JA, Lessard SJ. Lipid-induced mTOR activation in rat skeletal muscle reversed by exercise and 5’-aminoimidazole-4-carboxamide-1-β-d-ribofuranoside. Journal of Endocrinology 2009b;202(3):441-451.
Saltiel AR, Kahn CR. Insulin signalling and the regulation of glucose and lipid metabolism. Nature 2001;414(6865):799-806.
Sarbassov DD, Ali SM, Kim D-H, Guertin DA, Latek RR, Erdjument-Bromage H, Tempst P, Sabatini DM. Rictor, a novel binding partner of mTOR, defines a rapamycin-insensitive and raptor-independent pathway that regulates the cytoskeleton. Current Biology 2004;14(14):1296-1302.
Sarbassov DD, Guertin DA, Ali SM, Sabatini DM. Phosphorylation and regulation of Akt/PKB by the rictor-mTOR complex. Science 2005b;307(5712):1098-1101.
Sipula IJ, Brown NF, Perdomo G. Rapamycin-mediated inhibition of mammalian target of rapamycin in skeletal muscle cells reduces glucose utilization and increases fatty acid oxidation. Metabolism 2006a;55(12):1637-1644.
Sipula IJ, Brown NF, Perdomo G. Rapamycin-mediated inhibition of mammalian target of rapamycin in skeletal muscle cells reduces glucose utilization and increases fatty acid oxidation. Metabolism: Clinical and Experimental 2006b;55(12):1637-1644.
Tremblay F, Marette A. Amino acid and insulin signaling via the mTOR/p70 S6 kinase pathway A negative feedback mechanism leading to insulin resistance in skeletal muscle cells. Journal of Biological Chemistry 2001;276(41):38052-38060.
Watanabe R, Wei L, Huang J. mTOR signaling, function, novel inhibitors, and therapeutic targets. Journal of Nuclear Medicine 2011;52(4):497-500.
Wullschleger S, Loewith R, Hall MN. TOR signaling in growth and metabolism. Cell 2006;124(3):471-484.
Xu H, Wang Y, Han C, Jiang L, Zhuo W, Ye J, Wang J. Estimation of lipoprotein-lipase activity (LPL) and other biochemical changes in two breeds of overfeeding geese. Asian-Australian Journal of Animal Science 2010;23:1221-1228.
Yecies JL, Manning BD. Transcriptional control of cellular metabolism by mTOR signaling. Cancer Research 2011;71(8):2815-2820.