Identification of Valid Reference Genes for
the Normalization of RT-qPCR Expression
Studies in Human Breast Cancer Cell Lines
Treated with and without Transient
Transfection
Lin-Lin Liu1☯, Hui Zhao1☯, Teng-Fei Ma1, Fei Ge2,3, Ce-Shi Chen3, Ya-Ping Zhang1,4*
1Laboratory for Conservation and Utilization of Bio-resource, Yunnan University, Kunming, China,2 Department of Endocrine Surgery, The First Affiliated Hospital of Chongqing Medical University, Chongqing, 400016, China,3Key Laboratory of Animal Models and Human Disease Mechanisms of Chinese Academy of Sciences & Yunnan Province, Kunming Institute of Zoology, Chinese Academy of Sciences, Kunming, Yunnan, China,4State Key Laboratory of Genetic Resources and Evolution, Kunming Institute of Zoology, Chinese Academy of Sciences, Kunming, China
☯These authors contributed equally to this work. *[email protected]
Abstract
Reverse transcription-quantitative polymerase chain reaction (RT-qPCR) is a powerful technique for examining gene expression changes during tumorigenesis. Target gene ex-pression is generally normalized by a stably expressed endogenous reference gene; how-ever, reference gene expression may differ among tissues under various circumstances. Because no valid reference genes have been documented for human breast cancer cell lines containing different cancer subtypes treated with transient transfection, we identified appropriate and reliable reference genes from thirteen candidates in a panel of 10 normal and cancerous human breast cell lines under experimental conditions with/without transfec-tion treatments with two transfectransfec-tion reagents. Reference gene expression stability was cal-culated using four algorithms (geNorm, NormFinder, BestKeeper and comparative delta Ct), and the recommended comprehensive ranking was provided using geometric means of the ranking values using the RefFinder tool. GeNorm analysis revealed that two reference genes should be sufficient for all cases in this study. A stability analysis suggests that18S rRNA-ACTBis the best reference gene combination across all cell lines;ACTB-GAPDHis best for basal breast cancer cell lines; andHSPCB-ACTBis best for ER+breast cancer cells. After transfection, the stability ranking of the reference gene fluctuated, especially with Lipofectamine 2000 transfection reagent in two subtypes of basal and ER+breast cell lines. Comparisons of relative target gene (HER2) expression revealed different expression-al patterns depending on the reference genes used for normexpression-alization. We suggest that iden-tifying the most stable and suitable reference genes is critical for studying specific cell lines under certain circumstances.
OPEN ACCESS
Citation:Liu L-L, Zhao H, Ma T-F, Ge F, Chen C-S, Zhang Y-P (2015) Identification of Valid Reference Genes for the Normalization of RT-qPCR Expression Studies in Human Breast Cancer Cell Lines Treated with and without Transient Transfection. PLoS ONE 10(1): e0117058. doi:10.1371/journal.pone.0117058
Academic Editor:Yves St-Pierre, INRS, CANADA
Received:August 20, 2014
Accepted:December 18, 2014
Published:January 24, 2015
Copyright:© 2015 Liu et al. This is an open access article distributed under the terms of theCreative Commons Attribution License, which permits unrestricted use, distribution, and reproduction in any medium, provided the original author and source are credited.
Data Availability Statement:All relevant data are within the paper and its Supporting Information files.
Introduction
Worldwide, breast cancer is the most common malignancy in females and accounts for ap-proximately 30% of all cancers diagnosed [1]. Breast cancer is a complex and heterogeneous disease that can be classified into at least four subtypes: luminal A, luminal B, HER2 and basal cancers [2]. Each subtype has a different prognosis and treatment response [3], so it is crucial to develop robust biomarkers and reliable assays to detect, diagnose and treat specific breast cancers. Tumorigenesis is associated with gene expression changes; therefore, gene expression profiling is a common aspect of breast cancer research and drug treatment practices [4].
Reverse transcription-quantitative polymerase chain reaction (RT-qPCR) is a powerful technique for confirming gene expression differences or measuring transcript abundance due to its sensitivity, reproducibility, simplicity and high-throughput [5,6]. With this assay, the common method is normalization of gene expression using an endogenous reference gene. Ideal reference genes should be sufficiently abundant and have stable expression across differ-ent tissues and cell lines under differdiffer-ent experimdiffer-ental conditions, but the ideal and universal reference gene does not exist in practice [7]. Inaccurate normalization can cause inadequate quantification and incorrect conclusions [7,8]. Currently, several mathematical approaches in-cluding geNorm [7], NormFinder [9], Bestkeeper [10] and comparative delta Ct [11] have been developed to assist appropriate reference gene selection and geNorm provides a measure of the minimum optimal number of reference genes to normalize [7].
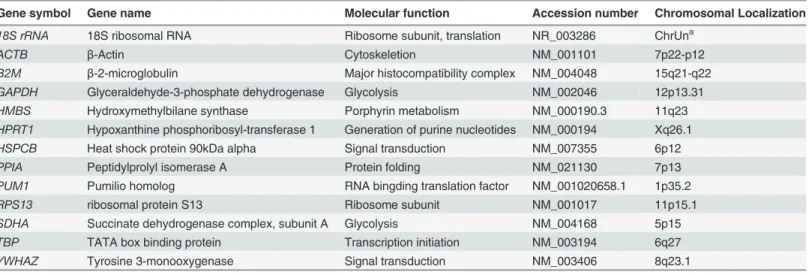
Using different established breast cancer cell lines with molecular profiles observed in breast carcinomas (Table 1), cancer phenotype studies can be undertaken [2] if the appropriate refer-ence gene can be used to normalize a gene of interest in those cell lines. Studies have identified valid reference genes for normalization in breast tumor and normal tissues [12–17], but only two studies are available for evaluating reference genes for cell lines [13,18]. One study includ-ed 4 human breast cell lines of increasing metastatic potential, such as MCF-10A, MCF-10T, MCF-7 and MDA-MB-231 [18], and the other used included ER+breast cancer lines—T47D, MCF-7 and BrCa-MZ-01 [13]. Thus, more work is required to identify additional reference genes for more human breast cancer cell subtypes.
The application of transfection, used to introduce a gene of interest into a cell, is an impor-tant tool during molecular and cellular research. Two transfection approaches to introduce a gene of interest into a cell include transfection reagents (usually, liposome-based) and electro-poration. These technologies are useful but the transfection reagents are cytotoxic [19] as docu-mented by Jacobsen’s group who suggested that different transfection reagents give different transcriptional effects, regardless of the presence or absence of the gene of interest. Whether transient transfection using different transfection reagents can influence reference gene expres-sion is unclear. Thus, we identified the most stable reference genes for normalization across human breast cell lines from different cancer subtypes with or without transient transfection. First, we searched the literature to select 13 genes (Table 2) to be candidate reference genes. A panel of 10 cell lines containing 5 cancer subtypes (Table 1) was either transiently transfected
Table 1. Molecular classification of human normal and breast cancer cell lines.
Classification Immunoprofile Cell lines in this study
Luminal A ER+, PR+/−, HER2− MCF-7, T47D, HCC1500
Luminal B ER+, PR+/−, HER2+ BT474
Basal ER−, PR−, HER2− HCC1806, SUM149PT, HCC1937, MDA-MB-231
HER2 ER−, PR−, HER2+ SKBR3
Normal ER−, PR−, HER2− MCF-10A
or not transfected with a control vector using either Lipofectamine 2000 or X-tremeGENE HP. Then reference gene expression stability was measured using 4 algorithms. Finally, the expres-sion levels of target gene, epidermal growth factor receptor 2 (HER2), using the most/least
sta-ble and most used reference geneGAPDH, to validate the selection of candidate
reference genes.
Materials and Methods
Selection of reference genes
A total of 13 candidate reference genes were selected from a search of the relevant literature, particularly relating to reference genes previously identified in breast cancer. As can be seen in Table 2, the candidate genes ranged from traditional, commonly used reference genes such as
GAPDHto less well known genes such asHSPCB, spanning a range of cellular functions.
Among these candidate genes,18S rRNA, ACTB, HPRT1, HSPCB, PPIA, PUM1, RPS13, SDHA
andTBPgenes were reported to be optimal reference genes for normalization in breast cancer
tumor and normal tissues [12–18,20]. In addition, theB2Mgene was identified as a valid
refer-ence gene for expression studies in human colorectal tumor tissues [21] and in human stomach cancer [8]. The other 3GAPDH, HMBSandYWHAZgenes are commonly used
reference genes.
Breast cell lines and culture conditions
One normal and nine breast cancer cell lines of four subtypes were used (Table 1). Cell lines were from American Type Culture Collection (ATCC,www.atcc.org). HCC1937, HCC1806, HCC1500, BT474 and T47D cells were cultured in RPMI1640 media with 5% fetal bovine serum, 4.5 g/L glucose (Amresco), 1 mM sodium pyruvate, 10 mM HEPES (Life technologies), 1.5 g/L sodium bicarbonate, 100 units/mL penicillin, 100μg/mL streptomycin. MDA-MB-231 and SKBR3 cell lines were cultured in Dulbecco’s modified Eagle’s medium containing 10% fetal bovine serum, 100 units/mL penicillin and 100μg/mL streptomycin. SUM149PT cells were cultured in Ham’s F12 containing 5μg/mL insulin, 1μg/mL hydrocortisone (Sigma), 10 mM HEPES, 100 units/mL penicillin and 100μg/mL streptomycin. MCF7 cells were cultured
Table 2. Information on reference genes used in this study.
Gene symbol Gene name Molecular function Accession number Chromosomal Localization
18S rRNA 18S ribosomal RNA Ribosome subunit, translation NR_003286 ChrUna
ACTB β-Actin Cytoskeletion NM_001101 7p22-p12
B2M β-2-microglobulin Major histocompatibility complex NM_004048 15q21-q22
GAPDH Glyceraldehyde-3-phosphate dehydrogenase Glycolysis NM_002046 12p13.31
HMBS Hydroxymethylbilane synthase Porphyrin metabolism NM_000190.3 11q23
HPRT1 Hypoxanthine phosphoribosyl-transferase 1 Generation of purine nucleotides NM_000194 Xq26.1
HSPCB Heat shock protein 90kDa alpha Signal transduction NM_007355 6p12
PPIA Peptidylprolyl isomerase A Protein folding NM_021130 7p13
PUM1 Pumilio homolog RNA bingding translation factor NM_001020658.1 1p35.2
RPS13 ribosomal protein S13 Ribosome subunit NM_001017 11p15.1
SDHA Succinate dehydrogenase complex, subunit A Glycolysis NM_004168 5p15
TBP TATA box binding protein Transcription initiation NM_003194 6q27
YWHAZ Tyrosine 3-monooxygenase Signal transduction NM_003406 8q23.1
aHomo sapiensunplaced genomic contig, GRCh37.p5.
in minimal essential medium containing 5% fetal bovine serum, 0.01 mg/mL insulin (Wanbang), 1 mM sodium pyruvate, 0.1 mM non-essential amino acids, 1.5 g/L sodium bicarbonate, 100 units/mL penicillin and 100μg/mL streptomycin. The immortalized breast epithelial cell line MCF-10A was maintained in Dulbecco’s modified Eagle’s medium/Ham’s F-12 50/50 medium supplemented with 5% horse serum (Life technologies), 0.5 g/mL
hydrocortisone, 10 g/mL insulin, 20 ng/mL epidermal growth factor (Sigma), 0.1 g/mL cholera enterotoxin (Wanbang), 100 units/mL penicillin, 100μg/mL streptomycin and 2 mM L-glutamine. Cells were maintained in a humidified atmosphere with 5% CO2at 37°C.
Transfection treatments
The most frequently used expression vector pcDNA 3.1/myc-His(-) (Life technologies) was used as a control vector. One day prior to transfection, each cell line was placed in 6-well plates to a confluency of 70–90%, and then was transfected or was not transfected with vector using Lipofectamine 2000 Reagent (Life technologies) or X-tremeGENE HP DNA Transfection Reagent (Roche). Plasmid quantities and transfection reagents were 2.5μg and 7.5μL for Lipofectamine 2000 reagent, or 2μg and 4μL for X-tremeGENE HP DNA transfection reagent, respectively. After incubation for 48 h, cells were lysed by adding TRIzol LS Reagent (Invitrogen) directly. These experiments were performed in duplicate.
RNA extraction and cDNA synthesis
Total RNA extraction including DNase treatment with RNase-free DNase I set (TianGen) was carried out using the RNeasy Mini Kit (Qiagen) according to the manufacturer’s instructions. Extracted RNAs were quantified by NanoDrop 2000 Spectrophotometer (Thermo Fisher Sci-entific), and the absorbance ratio at 260/280 and 260/230 were measured to assure RNA purity. RNA samples were then assessed with an RNA 6000 Nano kit (Agilent Technologies) using the Agilent 2100 electrophoresis Bioanalyzer (Agilent Technologies) to obtain an RNA integrity number (RIN). A threshold RIN value of 7 was applied, below which samples were excluded from analysis.
Total RNA (2μg) was reverse-transcribed using the PrimeScript RT reagent Kit (Takara Biotechnology) in a total volume of 40μL according to the manufacturer’s instructions. The RT primer Mix contained both oligo dT and random primers to obtain a maximum number of cDNA transcripts.
Quantitative polymerase chain reaction (qPCR)
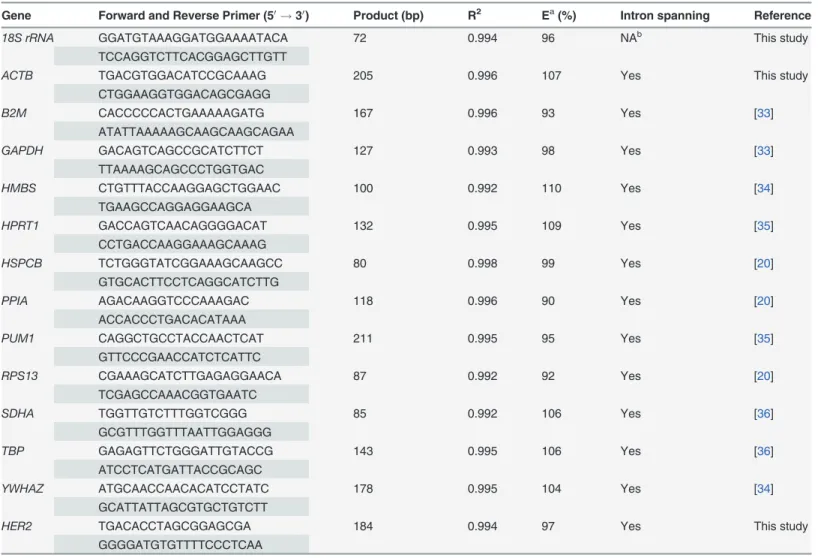
qPCR was performed on 13 putative reference genes and one target gene ofHER2. Their
char-acteristics are summarized inTable 3. Primer pair sequences were selected from the literature or were designed using primer Express 3.0 software. Each primer set was confirmed to be spe-cific to its targeting gene with no homology to other sequences at UCSC’s human genome browser (http://genome.ucsc.edu). PCR products were further cloned into PMD18-T vector (Takara Biotechnology) and sequenced for verification using an ABI PRISM 3730 DNA se-quencer according to the manufacturer’s recommendations (Applied Biosystems).
spanned seven orders of each gene cDNA from the HCC1806 cell line. The reaction efficiency (E) of each gene was calculated according to the formula E = [10(−1/slope)-1].
Data analysis
Candidate reference gene stability was evaluated using a web-based comprehensive tool RefFinder (http://www.leonxie.com/referencegene.php), which includes the four most monly used approaches such as geNorm [7], NormFinder [9], BestKeeper [10] and the com-parative delta Ct [11]. First, geNorm calculates M for each candidate gene based on pairwise comparisons of variable. Genes with smaller M are usually associated with high expression sta-bility. GeNorm also calculates the optimal number of reference genes for gene expression anal-ysis [7]. 2) NormFinder estimates the overall variation of gene expression for each candidate gene and delivers a stability value, not only identifying the most stable reference genes but also the best overall control gene [9]. 3) BestKeeper uses pair-wise correlations [10]; and 4) the comparative delta Ct method ranks reference gene stability according to reproducibility of
Table 3. Primers for 13 reference genes and a target gene.
Gene Forward and Reverse Primer (50!30) Product (bp) R2 Ea(%) Intron spanning Reference
18S rRNA GGATGTAAAGGATGGAAAATACA 72 0.994 96 NAb This study
TCCAGGTCTTCACGGAGCTTGTT
ACTB TGACGTGGACATCCGCAAAG 205 0.996 107 Yes This study
CTGGAAGGTGGACAGCGAGG
B2M CACCCCCACTGAAAAAGATG 167 0.996 93 Yes [33]
ATATTAAAAAGCAAGCAAGCAGAA
GAPDH GACAGTCAGCCGCATCTTCT 127 0.993 98 Yes [33]
TTAAAAGCAGCCCTGGTGAC
HMBS CTGTTTACCAAGGAGCTGGAAC 100 0.992 110 Yes [34]
TGAAGCCAGGAGGAAGCA
HPRT1 GACCAGTCAACAGGGGACAT 132 0.995 109 Yes [35]
CCTGACCAAGGAAAGCAAAG
HSPCB TCTGGGTATCGGAAAGCAAGCC 80 0.998 99 Yes [20]
GTGCACTTCCTCAGGCATCTTG
PPIA AGACAAGGTCCCAAAGAC 118 0.996 90 Yes [20]
ACCACCCTGACACATAAA
PUM1 CAGGCTGCCTACCAACTCAT 211 0.995 95 Yes [35]
GTTCCCGAACCATCTCATTC
RPS13 CGAAAGCATCTTGAGAGGAACA 87 0.992 92 Yes [20]
TCGAGCCAAACGGTGAATC
SDHA TGGTTGTCTTTGGTCGGG 85 0.992 106 Yes [36]
GCGTTTGGTTTAATTGGAGGG
TBP GAGAGTTCTGGGATTGTACCG 143 0.995 106 Yes [36]
ATCCTCATGATTACCGCAGC
YWHAZ ATGCAACCAACACATCCTATC 178 0.995 104 Yes [34]
GCATTATTAGCGTGCTGTCTT
HER2 TGACACCTAGCGGAGCGA 184 0.994 97 Yes This study
GGGGATGTGTTTTCCCTCAA
aEf
ficiency value.
bNot available.
gene expression differences [11]. Based on the ranks observed from each program, RefFinder assigns an appropriate weight to an individual gene and calculated the geometric mean of their weights for the overall final ranking. Comparisons of means were carried out using a Student’s test with the SPSS 22.0 software (IBM).
Literature review
A PubMed database (http://www.ncbi.nlm.nih.gov/pubmed/) review was performed using the key words:‘reference genes’OR‘housekeeping genes’AND‘qPCR’OR‘quantitative PCR’
AND‘breast cancer cell’between January 2000 and June 2014.
Results
Quality and integrity of RNA samples
To assure sample quality and integrity, RNA was extracted from fresh cells and treated with DNaseI to avoid amplification from residual genomic DNA. Absorbance ratios 260/280 nm and 260/230 nm, averaged (mean ± standard deviation) over all 10 cell lines, were 2.065±0.052 and 2.075±0.114, respectively (S1 Table). Moreover, the RIN ranged from 8.8–10 (S1 Table). These data indicated that our samples were of sufficient total RNA quality and integrity.
Amplification specificity and primer optimization
Primers for 13 reference genes and one target gene were highly specific, yielding single bands when the PCR products were separated on an agarose gel, and single peaks in dissociation curves of qPCR reactions (data not shown). Gene-specific amplifications were further con-firmed by sequencing analysis. Obtained reference genes and target gene sequencing results were identical to the reference sequences. Thus, each qPCR reaction was specific.
PCR reaction efficiency of each gene was measured with 10-fold serial dilutions of cDNA of each gene (S1 Fig.). Efficiency values (E) and correlation coefficients (R2) for each primer pair are shown inTable 3. For each candidate reference gene, R2was not less 0.992 and E values were 90–110% (inclusive).
Candidate reference gene expression
With RT-qPCR experiments across 10 cell lines with/without transfection treatments, we ob-tained absolute Cq values (based on the nomenclature and MIQE guidelines: the quantification cycle (Cq) is preferred to the threshold cycle (Ct)) for each gene under different conditions). The median, 25thand 75thpercentiles, and range of Cq values for each gene are presented in Fig. 1. The absolute expression of the 13 reference genes were observed spanning from the most abundant (ACTB, mean Cq 14.65) to the least abundant genes (HMBS, mean Cq 21.60),
indicating their moderate abundance in the observed samples. By pair-wise t-test, significant differences in variance were observed between candidates (P<0.001), with genes such as18S rRNAandACTBgenes having less variance than others (B2MandPPIA,Fig. 1). Moreover, the
intra-run coefficient variation (CV) for each candidate reference gene ranged from 1.55% for
18S rRNAto 5.06% forHPRT1with a mean CV for all genes of 3.28%, in which CV was
com-puted using the ratio of SD and the average. In addition, within each transiently transfected cell line, the change of Cq for reference genes spanned from 0.00142 forGAPDHuntreated and
treated with X-tremeGENE HP transfection reagent to 1.029 forB2Muntreated and treated
with Lipofectamine 2000. The data suggest thatACTBexpression was considerably stable, and
Identification of optimal reference genes
To identify the most stable reference genes in tested breast normal and cancer cell lines, we used four analyses: geNorm, NormFinder, BestKeeper and comparative delta Ct. Genes with a lower stability value or an average STDEV are usually associated with high expression stability. In addition, the RefFinder program provides the recommended comprehensive ranking by cal-culating geometric means from ranking orders analyzed by the four algorithms.Table 4shows that both comparative delta Ct and NormFinder suggested thatACTBand18S rRNAwere the Figure 1. Box plot of absolute Cq values for each reference gene.Expression of selected reference genes in 10 human breast cells, which were not treated (Parental), or were transiently transfected with X-tremeGENE HP DNA transfection reagent (+HP) or with Lipofectamine 2000 transfection reagent (+Lipofectamine) as well as with plasmid displayed as Cq. The median is indicated by a line in each box, which in turn represents the 25thand 75thpercentile.
Whiskers indicate the 10/90 percentile ranges, circles represent potential outliers.
doi:10.1371/journal.pone.0117058.g001
Table 4. Stability ranking of 13 reference genes analyzed byfive algorithms across all cell lines.
Delta Ct BestKeeper NormFinder geNorm RefFinder
Gene in ranking order
Average of STDEV
Gene in ranking order
Average of STDEV
Gene in ranking order
Stability value
Gene in ranking order
Stability value
Gene in ranking order
Geomean of ranking values
ACTB 0.53 18S rRNA 0.10 ACTB 0.056 18S rRNA 0.267 18S rRNA 1.41
18S rRNA 0.59 PUM1 0.22 18S rRNA 0.301 PUM1 0.267 ACTB 1.73
YWHAZ 0.61 ACTB 0.23 YWHAZ 0.312 ACTB 0.336 PUM1 2.51
PUM1 0.61 RPS13 0.24 GAPDH 0.347 GAPDH 0.368 GAPDH 4.47
GAPDH 0.62 GAPDH 0.28 PUM1 0.350 RPS13 0.391 YWHAZ 4.88
HSPCB 0.63 SDHA 0.45 HSPCB 0.360 HSPCB 0.450 RPS13 5.60
RPS13 0.69 HSPCB 0.48 RPS13 0.483 YWHAZ 0.478 HSPCB 6.24
TBP 0.71 TBP 0.48 TBP 0.501 TBP 0.509 TBP 8.00
SDHA 0.76 YWHAZ 0.50 SDHA 0.567 SDHA 0.544 SDHA 8.13
HMBS 0.79 PPIA 0.54 HMBS 0.618 HMBS 0.582 HMBS 10.24
PPIA 0.88 HMBS 0.59 PPIA 0.739 PPIA 0.622 PPIA 10.74
B2M 0.95 B2M 0.61 B2M 0.830 B2M 0.673 B2M 12.00
HPRT1 0.98 HPRT1 0.79 HPRT1 0.863 HPRT1 0.719 HPRT1 13.00
two most stable reference genes, and geNorm and BestKeeper identified18S rRNAandPUM1
as the best reference genes across the 10 cell lines studied. Consequently,18S rRNA, ACTBand PUM1were identified to be the 3 most stably expressed reference genes by RefFinder. All tools
rankedHPRT1as the least suitable reference gene across all cell lines. Next, we evaluated the
stability of reference genes for basal (HCC1806, SUM149PT, HCC1937 and MDA-MB-231) and ER+breast cancer cell lines (MCF-7, T47D, HCC1500 and BT474).ACTBandGAPDH
were the two most stable reference genes in basal breast cancer cells, andHSPCBandACTB
were best in ER+breast cancer cell lines (Table 5). Interestingly,HSPCBwas not a stable
refer-ence gene in basal breast cancer cells (ranking 10) or across all 10 cell lines (ranking 7), whereas it was the most stable reference gene in ER+breast cancer cells (Table 5) indicating that the sta-bility of the reference gene depends on the cell lines.
Transfection treatment effects on reference gene stability
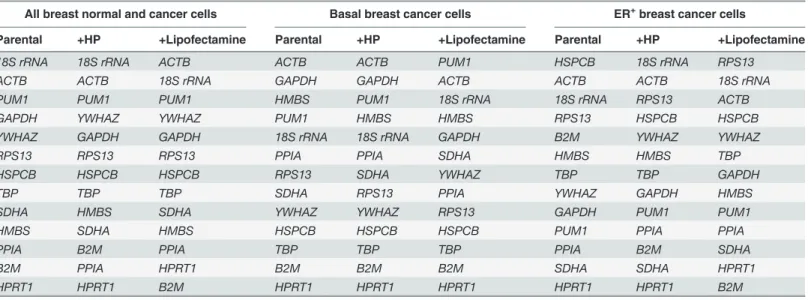
A suitable reference gene should not vary in expression between cells with and without treat-ments. Thus, we studied gene expression in the presence of Lipofectamine 2000 or HP transfec-tion reagents in human breast cell lines. Reference gene stability was ranked by RefFinder (Table 5) and data indicate that stability ranking did not substantially change with/without transfection across all cell lines. The 3 most stable genes were18S rRNA, ACTBandPUM1,
and the 3 least stable genes werePPIA, B2MandHPRT1. However, after transfection
treat-ments reference gene stability fluctuated in basal and ER+breast cell lines. Stability rankings of
HSPCBchanged from the 1stposition without treatment to the 4thposition with treatments in
ER+breast cancer cells. ForGAPDH, similar findings were noted in basal breast cancer cells.
Optimal reference gene numbers
To determine the optimal number of genes required for geometric mean normalization, geNorm was used to calculate the pairwise variation (Vn/Vn+1) between sequential normalization factors
(NF) (NFn/NFn+1). A recommended threshold of 0.15 for the pairwise variation [7] was adopted Table 5. Ranking of reference genes in order of stability treated with or without transfection.
All breast normal and cancer cells Basal breast cancer cells ER+breast cancer cells
Parental +HP +Lipofectamine Parental +HP +Lipofectamine Parental +HP +Lipofectamine
18S rRNA 18S rRNA ACTB ACTB ACTB PUM1 HSPCB 18S rRNA RPS13
ACTB ACTB 18S rRNA GAPDH GAPDH ACTB ACTB ACTB 18S rRNA
PUM1 PUM1 PUM1 HMBS PUM1 18S rRNA 18S rRNA RPS13 ACTB
GAPDH YWHAZ YWHAZ PUM1 HMBS HMBS RPS13 HSPCB HSPCB
YWHAZ GAPDH GAPDH 18S rRNA 18S rRNA GAPDH B2M YWHAZ YWHAZ
RPS13 RPS13 RPS13 PPIA PPIA SDHA HMBS HMBS TBP
HSPCB HSPCB HSPCB RPS13 SDHA YWHAZ TBP TBP GAPDH
TBP TBP TBP SDHA RPS13 PPIA YWHAZ GAPDH HMBS
SDHA HMBS SDHA YWHAZ YWHAZ RPS13 GAPDH PUM1 PUM1
HMBS SDHA HMBS HSPCB HSPCB HSPCB PUM1 PPIA PPIA
PPIA B2M PPIA TBP TBP TBP PPIA B2M SDHA
B2M PPIA HPRT1 B2M B2M B2M SDHA SDHA HPRT1
HPRT1 HPRT1 B2M HPRT1 HPRT1 HPRT1 HPRT1 HPRT1 B2M
Cells were not treated (Parental), or were transiently transfected with X-tremeGENE HP DNA transfection reagent (+HP) or with Lipofectamine 2000 transfection reagent (+Lipofectamine) as well as with plasmid.
as a cut-off for reference gene inclusion. Data indicate that a value of V2/3fell below the threshold
of 0.15 in basal breast cancer cell lines (Fig. 2A), ER+breast cancer cell lines (Fig. 2B), and across all breast cancer cell lines (Fig. 2C), regardless of transfection treatments. Therefore, the use of two reference genes should be sufficient in this study. For normalization of cells without transfec-tion treatments,18S rRNAandACTBwould be appropriate across all cells, andGAPDHand ACTBwould be appropriate in basal breast cancer cells.HSPCBandACTBwould be best in ER+
breast cancer cells (Table 5). For data normalization of cells with transfection treatments,18S rRNAandACTBshould be used as valid reference genes across all cell lines (S2 Table).
Effect of reference gene normalization on HER2 expression
To measure the effect of reference gene normalization on gene expression data, we selected humanHER2as a target gene.HER2is a member of the epidermal growth factor family, and is
present in approximately 20–30% of breast cancer tumors. Importantly,HER2expression is
as-sociated with breast cancer pathophysiology and therapy [22]. As shown inFig. 3, relative ex-pression ofHER2was calculated with 5 individual reference genes and the combination of two
suitable reference genes using the 2−∆∆Ctmethod. As predicted, a significant overexpression of
HER2was present in HER2+subtype cell lines, such as BT474 and SKBR3.HER2expression
normalized by18S rRNAorACTBas single reference gene and by the18S rRNA-ACTB
combi-nation was the optimal combicombi-nation across all breast cell lines, and had similar high-low pat-terns (Fig. 3A-C). Normalization using the least stable reference genesB2MorHPRT1yielded
unusual expressional patterns (Fig. 3D and E). In comparison,HER2expression reduced
ex-pression byHPRT1in HCC1937, MCF7 and HCC1500 cells (Fig. 3E) and byB2Min
HCC1806 and SKBR3 cells (Fig. 3D). Additionally, stability ofGAPDH, the most used
refer-ence gene, ranked 4thacross all breast cells in this study (Table 4). When normalization with
GAPDH, relativeHER2expression yielded contrasting expressional patterns for BT474 and
SKBR3 cells (Fig. 3F) compared data inFig. 3A. These results indicate that relative expression ofHER2could be interpreted in different ways depending on the reference genes used
for normalization.
Discussion
Analysis of gene expression involved in cancer tumorigenesis and metastasis is key to tailoring individual treatments and RT-qPCR can assist with this. In RT-qPCR analysis, the RNA integ-rity is a critical first step in obtaining meaningful gene expression data, because an exhaustive analysis of the influence of RNA integrity offers different conclusions[23]. The RIN value is a useful tool for RNA integrity assessment. In general, a RIN value higher than 5 was considered to be good total RNA quality and higher than 8 as“perfect”total RNA for downstream applica-tion [23]. In this study, all RIN values exceeded 8.8, indicating that our total RNA samples were of sufficient quality. Secondly, primer selection is important [24], so we used previously reported primer pairs or designed primer sets to amplify an amplicon of 70–250 bp. Amplifica-tion is“independent”of RNA quality during the amplicon range [25]. Lastly, all primer pairs spanned neighboring exons except for the18S rRNAgene which is not an mRNA and this
con-tributed to amplification efficiency and gave E values and R2of studied reference and target genes ranging as depicted inTable 3.
We then selected 13 reference genes from the literature. Ten (18S rRNA, ACTB, B2M,
HPRT1, HSPCB, PPIA, PUM1, RPS13, SDHAandTBP), were reported to be the most stable
below the default limit of M = 1.5 [7]. To identify the most suitable reference genes across 10 breast cell lines, expression stabilities of candidates were calculated using the four most fre-quently used algorithms. Inconsistent results were observed with these methods due the unique strategy of each technique to assess gene stability (Table 4,S2 Table). Therefore, we calculated the geomean of ranking values from the four methods and obtained a comprehensive ranking using RefFinder tool. Data show that18S rRNAandACTBwere the most stable reference
genes across all investigated cell lines, regardless of transfection treatments (Table 4,S2 Table) and the literature supported this finding.ACTBwas verified as one of the best combination
genes for breast tumor and normal tissues [15,16]. Both18S rRNAandACTBhave been
sug-gested to be suitable for normalization among a set of human breast cancer cell lines of increas-ing metastatic potential, but limitations do exist [18]. In contrast,HPRT1was identified as the
least stable reference gene by all algorithms (Table 4), but it was reported as the single best ref-erence gene in 80 normal and tumor samples [17]. An explanation for this may be that differ-ent sample resources between breast cell lines in our study and tissue samples used by others (colorectal, breast, prostate, skin and bladder tumor in work by de Kok’s group) [17].
GAPDHhas been widely used as a reference gene in RT-qPCR analysis. However,GAPDH
is reported to be involved in biological processes [26] andGAPDHexpression is substantially
increased in human cancers from the cervix, prostate, pancreas and lung [27–30], and in MCF7 cells treated with oestradiol [31]. Therefore,GAPDHhas not been suggested to be a
con-trol RNA to study breast cancer [12,16,17,31]. We observed thatGAPDHwas not the most
sta-ble reference gene in our experiments as well (Tasta-ble 4). Even so,GAPDHcontinues to be
utilized as a normalizer in breast cancer and cell line studies with RT-qPCR. When a PubMed database review was performed, almost half of the publications indicated thatGAPDHwas
used a single reference gene for normalization in gene expression analyses with qPCR technol-ogy. Particular attention should be paid to the selection ofGAPDHas a reference gene in
future studies.
To illustrate typical errors of data interpretation, we normalized the relative expression of
HER2using different reference genes.Fig. 3shows that there was a tendency forHER2
expres-sion to change depending on the reference gene.HER2expression normalized with the best
single reference gene (18S rRNAorACTB) or a combination of these indicated stable
expres-sion patterns across all cell lines (Fig. 3A-C). However, when normalizing to a gene (GAPDH,
B2MorHPRT1) with unstable expression, the relative amount of target gene expression
calcu-lation caused erroneous conclusions (Fig. 3D-F).HER2expression normalized by the worst
genes—B2MandHPRT1—was substantially increased in all investigated cells. Similarly,
War-rington and coauthors verified that expression of genes normalized by frequently used refer-ence genes could vary by 7- to 23-fold, depending on the cell type or tissue [32].
To assess the stabilities of reference genes affected by transfection, we performed negative control transfection using Lipofectamine 2000 or X-tremeGENE HP DNA transfection reagent and the expression vector. Data show that candidate stabilities were not influenced across all tested cells, but fluctuated significantly in ER+breast cancer cells after transfection treatments (Table 5). Of note, Lipofectamine 2000 transfection reagent had the greatest effect on reference gene stability compared to X-tremeGENE HP DNA transfection reagent both in basal and ER+ cell lines (Table 5). Similar reports suggest that many transcripts were changed in the presence of Lipofectamine 2000, regardless of the presence/absence of the gene of interest [19]. This
Figure 2. Determination of the optimal number of reference genes for normalization.Pair-wise variation value (Vn/n+1) was generated by geNorm analysis from basal breast cancer cell lines (A), ER+breast cancer cell lines (B), and all 10 breast cell lines (C). The dash line indicates the cut-off value of
0.15.
supports the suggestion that selecting the best transfection reagent along with the appropriate vector is necessary to ensure that most observed responses are biological effects of the target gene and not based on a particular transfection process used [19].
Conclusions
To the best of our knowledge this is the first systematic identification of reference genes for qPCR studies in human breast cancer cell lines containing different cancer subtypes treated with transient transfection. We have validated two genes,18S rRNAandACTBas control
genes for RT-qPCR analysis of human breast cancer cell lines containing different subtypes using 4 different mathematical approaches. After transient transfection, reference genes can vary with the subtype of cell lines and therefore identifying the most stable and suitable refer-ence genes is critical for studying specific cell lines under certain circumstances.
Supporting Information
S1 Fig. Standard curve for all primer pairs. (PDF)
S1 Table. Quantity and integrity of total RNA. (PDF)
S2 Table. Ranking reference genes based on the all five algorithms.Cells were not treated (Parental), or were transiently transfected with X-tremeGENE HP DNA transfection reagent (+HP) or with Lipofectamine 2000 transfection reagent (+Lipofectamine).
(XLS)
Author Contributions
Conceived and designed the experiments: HZ YPZ. Performed the experiments: LLL HZ TFM FG. Analyzed the data: LLL HZ TFM. Contributed reagents/materials/analysis tools: CSC YPZ. Wrote the paper: LLL HZ CSC YPZ. Obtained permission for use of cell line: FG CSC.
References
1. Feuer EJ, Wun LM, Boring CC, Flanders WD, Timmel MJ, et al. (1993) The lifetime risk of developing breast cancer. J Natl Cancer Inst 85: 892–897. PMID:8492317
2. Holliday DL, Speirs V (2011) Choosing the right cell line for breast cancer research. Breast Cancer Res 13: 215. doi:10.1186/bcr2889PMID:21884641
3. Sørlie T, Perou CM, Tibshirani R, Aas T, Geisler S, et al. (2001) Gene expression patterns of breast car-cinomas distinguish tumor subclasses with clinical implications. Proc Natl Acad Sci U S A 98: 10869– 10874. PMID:11553815
4. Reis-Filho JS, Pusztai L (2011) Gene expression profiling in breast cancer: classification, prognostica-tion, and prediction. Lancet 378:1812–1823. PMID:22098854
5. Bustin SA (2000) Absolute quantification of mRNA using real-time reverse transcription polymerase chain reaction assays. J Mol Endocrinol 25: 169–193. PMID:11013345
6. Ginzinger DG (2002) Gene quantification using real-time quantitative PCR: an emerging technology hits the mainstream. Exp Hematol 30: 503–512. PMID:12063017
Figure 3. Relative quantification ofHER2expression depends on different reference genes.Relative expression ofHER2across all cell lines was normalized by the best combination (18S rRNA-ACTB) (A), by the most stable single gene18S rRNA(B) orACTB(C), by the least stable single geneB2M
(D) orHPRT1(E), and by the most used but not recommended geneGAPDH(F).
7. Vandesompele J, De Preter K, Pattyn F, Poppe B, Van Roy N, et al. (2002) Accurate normalization of real-time quantitative RT-PCR data by geometric averaging of multiple internal control genes. Genome Biol 3: RESEARCH0034. PMID:12184808
8. Rho HW, Lee BC, Choi ES, Choi IJ, Lee YS, et al. (2010) Identification of valid reference genes for gene expression studies of human stomach cancer by reverse transcription-qPCR. BMC Cancer 10: 240. doi:10.1186/1471-2407-10-240PMID:20507635
9. Andersen CL, Jensen JL,Ørntoft TF (2004) Normalization of real-time quantitative reverse transcrip-tion-PCR data: a model-based variance estimation approach to identify genes suited for normalization, applied to bladder and colon cancer data sets. Cancer Res 64: 5245–5250. PMID:15289330
10. Pfaffl MW, Tichopad A, Prgomet C, Neuvians TP (2004) Determination of stable housekeeping genes, differentially regulated target genes and sample integrity: BestKeeper—Excel-based tool using pair-wise correlations. Biotechnol Lett 26: 509–515. PMID:15127793
11. Silver N, Best S, Jiang J, Thein SL (2006) Selection of housekeeping genes for gene expression stud-ies in human reticulocytes using real-time PCR. BMC Mol Biol 7: 33. PMID:17026756
12. McNeill RE, Miller N, Kerin MJ (2007) Evaluation and validation of candidate endogenous control genes for real-time quantitative PCR studies of breast cancer. BMC Mol Biol 8: 107. PMID:18042273
13. Lyng MB, Laenkholm AV, Pallisgaard N, Ditzel HJ (2008) Identification of genes for normalization of real-time RT-PCR data in breast carcinomas. BMC Cancer 8: 20. doi:10.1186/1471-2407-8-20PMID:
18211679
14. Kilic Y, Celebiler AC, SakızlıM (2014) Selecting housekeeping genes as references for the
normaliza-tion of quantitative PCR data in breast cancer. Clin Transl Oncol 16: 184–190. doi: 10.1007/s12094-013-1058-5PMID:23720140
15. Majidzadeh-A K, Esmaeili R, Abdoli N (2011) TFRC and ACTB as the best reference genes to quantify Urokinase Plasminogen Activator in breast cancer. BMC Res Notes 4: 215. doi: 10.1186/1756-0500-4-215PMID:21702980
16. Gur-Dedeoglu B, Konu O, Bozkurt B, Ergul G, Seckin S, et al. (2009) Identification of endogenous refer-ence genes for qRT-PCR analysis in normal matched breast tumor tissues. Oncol Res 17: 353–365. PMID:19544972
17. De Kok JB, Roelofs RW, Giesendorf BA, Pennings JL, Waas ET, et al. (2005) Normalization of gene ex-pression measurements in tumor tissues: comparison of 13 endogenous control genes. Lab Invest 85: 154–159. PMID:15543203
18. Morse DL, Carroll D, Weberg L, Borgstrom MC, Ranger-Moore J, et al. (2005) Determining suitable in-ternal standards for mRNA quantification of increasing cancer progression in human breast cells by real-time reverse transcriptase polymerase chain reaction. Anal Biochem 342: 69–77. PMID:
15958182
19. Jacobsen L, Calvin S, Lobenhofer E (2009) Transcriptional effects of transfection: the potential for mis-interpretation of gene expression data generated from transiently transfected cells. Biotechniques 47: 617–624. doi:10.2144/000113132PMID:19594446
20. Jacob F, Guertler R, Naim S, Nixdorf S, Fedier A, et al. (2013) Careful selection of reference genes is required for reliable performance of RT-qPCR in human normal and cancer cell lines. PLoS One 8: e59180. doi:10.1371/journal.pone.0059180PMID:23554992
21. Kheirelseid EA, Chang KH, Newell J, Kerin MJ, Miller N (2010) Identification of endogenous control genes for normalisation of real-time quantitative PCR data in colorectal cancer. BMC Mol Biol 11: 12. doi:10.1186/1471-2199-11-12PMID:20122155
22. Mitri Z, Constantine T, O’Regan R (2012) The HER2 Receptor in Breast Cancer: Pathophysiology, Clin-ical Use, and New Advances in Therapy. Chemother Res Pract 2012: 743193. doi:10.1155/2012/ 743193PMID:23320171
23. Fleige S, Pfaffl MW (2006) RNA integrity and the effect on the real-time qRT-PCR performance. Mol As-pects Med 27: 126–139. PMID:16469371
24. Derveaux S, Vandesompele J, Hellemans J (2010) How to do successful gene expression analysis using real-time PCR. Methods 50: 227–230.
25. Fleige S, Walf V, Huch S, Prgomet C, Sehm J, et al. (2006) Comparison of relative mRNA quantification models and the impact of RNA integrity in quantitative real-time RT-PCR. Biotechnol Lett 28: 1601– 1613. PMID:16900335
26. Sirover MA (1997) Role of the glycolytic protein, glyceraldehyde-3-phosphate dehydrogenase, in nor-mal cell function and in cell pathology. J Cell Biochem 66: 133–140. PMID:9213215
28. Rondinelli RHEDE, Tricoli JV (1997) Increased glyceraldehyde-3-phosphate dehydrogenase gene ex-pression in late pathological stage human prostate cancer. Prostate Cancer Prostatic Dis 1: 66–72. PMID:12496918
29. Schek NHBL, Finn OJ (1988) Increased glyceraldehyde-3-phosphate dehydrogenase gene expression in human pancreatic adenocarcinoma. Cancer Res 48: 6354–6359. PMID:3180054
30. Tokunaga K, Nakamura Y, Sakata K, Fujimori K, Ohkubo M, et al. (1987) Enhanced expression of a glyceraldehyde-3-phosphate dehydrogenase gene in human lung cancers. Cancer Res 47: 5616– 5619. PMID:3664468
31. Révillion F, Pawlowski V, Hornez L, Peyrat JP (2000) Glyceraldehyde-3-phosphate dehydrogenase gene expression in human breast cancer. Eur J Cancer 36: 1038–1042.
32. Warrington JA, Nair A, Mahadevappa M, Tsyganskaya M (2000) Comparison of human adult and fetal expression and identification of 535 housekeeping/maintenance genes. Physiol Genomics 2: 143– 147. PMID:11015593
33. Shen Y, Li Y, Ye F, Wang F, Lu W, et al. (2010) Identification of suitable reference genes for measure-ment of gene expression in human cervical tissues. Anal Biochem 405: 224–229. doi:10.1016/j.ab. 2010.06.029PMID:20599650
34. De Spiegelaere W, Erkens T, De Craene J, Burvenich C, Peelman L, et al. (2008) Elimination of amplifi-cation artifacts in real-time reverse transcription PCR using laser capture microdissected samples. Anal Biochem 382: 72–74. doi:10.1016/j.ab.2008.07.004PMID:18652799
35. Li YL, Ye F, Hu Y, Lu WG, Xie X (2009) Identification of suitable reference genes for gene expression studies of human serous ovarian cancer by real-time polymerase chain reaction. Anal Biochem 394: 110–116. doi:10.1016/j.ab.2009.07.022PMID:19622337