Submitted10 November 2015 Accepted 23 August 2016 Published4 October 2016
Corresponding author Richard L. Pyle,
deepreef@bishopmuseum.org
Academic editor Xavier Pochon
Additional Information and Declarations can be found on page 33
DOI10.7717/peerj.2475
Copyright 2016 Pyle et al.
Distributed under
Creative Commons CC-BY 4.0
OPEN ACCESS
A comprehensive investigation of
mesophotic coral ecosystems in the
Hawaiian Archipelago
Richard L. Pyle1, Raymond Boland2,3, Holly Bolick1, Brian W. Bowen4,
Christina J. Bradley5,6, Corinne Kane7, Randall K. Kosaki8, Ross Langston1,
Ken Longenecker1, Anthony Montgomery4,9, Frank A. Parrish2, Brian N. Popp10,
John Rooney11,†, Celia M. Smith12, Daniel Wagner8and Heather L. Spalding12
1Natural Sciences, Bernice Pauahi Bishop Museum, Honolulu, HI, United States
2Pacific Islands Fisheries Science Center, National Oceanographic and Atmospheric Administration, Honolulu,
HI, United States
3Hawai‘i Pacific University, Honolulu, HI, United States
4Hawai‘i Institute of Marine Biology, University of Hawai‘i at Manoa, Honolulu, HI, United States 5Life and Environmental Sciences, University of California at Merced, Merced, CA, United States 6Department of Oceanography, University of Hawai‘i at Manoa, Honolulu, HI, United States
7Environmental and Natural Resource Sciences, Washington State University, Pullman, WA, United States 8Papah¯anaumoku¯akea Marine National Monument, National Oceanic and Atmospheric Administration,
Honolulu, HI, United States
9Pacific Islands Fish and Wildlife Office, U.S. Fish and Wildlife Service, Honolulu, HI, United States 10Department of Geology and Geophysics, University of Hawai‘i at Manoa, Honolulu, HI, United States 11Joint Institute for Marine and Atmospheric Research, University of Hawai‘i at Manoa, Honolulu, HI,
United States
12Department of Botany, University of Hawai‘i at Manoa, Honolulu, HI, United States †Deceased.
ABSTRACT
connectivity establish the potential for MCEs to serve as refugia for some species, but our results question the premise that MCEs are more resilient than shallow reefs. We found that endemism within MCEs increases with depth, and our results do not support suggestions of a global faunal break at 60 m. Our findings enhance the scientific foundations for conservation and management of MCEs, and provide a template for future interdisciplinary research on MCEs worldwide.
SubjectsAquaculture, Fisheries and Fish Science, Biodiversity, Conservation Biology, Ecology, Marine Biology
Keywords Mesophotic coral ecosystems, Hawaiian Archipelago, Endemism, Refugia, Closed-circuit rebreathers, Amino acid isotopic composition
INTRODUCTION
Most coral-reef monitoring programs are designed to target shallow reefs
(Jokiel et al., 2001;Brown et al., 2004;Preskitt, Vroom & Smith, 2004;Kenyon et al., 2006). In recent years, there has been a greater effort to document coral-reef ecosystems at depths of 30 to over 150 m, now referred to as ‘‘Mesophotic Coral Ecosystems’’ (MCEs) (Hinderstein et al., 2010;Baker, Puglise & Harris, 2016). These research efforts have primar-ily focused on aspects of MCEs that are relevant to management policies, such as their dis-tribution, ecology and biodiversity, as MCEs have been identified as a conservation priority (Blyth-Skyrme et al., 2013;Sadovy de Mitcheson et al., 2013). However, despite the growing body of research targeting MCEs, they are often not included in reef assessment and monitoring programs, management-related reports on the status and health of coral reefs (Brainard et al., 2003), or general overviews of coral-reef science (Trenhaile, 1997). Most studies of coral-reef development (and the models derived from them) (Dollar, 1982; Grigg, 1998;Braithwaite et al., 2000;Rooney et al., 2004) and coral-reef ecology (Luckhurst & Luckhurst, 1978;Friedlander & Parrish, 1998;Friedlander & DeMartini, 2002;Friedlander et al., 2003) do not include MCEs. Indeed, most of our understanding of coral-reef ecosystems is biased by the preponderance of data from depths less than 30 m, which represents less than one-fifth of the total depth range of the tropical coral-reef environment (Pyle, 1996b;Pyle, 1999a). An understanding of MCEs is essential to successfully characterize the health of coral reefs in general, and to formulate effective management plans in the face of increasing anthropogenic stress.
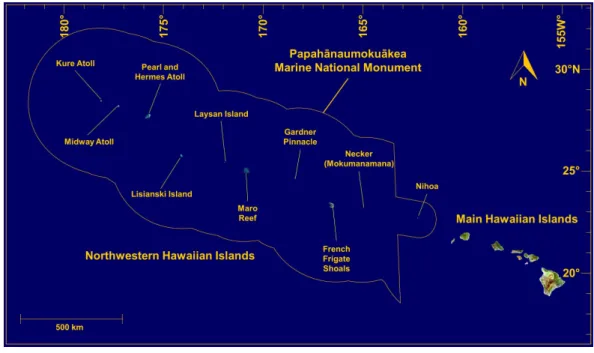
Coral-reef environments within the Hawaiian Archipelago have been extensively studied and documented for decades (Maragos, 1977;Chave & Malahoff, 1998; Hoover, 1998; Mundy, 2005;Randall, 2007;Fletcher et al., 2008;Grigg et al., 2008;Jokiel, 2008;Rooney et al., 2008;Toonen et al., 2011;Selkoe et al., 2016). These islands and reefs stretch over 2,500 km across the north-central tropical Pacific Ocean, and consist of the eight Main Hawaiian Islands (MHI) in the southeast, and a linear array of uninhabited rocky islets, atolls, reefs, and seamounts comprising the Northwestern Hawaiian Islands (NWHI) (Fig. 1). Many Hawaiian reefs are protected by local, state and federal laws, with a wide range of management and conservation efforts already in place. In particular, the NWHI fall within the Papah¯anaumoku¯akea Marine National Monument, a federally protected area larger than all U.S. National Parks combined (>360,000 km2), which is listed as a World Heritage site and includes about 10% of coral-reef habitats within U.S. territorial waters (Rohmann et al., 2005).
Figure 1 Map of the Hawaiian Archipelago.Source Imagery: Landsat.
(with MCEs representing only a small portion of the study). Beginning in the late 1980s, the advent of ‘‘technical’’ mixed-gas diving opened up new opportunities for exploration of MCEs in Hawai‘i and elsewhere (Pyle, 1996a;Pyle, 1999b;Pyle, 2000;Grigg et al., 2002; Parrish & Pyle, 2002;Pence & Pyle, 2002;Parrish & Boland, 2004;Boland & Parrish, 2005; Grigg, 2006). In 2006, the discovery of extensive MCEs with near-100% coral cover off Maui, coupled with interest in documenting MCEs in the NWHI and a growing infrastructure sup-porting mixed-gas diving operations among Hawaiian research institutions, led to a surge of research in these deep-reef environments and a series of collaborative, multi-disciplinary projects dedicated to improving the understanding of MCEs. These projects include (1) the Deep Coral Reef Ecosystem Studies (Deep-CRES) program focused on the MCEs of the ‘Au‘au Channel off Maui and their relationship to shallower reefs funded by the National Oceanic and Atmospheric Administration’s (NOAA) Center for Sponsored Coastal Ocean Research, (2) two separate studies funded by NOAA’s Coral Reef Conservation Program to study MCEs off Kaua‘i and O‘ahu, and (3) ongoing annual research cruises sponsored by NOAA’s Office of National Marine Sanctuaries to study MCEs within the Papah¯anaumoku¯akea Marine National Monument. These projects, as well as many other smaller surveys over the past two decades, have provided an opportunity for a coordinated effort to explore and document MCEs across the Hawaiian Archipelago.
behind these hypotheses involved characterizations in four general categories: (1) basic geophysical habitat (water clarity, temperature, photosynthetically active radiation [PAR], water movement, nutrient levels, and substrate type), (2) patterns of biodiversity (species composition, relative abundance, and overlap, as well as patterns of endemism), (3) population structure and dynamics (growth rates, impact from anthropogenic and natural disturbance, connectivity, disease levels, age structure, fecundity and production), and (4) broad ecological patterns (trophic dynamics and genetic connectivity). In addition, data from these studies were used extensively to develop a spatial model based on physical parameters and other factors to predict the occurrence of MCEs in Hawai‘i and globally (Costa et al., 2015). Ultimately, our hope is that the insights gained from this research, such as the predicted distribution and abundance of MCEs, the richness and uniqueness of the biodiversity they harbor, and the potential for MCEs to serve as refugia for overexploited biological resources on shallow reefs, will help guide future policy decisions in the conservation and management of marine resources in Hawai‘i and elsewhere.
MATERIALS AND METHODS
As this synthesis represents a broad summary of MCEs in Hawai‘i, based on the results of a multi-year interdisciplinary collaborative effort by many individuals, the methods involved are extensive and diverse. The following represents a summary of methods used throughout this study, particularly as they pertain to data not previously published elsewhere. More detailed descriptions of methods used during this study, including aspects that have been previously published, are included inSupplemental Information 1, and within cited publications. The State of Hawai‘i Department of Land and Natural Resources developed Special Activity Permits for the University of Hawai‘i and National Marine Fisheries Service for work related to this project that occurred within State of Hawai‘i waters. All sampling procedures and experimental manipulations were reviewed as part of obtaining the field permit. All vertebrates (fishes) were collected in accordance with University of Hawai‘i IACUC protocol 09-753-5, ‘‘Phylogeography and Evolution of Reef Fishes’’ (PI: Dr. Brian Bowen), including collection and euthanization by spear.
Study sites
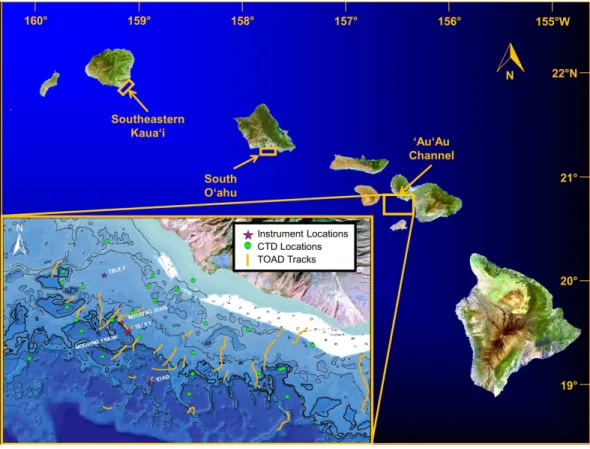
We examined MCEs at multiple sites throughout the Hawaiian Archipelago. The primary MHI study sites were in the ‘Au‘au Channel off Maui, southeast Kaua‘i, and the southern shore of O‘ahu (Fig. 2). Additional qualitative observations of MCEs around the islands of O‘ahu, Kaua‘i, Maui, and Hawai‘i provide complementary insights into general characteristics of MCEs in the MHI. Surveys of MCEs in the NWHI included visits to ten islands and reefs labelled inFig. 1.
Survey effort
Figure 2 Location of study areas.Inset shows remote camera survey (TOAD) track locations, and sites for ‘‘John,’’ ‘‘Frank,’’ and ‘‘Tele 1’’ and ‘‘Tele 2’’ data moorings. MHI imagery from Landsat, USGS.
and theRCV-150 ROV. On several occasions, both submersibles and rebreather divers conducted simultaneous, coordinated field operations (Fig. 3). Mixed-gas dives in the NWHI were conducted from the NOAA ShipHi‘ialakai. Dive sites in the MHI were determined by a variety of factors, including previously known MCE habitat, bathymetry data, and direct site identification by submersible, ROV and TOAD; whereas dive sites in the NWHI targeted steep vertical drop-offs at depths of 50–85 m located using historical charts and new multibeam sonar data collected with theHi‘ialakai.
Geophysical habitat characterization
Figure 3 Research divers place a dome over a set of corals 89 m deep.Research divers Ken Longenecker (left), Dave Pence (center) and Christina Bradley (right) place a dome over a set of corals 89 m deep as part of an experiment to determine coral feeding patterns, while pilot Terry Kerby and science observers Brian Popp and Andrea Grottoli watch on from the HURL submersiblePisces V. Photo: RL Pyle.
Table 1 List of all temperature sensors deployed across Maui and Kaua‘i.
Location Latitude Longitude Depth (m) Deployment
Makaheuna Point, Kaua‘i 21◦51.388N 159◦26.003W 46 13 June 2009 to 12 July 2010
Makaheuna Point, Kaua‘i 21◦51.388N 159◦26.003W 63 13 June 2009 to 12 July 2010
Kipu Kai, Kaua‘i 21◦52.460N 159◦23.028W 57 17 June 2009 to 13 July 2010
Keyhole Pinnacle, Maui 20◦56.437N 156◦45.619W 70 6 April 2009 to 17 January 2010
Keyhole Pinnacle, Maui 20◦56.452N 156◦45.652W 88 6 April 2009 to 17 January 2010
Keyhole Pinnacle, Maui 20◦56.452N 156◦45.652W 102 6 April 2009 to 17 January 2010
Keyhole Pinnacle, Maui 20◦56.454N 156◦45.661W 116 6 April 2009 to 17 January 2010
Keyhole Pinnacle, Maui 20◦56.478N 156◦45.666W 134 6 April 2009 to 17 January 2010
Keyhole Pinnacle, Maui 20◦56.478N 156◦45.666W 160 6 April 2009 to 17 January 2010
Branching Coral Reef, Maui 20◦49.300N 156◦40.377W 58 14 December 2009 to 14 December 2010
Stone Walls, Maui 20◦52.890N 156◦43.794W 34 17 December 2009 to 13 December 2010
Stone Walls, Maui 20◦52.890N 156◦43.794W 34 17 December 2009 to 13 December 2010
Stone Walls, Maui 20◦52.890N 156◦43.794W 42 17 December 2009 to 13 December 2010
Stone Walls, Maui 20◦52.890N 156◦43.794W 46 17 December 2009 to 13 December 2010
Stone Walls, Maui 20◦
52.890N 156◦
Figure 4 Collecting samples using thePiscessubmersible manipulator arm.Photo: HURL.
via a profiling rig (n=6 profiles taken within one hour of noon on 4, 5, and 6 August 2008 and 12, 13, and 14 July 2010 over denseLeptoserisspp. reefs at a maximum depth of 91 m off west Maui); data were stored with a LI-COR LI-1400 datalogger.
Biodiversity patterns
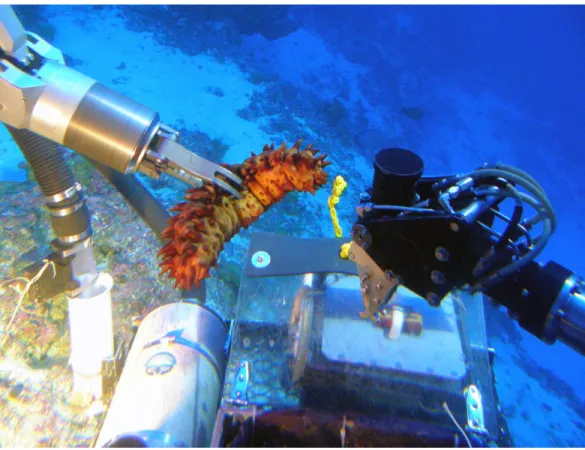
The biodiversity surveys focused primarily on macroalgae, fishes, marine invertebrates, and corals. Surveys were conducted using a variety of visual, video, and collecting techniques. Direct visual observations were made by trained individuals during mixed-gas SCUBA dives and from submersibles. Videotapes were generated by divers, submersibles, ROV, and TOAD camera system. Specimens were collected by divers and the manipulator arm of the
Piscessubmersibles (Fig. 4). Qualitative collections and observations were made to determine species presence, and quantitative transects were made to measure the distribution and abundance of species. Depth ranges for algae and fishes known to occur at depths of less than 200 m were determined from quantitative and qualitative surveys, and available published information. All specimens were photo-documented using high-resolution digital cameras, and voucher specimens were deposited in the Bishop Museum Natural Sciences collections.
Population dynamics
Figure 5 Colony ofLeptoserissp. being stained with Alizarin Red for growth rate studies.Photo: HURL.
collaborators at the Woods Hole Oceanographic Institution for computerized axial tomography (CT) scanning,14C and U/Th (Uranium–thorium) dating and elemental ratio analyses to determine growth rates. Three fish species exploited on shallow reefs and reported from MCEs,Centropyge potteri(Jordan & Metz 1912),Ctenochaetus strigosus
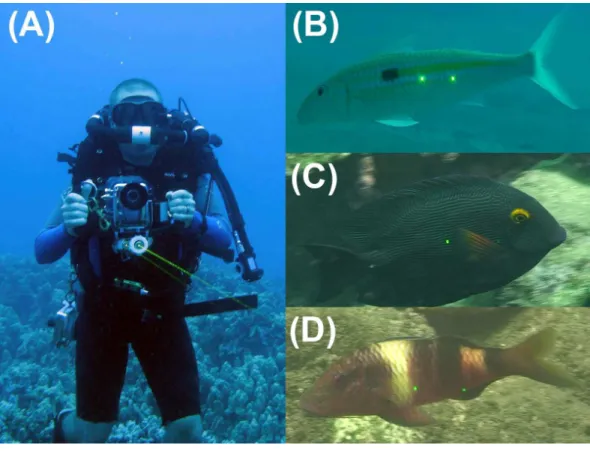
Figure 6 Ross Langston demonstrating the videogrammetry technique for estimating fish sizes.A video camera fitted with parallel lasers (A); superimposes a measurement scale on target fish (B–D). Pho-tos: H Bolick, K Longenecker and R Langston.
Broad trophic characterizations
To determine the trophic level of key food web components and functional groups, we conducted stomach content and carbon and nitrogen stable isotopic analyses of reef fishes from 45 species, 30 genera and 18 families (Bradley et al., in press). Further isotope analysis was performed on 24 selected species from seven families without stomach content analysis (Papastamatiou et al., 2015). We also used compound-specific isotope analysis of amino acids to estimate trophic positions of fishes (McClelland & Montoya, 2002;McClelland, Holl & Montoya, 2003;Pakhomov et al., 2004;McCarthy et al., 2007;Popp et al., 2007;Hannides et al., 2009;Hannides et al., 2013) using the difference in δ15N values of trophic and source amino acids for trophic position calculation (Chikaraishi et al., 2009;Bradley et al., 2015). Additional isotopic analyses were performed on Galapagos sharks [Carcharhinus galapagensis (Snodgrass & Heller 1905)] and giant trevally [Caranx ignobilis(Forsskål 1775)] in the NWHI (Papastamatiou et al., 2015).
RESULTS AND DISCUSSION
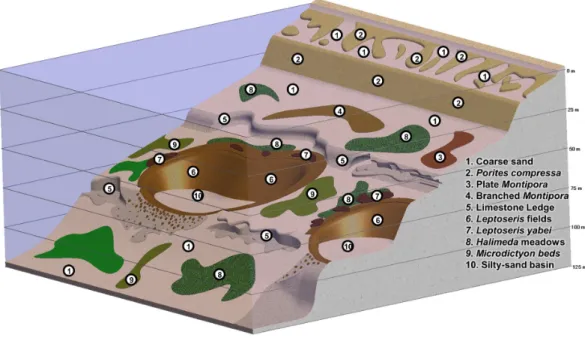
Figure 7 Generalized diagram of major components of MCEs in the ‘Au‘au Channel, Hawaiian Is-lands.Illustration by RL Pyle.
by NOAA. Some portions of this overall research have already been published elsewhere, and others are presented for the first time herein. For purposes of clarity and cohesiveness, we present both novel and previously published information together. When information has previously been published, we provide appropriate literature citations, and when information is presented for the first time, we indicate it as such.
Our investigations revealed that MCEs throughout the Hawaiian Archipelago can be broadly categorized into several distinct habitat types (Fig. 7). The shallowest portions of MCEs (30–50 m) are characterized by a few of the coral species found on shallow Hawaiian reefs, in particularMontipora capitataDana 1846,Pocillopora meandrinaDana 1846,Pocillopora damicornis(Linnaeus 1758) andPorites lobataDana 1846. At depths of
∼40–75 m, expanses of low relief ‘‘carpets’’ of branchingM. capitataare found overlying
represents the most spatially extensive MCE environment documented to date (Costa et al., 2015).
These MCE habitats are often not in close proximity to each other, but separated by vast areas of sand lacking any rocky reef structure. Some of these sandy areas are characterized by meadows ofHalimeda kanaloana(Maui),Avrainvilleasp. and/orUdoteasp. (west and south O‘ahu), while others are devoid of organisms associated with coral-reef ecosystems (i.e., non-MCE habitat within MCE depth ranges). Another MCE habitat within the Hawaiian Archipelago that was not a primary subject of investigation for this work, but for which we have extensive qualitative observations, are the steep slopes and drop-offs characteristic of the island of Hawai‘i (i.e., the ‘‘Big Island’’), especially at the southeastern end of the archipelago. This habitat is dominated by basaltic rock (rather than the coral and limestone, which dominate MCE habitat throughout the rest of the archipelago). Finally, one MCE habitat notably absent from the Hawaiian Archipelago, but prevalent throughout most of the tropical Indo-Pacific, is steep limestone drop-offs, which often extend more or less continuously from shallow-reef depths down to MCE depths and beyond.
In the sections that follow, we highlight and summarize the most salient aspects of MCEs throughout the Hawaiian Archipelago. In particular, we compare and contrast patterns across different MCE habitats, different parts of the archipelago, and among different taxa, as well as emphasize both commonalities and differences among these patterns.
Geophysical habitat characterization
General habitat characterization
MCE habitats in different parts of the archipelago were characterized by contrasting geophysical structures and bathymetric profiles. The general bathymetry of MCEs throughout most of the archipelago (except the island of Hawai‘i, which was not a primary study site) is characterized primarily by gradually sloping flat substrate with occasional rocky outcrops of both volcanic and carbonate material. In most areas, the gradually sloping bottom was interrupted by bathymetric discontinuities at approximately 50–60 m, 80–90 m, and 110–120 m depths (the 80–90 m discontinuity is buried in sand throughout most of the NWHI, except for a small exposed area near Pearl and Hermes Atoll). These discontinuities were typically continuous, rocky undercut limestone ledges or steep sandy or limestone slopes parallel to shore. In some locations, such as within the ‘Au‘au Channel, these discontinuities were the result of karstification (Fig. 2). MCE habitats identified within flat-bottom areas (i.e., between discontinuities) included macroalgal meadows, macroalgal beds, and (especially in the 40–75 m range) expansive low relief beds of interlocking branching colonies, or laminar tiers ofMontiporaspp. Gradually sloping, flat-bottom areas were also commonly surfaced by sand, gravel, rhodoliths and pavement, with very little coral cover. Corals were more common on exposed rock surfaces along rock ledges and outcrops. In contrast to most sites in the Hawaiian Archipelago, the 80–90 m discontinuity within the ‘Au‘au Channel included very few exposed rocky areas at MCE depths, except along very steep walls and in a few areas otherwise dominated by
Figure 8 Temperature data from ‘‘John’’ and ‘‘Frank’’ moorings.Temperature data from ‘‘John’’ and ‘‘Frank’’ moorings, comparing seasonal and daily fluctuations in water temperature at each of eight different depths off the ‘Au‘au Channel from August 2008 to July 2009. Graphs represent the average daily temperature (A) and the daily standard deviation (SD) (B) at each depth. The thin black line below each depth trace in (B) repre-sents SD=0, and the thin black line above represents SD=1; the greater the distance of the color line from the black line below (SD=0), the more dynamic the daily temperature. SD is based onn=72 temperature values/day for data recorded at 84 and 123 m, andn=36 for other depths.
Geophysical factors
One of the most important geophysical characteristics of MCEs in Hawai‘i is water clarity. Within the ‘Au‘au Channel, MCEs were found to occur in areas offshore with very clear water, with a diffuse attenuation coefficient (Ko) of 0.041±0.001 m−1. In comparison,
nearby areas inshore of west Maui had higher attenuation coefficients (and thus more turbid water), ranging from 0.107 m−1at 10 m depth to 0.073 m−1at 30 m depth (Spalding, 2012). The average percent surface irradiance (SI) and irradiance values (PAR) at depth were 10% SI at 34 m (245±15 SEµE m−2s−1), 1% SI at 90 m (25±3 SEµE m−2s−1), and 0.1%
at 147 m (2.5±0.4 SEµE m−2s−1). The 1% SI is often referred to as the compensation point, where photosynthesis equals respiration; above this point, there is net photosynthesis and production of organic matter; below this point, there is net consumption of organic material, and respiration exceeds photosynthesis (Kirk, 2011). In general, areas with the clearest water also supported the richest and most expansive MCEs.
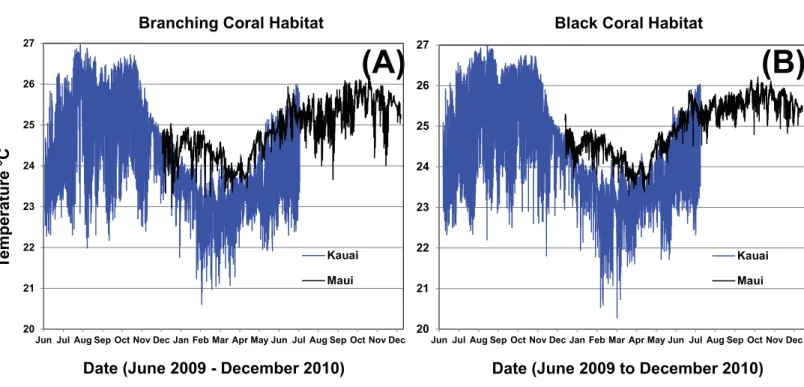
Figure 9 One-year temperature profile in two MCE habitat types at Kaua‘i and Maui.Branching coral (Montipora; A) habitat was at approxi-mately 57 m and black coral (Antipathes, B) habitat was at 34 to 62 m.
occurred at 50–75 m, however, temperatures were very consistent on this time scale at the deep site (Fig. 8B). The most dynamic temperatures for all but the deepest three depths, corresponded with the warmest months (September to November), and the most thermally stable months were the coolest (February to May). We were unable to determine whether MCEs are influenced by tidally-correlated vertical thermocline shifts. The establishment of moorings at the deep extreme of the MCE range would provide useful comparative data to test for a tidal effect, versus bathymetric forcing. In March of 2009, the ‘‘Tele 1’’ mooring slid down slope, causing the temperature sensor to change depth, so data from this mooring were not included in the analyses. A comparison of temperatures between Maui and Kaua‘i at 34–62 m showed that both islands had a seasonal trend, but Kaua‘i had a higher daily and seasonal fluctuation than Maui (Fig. 9).
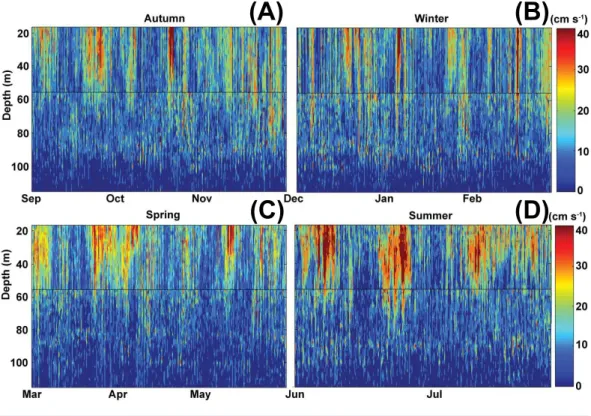
Figure 10 Current magnitude profiles.Sontek 250 kHz Acoustic Doppler Profiler profiles of current magnitude in cm s−1, with overlap shown in the black line between the deeper Frank mooring and
shal-lower John mooring. Broken down by seasons to show detail (A, Autum; B, Winter; C, Spring; D, Sum-mer).
Biodiversity patterns
Species diversity
Seventy-two species of frondose macroalgae were identified based on morphological characteristics from MCEs in the MHI, including 29 Chlorophyta, 31 Rhodophyta, and 12 Phaeophyceae. Estimates of macroalgal diversity are likely conservative because of taxonomic limitations regarding morphological identifications. For instance, large green algal ‘‘sea lettuce’’ blades from MCEs were all identified morphologically as ‘‘Ulva lactuca.’’ However, recent molecular analyses revealed that these specimens represent four new species belonging to the generaUlvaandUmbraulva, which cannot be identified using morphological characters alone (Spalding et al., 2016). Nevertheless, the methods used were similar to current taxonomic treatments in Hawai‘i (Abbott, 1999;Abbott & Huisman, 2003;Huisman, Abbott & Smith, 2007) allowing for comparisons with the better-known shallow-water flora. Macroalgal communities were found in discrete patches (separated by sand or other benthic habitats) at all MCE depths in the MHI. Examples include expansive meadows of Halimeda kanaloanaVroom in sand, beds ofHalimeda distorta
(Yamada) Hillis-Colinvaux over hard substrates, as well as monospecific beds ofDistromium
to heterogeneous structural complexity. In contrast, MCE macroalgal communities in the NWHI tended to be dominated by beds ofMicrodictyonspp., although ROV video around the banks of the NWHI also show regions ofSargassumorDictyopterisspecies (Parrish & Boland, 2004) (collections not yet available for verification).
Of the approximately fifty species of scleractinian corals known from the Hawaiian Islands (Hoover, 1998), ten were recorded by this study from MCEs in the MHI. Three of these—Pocillopora damicornis,P. meandrina,Porites lobata, andMontipora capitata—are common species on adjacent shallow reefs. A previously published phylogeny resolved sixLeptoserisspecies in Hawai‘i:Leptoseris hawaiiensisVaughan 1907,L. papyracea(Dana 1846), L. scabra Vaughan 1907,L. tubilifera Vaughan 1907,L. yabei (Pillai & Scheer, 1976), and a putative undescribed species, ‘‘Leptoserissp. 1’’ (Luck et al., 2013;Pochon et al., 2015). However, the reliability of coral phylogenies has been challenged due to limited genetic variation (Sinniger, Reimer & Pawlowski, 2010). In addition to scleractinian corals, eight antipatharian coral species were documented from MCE depths through work associated with this study and published previously (Wagner et al., 2010;Wagner et al., 2011; Wagner, 2015a;Wagner, 2015b).
One of the goals of this research was to identify key parameters that might determine the presence and distribution of MCE habitats elsewhere in Hawaiian waters through the development of a spatial model. This portion of our study has been published previously (Costa et al., 2015), but in summary, depth, distance from shore, euphotic depth and sea surface temperature were identified as the four most influential predictor variables for partitioning habitats among the three genera of corals included in the modeling exercise (Leptoseris,Montipora, andPorites).Costa et al. (2015)found that for corals that occur in the shallower depth (50 m) of MCEs, hard substrate is necessary, but not sufficient, for colonization. It is less certain whether hard substrate is necessary at greater depths, where some of theLeptoserisbeds were found in a density of three or more layers of coral plates deep. Whether this is due to accretion on a hard substrate or a stable soft bottom needs further examination. Additional details of the methods and results from this portion of the study are available inCosta et al. (2015). ExtensiveLeoptoseris-dominated MCEs with very similar structure, depth and species composition have been identified in two MHI regions: the ‘Au‘au Channel, and off southeastern Kaua‘i (Fig. 11). Although no other
Leoptoseris-dominated MCEs have yet been located within the Hawaiian Archipelago, similar MCE habitats may exist elsewhere in the MHI.
In addition to corals, nearly 200 specimens from among eight phyla of marine invertebrates (Foraminifera, Porifera, Bryozoa, Annelida, Arthropoda, Cnidaria, Ophiuroidea, and the subphylum Urochordata) were collected from MCEs in the MHI. Unfortunately, many of these groups are poorly known taxonomically, and nearly three quarters of these specimens remain unidentified.
Figure 11 Comparison ofLeptoseris-dominanted MCE habitats.(A) Kaua‘i and (B) Maui, showing the close similarity in general structure.
Table 2 Comparison of fish assemblages associated with black coral beds of two Main Hawaiian Is-lands, Kaua‘i and Maui.Feeding guild percentages from number of fish in the feeding guild compared to total number of fish observed in the island’s black coral bed.
Maui Kaua‘i
Total fish observed 2,080 1,322
Number of species observed 60 52
Herbivore 7% 5%
Planktivore 68% 67%
Omnivore 1% 1%
Benthic Carnivore 23% 26%
Piscivore 1% 1%
distributions. Both were dominated by planktivores with Maui at 68% and Kaua‘i at 67%, with the next largest group being benthic carnivores at 23% and 26%, respectively (Table 2). By comparison, black coral MCEs of the Mid-Atlantic Ridge host 33% planktivores and 9% benthic carnivores (Rosa et al., 2016).
Within the ‘Au‘au Channel site, both divers and submersible observers made repeated anecdotal observations of highly heterogeneous fish diversity and abundance overLeptoseris
beds with similar morphology and abundance. Some areas were almost devoid of fishes (Fig. 12A), whereas others harbored high levels of both diversity and abundance (Fig. 12B). No transect data were performed to quantify this preliminary observation, and we can think of no obvious reason why the pattern might exist. However, we feel this observation is interesting enough, and was made consistently enough, to justify noting here in the hope of prompting future research.
Figure 12 Heterogeneous reef fish distribution onLeptoserisreefs in the ‘Au‘au Channel. Reef fish distribution onLeptoserisreefs in the ‘Au‘au Channel was heterogeneous, with large areas nearly devoid of fishes (A) punctuated with areas of high fish diversity and abundance (B). The fishes seen in the distance in (A) represent a separate localized area of high abundance. All but two of the fishes visible in (B) belong to endemic species (Endemics:Chaetodon miliaris, Pseudanthias thompsoni, Sargocentron diadema,
Das-cyllus albisella, Holacanthus arcuatus, Centropyge potteri;Non-endemic:Forcipiger flavissimus, Parupeneus
multifasciatus). Photos: HURL.
determined by experts in the respective taxonomic groups to be undescribed, and are in various stages of formal description. At least one putative new species of scleractinian coral (Leptoseris) has been identified (as noted above), and one putative new species and one new record of Antipatharian corals for the Hawaiian Archipelago have been recorded (Wagner et al., 2011;Opresko et al., 2012;Wagner, 2015a). Undescribed macroalgae will require molecular characterizations that will likely increase the number and diversity of recognized species. Likewise, the taxonomy of many groups of marine invertebrates is poorly known (see Hurley et al. 2016), and many of the unidentified specimens of invertebrates may prove to be new species, once subjected to the same taxonomic scrutiny by appropriate experts that the aforementioned fishes, corals and algae have undergone. Sponge taxonomists have indicated numerous undescribed species and genera from among MCE collections. This is likely the case for the other phyla as well, especially within polychaetes, small crustaceans, and tunicates.
Depth zonation
The preponderance of new species within MCE habitats reinforces the observation that the species inhabiting deeper MCEs are generally different from those inhabiting shallow reefs. Overall, diversity was lower on MCEs than on nearby shallow reef habitats. This pattern was consistent for macroalgae, corals, macroinvertebrates and fishes. However, within MCE habitats, different taxonomic groups showed different patterns of diversity.
Figure 13 Total number of macroalgal species (over all sites combined) found at each depth surveyed. Depth of occurrence is based upon collections and visual observations when species level identifications were verified. Shallower depths (40–60 m) were collected by mixed-gas divers while depths≥70 m were collected by submersibles. SeeSpalding (2012)for collection locations. Data are included in the ‘‘Algae-Data’’ (Supplemental Information 2; Tab 1) worksheet of the Raw Data file.
m−2s−1at 110 m depths), although sedimentation from terrigenous sources appeared to reduce macroalgal abundance at a few sites.
A similar pattern may exist for scleractinian corals. Three species of corals were found at 30–50 m (M. capitata,P. damicornisandP. lobata).P. damicornisandP. lobatawere only seen at the shallowest MCEs (<50 m), whileM.capitataoccurred at greater depths (50–80 m) (Rooney et al., 2010). At these greater depths,M. capitatawas most commonly observed in a branching morphology that formed low-relief reefs carpeting tens of km2 of sea-floor off the west coast of Maui. Similar reefs have been observed off Kaua‘i and Ni‘ihau, although a plate-like morphology is dominant around O‘ahu. At greater depths, the dominant corals are within the genusLeptoseris. Starting at a depth of∼65 m,Leptoseris
corals were most commonly encountered, becoming the dominant corals at depths below
∼75 m, and continuing in high abundance down to 130 m, with solitary colonies at
depths in excess of 150 m (Rooney et al., 2010). Of these, recent evidence indicates that
L. hawaiiensiswas found exclusively at depths below 115–125 m (Pochon et al., 2015). The latter study also investigated endosymbiotic dinoflagellateSymbiodiniumand resolved three unambiguous haplotypes in clade C, with one haplotype exclusively found at the lower MCE depth extremes (95–125 m) (Pochon et al., 2015). These patterns of host–symbiont depth specialization indicate limited connectivity between shallower and deeper portions of MCEs, and suggest that niche specialization plays a critical role in the host–symbiont evolution of corals at MCE depth extremes.
Hawaiian Islands.Hurley et al. (2016)observed strong zonation of brachyuran crab species by depth off O‘ahu, and this trend is likely to extend to all invertebrate phyla. Remarkably few amphipods were found, and most were parasitic or inquiline species (Longenecker & Bolick, 2007); possibly an artifact of sampling with submersibles (i.e., free-living species may have been swept off during ascent).
The pattern of depth stratification was much less apparent among fishes. Depth ranges of all reef-associated fish species known to occur at depths of less than 200 m (n=445) were obtained through this study and from historical literature, and are included in the ‘‘FishData’’ (Supplemental Information 2; Tab 2) worksheet of the Raw Data file. Among species recorded at depths greater than 30 m (n=346), 87% (n=302) also occur at shallower depths (i.e., only 12% (n=44) of fishes recorded from MCEs are restricted to MCEs). In the Northwestern Hawaiian Islands,Fukunaga et al. (2016)found that fish assemblages at mesophotic depths (27–67 m) had higher densities of planktivores and lower densities of herbivores than on comparable shallow reef-fish assemblages between 1 and 27 m. It has been suggested that there may be a consistent and relatively sharp faunal break at around 60 m (Slattery & Lesser, 2012). An analysis ofbeta-diversity among fishes in the Red Sea found that the rate of species turnover increased with depth (Brokovich et al., 2008); however, this study only extended to 65 m, the shallowest portion of MCEs. Moreover, traditional approaches to quantifying beta-diversity changeover are designed to measure presence/absence data for multiple discrete zones, and would require multiple replicate transects at multiple depth zones across many different habitats and geographic locations (i.e., potentially thousands of transects) to adequately characterize species transition patterns. Instead, the question of where the largest and most substantial species assemblage transitions occur can be addressed by a more holistic approach to known species depth ranges (see Supplemental Information 1). Figure 14A, which summarizes data included in the ‘‘FishData’’ (Supplemental Information 2; Tab 2) worksheet of the Raw Data file, reveals that the most substantial faunal transitions in fishes occur in the range of 10–30 m and 110–140 m, and the least substantial transitions occur in the range of 40–60 m, with moderate transitions in the range of 70–100 m. The most substantial floral transitions (from data included in the ‘‘AlgaeData’’ (Supplemental Information 2; Tab 1) worksheet of the Raw Data file) occur between 90–110 m and at 130 m depths (Fig. 14B), indicating that 60 m is not a significant transition for species changeover in macroalgae. Brachyuran crabs show the strongest transitions between 60 and 90 m (Hurley et al., 2016). The diversity of coral species is insufficient to allow the application of this type of analysis; however, applying this method to other taxa and in other regions should provide insight into whether floral and faunal breaks are consistent on a broader taxonomic and geographic scale.
Endemism
Figure 14 Fish and macroalgal species changeover at 10-m depth intervals.The degree of fish (n=445) changeover (A) and macroalgal (n=
72) species changeover (B) at 10-m depth intervals. Values of each bar represent the number of species with a maximum known depth limit within 10 m above each depth interval plus the number of species with a minimum known depth limit within 10 m below each interval, expressed as a per-centage of the total species present at the interval. A high value indicates a more substantial break, and a low value represents a less substantial break. Data are included in the ‘‘AlgaeData’’ ((Supplemental Information 2; Tab 1)) and ‘‘FishData’’ (Supplemental Information 2; Tab 2) worksheets of the Raw Data file.
the 20.5% of endemic fishes across all reef and shore fishes reported for the Hawaiian Archipelago (Randall, 1998). However, with more careful analysis, the trend of increasing endemism with increasing depth within MCEs is even stronger.
Based on our surveys, the rate of endemism among reef fishes found exclusively shallower than 30 m (n=126) was 17%, and the rate of endemism among reef fishes
Figure 15 Proportion of endemic reef fish species in mesophotic fish communities of the NWHI.
(Kosaki et al., 2016). This pattern is also evident in the MHI, as illustrated byFig. 12B(taken at 90 m in the ‘Au‘au Channel) in which all but two of the hundreds of fishes are endemics. This pattern may represent a combination of both depth and latitudinal gradients, and ongoing quantitative surveys throughout the Hawaiian Archipelago should reveal more detailed interpretations of these patterns.
Patterns of endemism among other groups (particularly macroalgae and marine invertebrates) are more difficult to quantify. The full extent of endemism and the broader diversity within the MCE flora can only be determined after molecular studies are conducted and data are gathered from similar MCE habitats elsewhere in the Pacific. Until the unidentified specimens of invertebrates from MCEs are examined by appropriate experts, and comparable sampling is conducted elsewhere in the Pacific, it will not be possible to determine proportions of endemism among marine invertebrates on Hawaiian MCEs.
Population dynamics
We hypothesized that growth rates (the radial extension of the carbonate plate) ofLeptoseris
Figure 16 Proportion of endemic coral reef fish species across the tropical Indo-Pacific by island/re-gion.Sources:Randall, 1998;Moura & Sazima, 2000;Allen, 2008;Floeter et al., 2008.Kane, Kosaki & Wag-ner, 2014; this study.
Figure 17 Temperature log from stained coral.
Table 3 Ages ofLeptoserissp. colony samples based on Uranium/Thorium (U/Th) dating techniques. The colony was marked in December 2007 and sampled January 2010.
Sample Uranium–Uranium 234/238 activity
Thorium–Uranium 230/238 activity
Initial delta238U Age (yr) before 2012.75 Estimated sample
age (yr) LH1 1.1467±0.0002 0.000160±7.1×10⁻⁷ 146.7±0.23 15.3±0.07 14.8
LH2 1.1470±0.0002 0.000137±7.0×10⁻⁷ 147.0±0.19 13.1±0.07 10.4
LH3 1.1470±0.0002 0.000132±9.5×10⁻⁷ 147.0±0.17 12.6±0.09 9.9
LH4 1.1469±0.0002 0.000138±1.1×10⁻⁶ 146.9±0.23 13.1±0.11 10.4
LH5 1.1469±0.0003 0.000061±5.6×10⁻⁷ 146.9±0.27 5.8±0.05 3.1
LH6 1.1469±0.0002 0.000053±3.3×10⁻⁷ 146.9±0.18 5.0±0.03 2.3
LH7 1.1471±0.0002 0.000138±8.6×10⁻⁷ 147.1±0.24 13.2±0.08 10.5
LH8 1.1468±0.0002 0.000112±7.3×10⁻⁷ 146.8±0.18 10.7±0.07 8.0
sample LH1 to determine a final colony age of∼14.8 years at the time of recovery. The mean of several radius measurements is 14.9 cm providing a mean growth rate of ∼1 cm yr−1, or more than an order of magnitude faster than that reported forL. fragilis. Logistical constraints associated with working at mesophotic depths severely limited the number of specimens available for life-history analysis (37 Centropyge potteri, 33
90P. multifasciatus). Thus, the results presented here should be considered preliminary and did not warrant rigorous statistical analysis.Table 4presents densities, average lengths, and life-history parameters for mesophotic populations from the ‘Au‘au Channel and for previously studied shallow-water populations from across the main Hawaiian Islands. The results were not consistently higher or lower in MCEs compared to shallow reefs. The net effect of these differences, when combined with size-structure data, was predicted by the Ricker model (Everhart & Youngs, 1992), which we modified as described in the detailed ‘Materials and Methods’. The results presented inTable 5indicate that biomass and egg production estimates were lower at MCE depths, and estimates for shallow depths are at least an order of magnitude higher for all except the egg production ofP. multifasciatus. The parameters used in the Ricker model interact in complicated ways, making it difficult to determine reasons for the differences between MCEs and shallow depths. Given the admittedly preliminary nature of our results, we are unwilling to speculate on the cause(s) of these differences. Nevertheless, the possibility that biomass production and reproductive output of exploited fish populations are lower in MCEs deserves full consideration in future fishery management and habitat conservation efforts.
Broad trophic characterizations
The relative representation of different trophic groups of fishes on shallow reefs and MCEs in the NWHI is illustrated inFig. 18. Shallow reefs were numerically dominated by herbivores and mobile invertivores, whereas MCE fish communities were numerically dominated by planktivores (See the ‘‘NWHIFishTrophic’’ (Supplemental Information 2; Tab 3) Worksheet of the Raw Data file).
Table 4 Life history and population characteristics of exploited fishes at MCE and euphotic depths.Lengths (L) as fork length (FL) or total length (TL) are in mm, weights (W) are in g, time (t) is days, batch fecundity (BF) is number of eggs. MCE columns represent the ‘Au‘au Channel, shallow columns from previous studies throughout the main Hawaiian Islands (Longenecker & Langston, 2008;Langston, Longenecker & Claisse, 2009).
C. potteri(TL) C. strigosus(FL) P. multifasciatus(FL)
MCE Shallow MCE Shallow MCE Shallow
Density (#/m2) 0.0024 0.0120 0.0025 0.0524 0.0287 0.0442
Mean L 77.7 70.0 96.7 99.2 122.5 133.8
L-W W=4.99·10−5
(L)2.877
W=2.28·10−5
(L)3.053
W=2.13·10−5
(L)3.037
W=6.51·10−5
(L)2.8499
W=2.02·10−5
(L)2.970
W=3.45·10−5
(L)2.868
Growth Lt = 103.18
(1-e−0.01196(t+146.14))
Lt = 127
(1-e−0.00228(t+63.9))
Lt = 129.86
(1-e−0.00439(t+96.52))
Lt = 142.62
(1-e−0.00717(t−60.31))
Lt =167.646
ee−0.0322504(t−87.2819)
Lt = 303
(1-e−0.00207(t+49.4))
♀L50 73 54 79 84 136 145
L-BF BF=5.494·10−12
(L)7.6343
BF=0.0118 (L)2.596
BF=1.5889·10−29
(L)16.1377
BF=1.2766·10−5
(L)4.1663
BF=1.8865 (L)1.7271
BF=0.0018 (L)3.092
Size-specific sex ratios %♀=232.96−
1.88(L)
%♀=405.5−
4.44(L)
%♀=1239.1−
10.9(L)
%♀=5.99+85.4
9(−.5∗((L−95.58)/26.92)∧2) %♀
=346.76−
1.78(L)
%♀=141.3−
0.617(L)
Table 5 Estimates of biomass and egg production for exploited fishes at mesophotic and euphotic depths.MCE column represents the ‘Au‘au Channel, shallow column from previous studies throughout the main Hawaiian Islands (Longenecker & Langston, 2008;Langston, Longenecker & Claisse, 2009).
MCE Shallow
C. potteri g/m2/yr 0.0773 1.9861
eggs/spawning event/m2 7 26
C. strigosus g/m2/yr 0.0382 6.9699
eggs/spawning event/m2 2 340
P. multifasciatus g/m2/yr 1.9702 19.9779
eggs/spawning event/m2 133 155
For omnivores and planktivores, these results indicate that changes in nutrient sources over the depth range studied did not affect their position within the food web. The small but significantly high trophic position of benthic invertivore feeding guilds from MCEs most likely resulted from consumption of fewer macroalgal grazers on MCEs compared to shallow reefs (Bradley, 2013;Bradley et al., in press).
Isotopic results show that individual fish species generally do not differ greatly in trophic position between the two reef ecosystems (Bradley, 2013;Bradley et al., in press), indicating that managing reef fish species as one group across depths may be appropriate. An exception to this general observation was found in a study of diet and movements of Galapagos sharks,
Carcharinus galapagensis(Snodgrass & Heller, 1905), and Giant trevally,Caranx ignobilis
(Forsskål, 1775), from a MCE at Pearl and Hermes Atoll in the NWHI. Based on stable isotopic analysis and acoustic telemetry to study diet and movements,Papastamatiou et al. (2015)found that giant trevally occupied a wide range of trophic positions potentially due to intraspecific competition. However, carbon isotopic compositions of several species of benthic feeding fish indicate that carbon flow in the two ecosystems may be distinct (Papastamatiou et al., 2015;Bradley et al., in press). While this does not alter the relative trophic position of the fish, it implies that caution should be taken when considering shallow reefs and MCEs as a single ecosystem as the flow of biomass may be different in the two ecosystems.
MCEs as refugia
Figure 18 Comparison of fish assemblage trophic structure between shallow and mesophotic reefs in the NWHI.NIH, Nihoa; FFS, French Frigate Shoals; MID, Midway Atoll; PHA, Pearl and Hermes Atoll; KUR, Kure Atoll.
must also be more resilient to stresses that affect shallow reefs.Bongaerts et al. (2010) reviewed the literature regarding the ‘deep reef refugia’ hypothesis for Caribbean reefs and concluded that it is more likely to apply to ‘‘depth generalist’’ species and may serve a greater importance in the upper range of MCEs (30–60 m). This was exemplified by the coralSeriatopora hystrix in Okinawa, which was extirpated from shallow water, and later discovered at 35–47 m (Sinniger, Morita & Harii, 2013). A primary goal of our research was to understand the extent of connectivity by species across the archipelago, and both genetic and trophic relationships between MCEs and nearby shallow reef habitats. In the first genetic comparison of shallow and MCE reef fishes, the damselfishChromis verator
showed no population structure across depths (Tenggardjaja, Bowen & Bernardi, 2014). Thus, the initial genetic data and the high degree of shared fish species between shallow reefs and MCEs (84%, when considering the full depth range of MCEs) indicate that MCEs may function as refugia for some impacted populations on shallow reefs, especially for fishes (Lindfield et al., 2016). However, biomass and egg production estimates for three exploited species (C. potteri,C. strigosus, andP. multifasciatus) from this study (Table 5) are consistently lower for MCE populations, even though estimates for shallow populations incorporate the effects of fishing mortality. Moreover, patterns of larval dispersal between and among shallow and MCE populations are not well known. Rather than being viewed as a source for shallow-water reef fish, the MCE populations may require more protection than their shallow-water counterparts.
Vertical distribution of scleractinian coral species in the Hawaiian Islands is well known for common, conspicuous species while rare, cryptic or hard to identify species are less understood.Rooney et al. (2010)andLuck et al. (2013) both reported depth ranges for scleractinian species. Based on the anecdotal observations of this study, we observed a similar pattern of species distribution where there appears to be greater species overlap between shallow reefs and upper MCEs (30–60 m) than between shallow reefs and lower MCEs (>60 m). As such, the lower MCE populations do not serve as effective scleractinian species refugia for shallow reefs. This pattern of coral segregation by depth has also been reported byKahng, Copus & Wagner (2014). Corals in the upper MCE may in some cases serve as refugia for shallower populations, as modeling studies indicate high larval-mediated connectivity (Thomas et al., 2015;Holstein, Smith & Paris, 2016). Few studies have tested genetic connectivity across depths for corals. Based on a microsatellite survey ofPorites astreoidesin the West Atlantic,Serrano et al. (2016)showed high connectivity between shallow and deep reefs in Bermuda and U.S. Virgin Islands, but some evidence of population structure between shallow and deep reefs in Florida.Van Oppen et al. (2011) showed a restriction of gene flow between shallow and deep colonies of the brooding coral
Seriatopora hystrix, but also some evidence that larvae from deep reefs may seed shallow reefs. Hence the evidence for coral refugia is equivocal at this time, and studies in Hawaii would be valuable contributions to this debate.
Recently, the Caribbean coral,Porites astreoides, was shown to have similar reproductive characteristics across depths. Holstein, Smith & Paris (2016) modeled the vertical connectivity of two Caribbean species, P. astreoides(brooder) and Orbicella faveloata
contribution from the brooder (Holstein et al., 2015). However, both of these studies were conducted in shallow reefs and the upper MCE and not in the lower MCE further suggesting less connectivity with the lower MCE.Prasetia, Sinniger & Harii (2016)examined the reproductive characteristics ofAcropora tenellafrom the upper MCE and found the reproductive characteristics to be similar to shallow reef acroporids, but they did not examine lower MCE colonies.
While MCEs in Hawai‘i may fulfill the first requirement for refugia (at least for fishes and some corals), the resilience of Hawaiian MCEs as compared to their shallow-reef counterparts remains unknown. Several abiotic factors (e.g., exposure to high light or temperature fluctuations) would intuitively cause more stress for shallow reef systems than for MCEs, but the impact of these stressors on coral resilience is not always straightforward. Corals with regular exposure to high temperatures or elevated PAR may be more tolerant of extreme conditions than corals without such exposure (West & Salm, 2003;Grimsditch & Salm, 2006). Conversely, corals inhabiting more stable and cooler conditions on MCEs may be less resilient to temperature changes than their shallow-reef counterparts. The impacts of climate change on MCEs are not yet understood, and we are in need of additional research and predictive modeling before assumptions can be made about the resilience of MCEs as compared to shallow reefs. While vertical thermal stratification maintains some MCEs at lower temperatures than shallow reefs, MCEs may still be vulnerable to thermal anomalies that drive bleaching on shallow reefs. During a September 2014 mass-bleaching event in the NWHI, water temperatures of 24◦C were recorded by divers at 60 m at Lisianski, approximately 4◦C higher than typical for that depth. Mesophotic coral communities may potentially be as vulnerable to bleaching events as adjacent shallow reefs. However, our ability to predict the oceanographic conditions that cause thermal conditions at MCE depths is more limited than shallow reefs. This threat has potentially severe implications for the numerous undescribed species of algae collected from the same MCE site at Lisianski; with an increased frequency and severity of warm-water thermal anomalies, we may be at risk of losing some of these species to climate change before we even document their existence.
Corals in MCEs are growing at considerably lower SI, and are potentially near the lower limit of light intensity required for photosynthesis. Water clarity was identified as a key factor in predicting the presence of MCEs, with less well-developed MCEs in areas with less light penetration (Costa et al., 2015). It is conceivable that a small increase in turbidity near the surface (e.g., from coastal activities that either produce excess sedimentation directly or increase nutrient levels causing increased plankton densities) could have greater impacts on MCEs than on their shallow-reef counterparts.
vulnerable to disturbance or which might serve as a refuge. Thus, when future studies assess the potential for MCEs to serve as refugia to replenish disturbed shallow reefs, they should also consider the implications of the reverse relationship as well.
Management implications
Our multi-year collaborative research on MCEs across the Hawaiian Archipelago has provided new insights on basic geophysical characteristics, patterns of biodiversity, and information on genetic and trophic connectivity that can enhance the foundations for management and conservation of MCEs and coral-reef environments in general.
The ‘Au‘au Channel is the most extensive complex of MCE coral and macroalgal communities in Hawai‘i. Growing on the island’s deep slope, its fragile structure and biodiversity is currently isolated from some anthropogenic impacts, but MCEs should be considered in all future coastal zone management plans for the region. Currently, part of the ‘Au‘au Channel is listed as a Habitat Area of Particular Concern by the National Marine Fisheries Service. Given its unique geomorphology and biotic characteristics, state or federal managers should include a fully protected area. The discovery of similar MCEs off Kaua‘i, Ni‘ihau, and in the NWHI confirm that such environments occur elsewhere within the Hawaiian Archipelago and likely the broader Pacific. Although these sites have not been studied to the same extent as the ‘Au‘au Channel, it is clear from divers and remote camera surveys that the corals form fragile complexes and would be easily damaged from bottom contact. There also appears to be a rich diversity of mesophotic macroalgae in the NWHI. The need to fully protect the ‘Au‘au Channel and other MCE hotspots within the Hawaiian Archipelago is underscored by the fact that upper MCEs (30–60 m) are likely to serve a more prominent role as a refuge for corals, while the lower MCEs (>60 m) harbor unique assemblages of species with higher rates of endemism. As noted previously, MCEs may also potentially serve as spatial refugia for some overexploited shallow-reef fishes, but this potential must be evaluated on a species-by-species basis.
Our research reinforces the theme that MCEs require clear water, likely due to increased levels of PAR reaching greater depths. These findings indicate that MCEs are less resilient to certain stresses than their shallow-reef counterparts, particularly surface-water clarity. Assessments of the impact of increased turbidity (e.g., from shore-based run-off or nutrient enrichment and its impact on plankton densities) should not be limited to shallow coral-reef ecosystems directly exposed to impaired water quality; it may well be the case that vast expanses of MCE habitat at the limits of photosynthetic production could also be heavily impacted. Examples of dead, coralline algal-covered plate coral formations were observed during this project and highlighted the reality of threats to MCEs.
Channel) ideal locations for renewable energy structures. Planning for such activities needs to consider vulnerabilities associated with MCEs.
In addition to thermal stress (discussed above), climate-driven threats to MCEs may come in the form of increased frequency and severity of large storms (Emanuel, 2005). Currently, major storms that form in the Eastern Tropical Pacific usually pass south of Hawai‘i, but increasing sea surface temperatures may allow these storms to move north (Pachauri & Meyer, 2015). High benthic cover by corals (Leptoserisspp.) on MCEs in the ‘Au‘au Channel is in part facilitated by shelter from wave energy provided by the islands of Maui, Lana‘i, Kaho‘olawe, and Moloka‘i (Costa et al., 2015). A direct hit by a major storm may cause enough mixing of warm stratified surface waters to cause thermal stress at depth, and even a small increase of benthic sheer stress at depth may damage or destroy fragile MCE corals. Finally, ocean acidification may threaten not only corals, but also crustose coralline algae (Jokiel et al., 2008). Rhodolith beds are common features of NWHI and MHI MCEs (Spalding, 2012), and both crustose coralline algae and rhodoliths serve as attachment substrata for MCE algae and antipatharian corals. While there is little that local resource managers can do to alleviate large-scale climate events, it is nevertheless important to understand the potential impacts climate change can have when establishing conservation priorities.
We still know little about MCEs, even in well studied areas such as Hawai‘i, and we do not yet understand the threats to or importance of MCEs in a changing climate. Research needs to be conducted to better characterize whether MCEs will be more or less vulnerable to warming and acidification, or if they will increase the resilience of coral reefs or individual taxa. A better understanding of the basic biodiversity characteristics (e.g., discovering, documenting and describing new species, improving our understanding of depth ranges and endemism, and levels of genetic and trophic connectivity between populations of conspecifics in shallow-reef and MCE habitats) is critical for making informed management decisions. The functional role of MCEs beyond direct connectivity to broader coral reef management must be integrated in future management plans or actions addressing coral reefs.
ACKNOWLEDGEMENTS
We dedicate this work to our friend, colleague, and co-author John Rooney, whose commitment to documenting MCEs in Hawaii was inspirational to us all. Our sincere gratitude goes to Kimberly Puglise for her constant support and encouragement. We thank Matt Ross, Joshua Copus, Robert Whitton, Sonia Rowley, Dave Pence, Jason Leonard, Brian Hauk, Keolohilani Lopes, Christian Clark, Greg McFall, Elizabeth Kehn, Sarah Harris, Paul Murakawa, Brett Schumacher, Russell Sparks, Skippy Hau, Brad Varney, Linda Marsh, Bill Gordon, Kim Tenggardjaja, and the staff, officers and crew of the NOAA Ships
Hi‘ialakaiandKa‘imikai-o-Kanaloa. Many thanks to the pilots and support staff of HURL for their amazing assistance with the submersibles and ROV. Jacqueline Padilla-Gamino, Xavier Pochon, Zachary Forsman, Melissa Roth, Robert Toonen, and Ruth Gates were instrumental with coral molecular analyses. Alison Sherwood, Roy Tsuda, Isabella Abbott, and Gerald Kraft assisted with macroalgal identifications. The dating analysis of the marked
Leptoseris hawaiiensiscoral was conducted by the Cohen Laboratory at the Woods Hole Oceanography Institution. Sonia Rowley provided very helpful editorial comments and insights. The findings and conclusions in this article are those of the author(s) and do not necessarily represent the views of the US Fish and Wildlife Service or NOAA. This is the School of Ocean and Earth Science and Technology contribution number 9814, and Contribution No. 2016-016 to the Hawaii Biological Survey.
ADDITIONAL INFORMATION AND DECLARATION
Funding
Grant Disclosures
The following grant information was disclosed by the authors:
National Oceanic and Atmospheric Administration (NOAA) Center: NA07NOS4780188, NA07NOS4780187, NA07NOS478190, NA07NOS4780189.
NOAA Undersea Research Program’s Hawaii Undersea Research Laboratory (HURL). NOAA Papah¯anaumoku¯akea Marine National Monument.
NOAA Coral Reef Conservation Program: NA05OAR4301108, NA09OAR4300219, HC07-11, HC08-06.
State of Hawaii, Department of Land and Natural Resources, Division of Aquatic Resources. Hawaii Coral Reef Initiative.
Dingell-Johnson Sportfish Restoration program.
National Marine Fisheries Service, Pacific Islands Fisheries Science Center. Association for Marine Exploration.
Competing Interests
The authors declare there are no competing interests.
Author Contributions
• Richard L. Pyle, Ken Longenecker, Frank A. Parrish and John Rooney conceived and
designed the experiments, performed the experiments, analyzed the data, wrote the paper, prepared figures and/or tables, reviewed drafts of the paper.
• Raymond Boland, Holly Bolick, Corinne Kane, Randall K. Kosaki, Ross Langston, Anthony Montgomery and Daniel Wagner conceived and designed the experiments, performed the experiments, analyzed the data, wrote the paper, reviewed drafts of the paper.
• Brian W. Bowen and Heather L. Spalding conceived and designed the experiments,
performed the experiments, analyzed the data, contributed reagents/materials/analysis tools, wrote the paper, reviewed drafts of the paper.
• Christina J. Bradley and Brian N. Popp conceived and designed the experiments, performed the experiments, analyzed the data, contributed reagents/materials/analysis tools, wrote the paper, prepared figures and/or tables, reviewed drafts of the paper.
• Celia M. Smith conceived and designed the experiments, analyzed the data, wrote the
paper, reviewed drafts of the paper.
Animal Ethics
The following information was supplied relating to ethical approvals (i.e., approving body and any reference numbers):
All vertebrates (fishes) were collected in accordance with University of Hawaii IACUC protocol 09-753-5, ‘‘Phylogeography and Evolution of Reef Fishes’’ (PI: Dr. Brian Bowen), including collection and euthanization by spear.
Field Study Permissions
The State of Hawai‘i Department of Land and Natural Resources developed Special Activity Permits for the University of Hawai‘i and National Marine Fisheries Service for work related to this project that occurred within State of Hawai‘i waters. All sampling procedures and experimental manipulations were reviewed as part of obtaining the field permit. Special Activity Permits do not have reference numbers. Papah¯anaumoku¯akea Marine National Monument provided research permits for field work in the Northwestern Hawaiian Islands.
Data Availability
The following information was supplied regarding data availability:
Global Biodiversity Information Facility: http://www.gbif.org/dataset/b929f23d-290f-4e85-8f17-764c55b3b284
Supplemental Information
Supplemental information for this article can be found online athttp://dx.doi.org/10.7717/ peerj.2475#supplemental-information.
REFERENCES
Abbott IA. 1999.Marine red algae of the Hawaiian Islands. Honolulu: Bishop Museum Press.
Abbott IA, Huisman JM. 2003.New species, observations, and a list of new records of brown algae (Phaeophyceae) from the Hawaiian Islands.Phycological Research
51:173–185DOI 10.1046/j.1440-1835.2003.t01-1-00308.x.
Agegian CR, Abbott IA. 1985.Deep-water macroalgal communities: a comparison between Penguin Bank (Hawaii) and Johnston Atoll.Proceedings of the Fifth International Coral Reef Congress5:47–50.
Allen GR. 2008.Conservation hotspots of biodiversity and endemism for Indo-Pacific coral reef fishes.Aquatic Conservation: Marine and Freshwater Ecosystems18:541–556. Baker EK, Puglise KA, Harris PT (eds.) 2016. Mesophotic coral ecosystems—a lifeboat
for coral reefs? The United Nations Environment Programme and GRID-Arendal, Nairobi and Arendal, 98 p.
Bare AY, Grimshaw KL, Rooney JJ, Sabater MG, Fenner D, Carroll B. 2010.Mesophotic communities of the insular shelf at Tutuila, American Samoa.Coral Reefs
29:369–377DOI 10.1007/s00338-010-0600-y.
Blyth-Skyrme VJ, Rooney JJ, Parrish FA, Boland RC. 2013.Mesophotic coral ecosystems–potential candidates as essential fish habitat and habitat areas of par-ticular concern. Pacific Islands Fisheries Science Center, National Marine Fisheries Science Center Administrative Report H-13-02, Silver Spring, 53 p.
Boland R, Parrish FA. 2005.Description of fish assemblages in the black coral beds off Lahaina, Maui, Hawaii.Pacific Science59:411–420 DOI 10.1353/psc.2005.0032. Bongaerts P, Frade PR, Hay KB, Englebert N, Latijnhouwers KR, Bak RP, Vermeij
depths harbor a specialized coral-endosymbiont community.Scientific Reports
5:Article 7652DOI 10.1038/srep07652.
Bongaerts P, Ridgway T, Sampayo EM, Hoegh-Guldberg O. 2010.Assessing the ‘deep reef refugia’ hypothesis: focus on Caribbean reefs.Coral Reefs29:309–327
DOI 10.1007/s00338-009-0581-x.
Bradley CJ. 2013.Testing the use of compound specific isotopic analysis of amino acids in trophic ecosystem studies. PhD Thesis, University of Hawai‘i, Honolulu.
Bradley CJ, Longenecker K, Pyle R, Popp B.Compound-specific isotopic analysis of amino acids reveals dietary changes in mesophotic coral reef fish.Marine Ecology Progress SeriesIn pressDOI 10.3354/meps11872.
Bradley CJ, Wallsgrove NJ, Choy CA, Drazen JC, Hoen DK, Hetherington ED, Popp BN. 2015.Trophic position estimates of teleosts using amino acid compound specific isotopic analysis.Limnology and Oceanography: Methods13:476–493
DOI 10.1002/lom3.10041.
Brainard R, Friedlander A, Gulko D, Hunter CL, Kelty R, Maragos JE. 2003. Status of coral reefs in the Hawaiian Archipelago. In: Wilkinson C, ed.Status of coral reefs of the world: 2002. Townsville: Australian Institute of Marine Science, 237–250.
Braithwaite C, Montaggioni LF, Camoin GF, Dalmasso H, Dullo WC, Mangini A. 2000. Origin and development of Holocene coral reefs: a revisited model based on reef boreholes in the Seychelles, Indian Ocean.International Journal of Earth Sciences
89:431–445DOI 10.1007/s005310000078.
Bridge T, Guinotte J. 2013.Mesophotic coral reef ecosystems in the Great Barrier Reef world heritage area: their potential distribution and possible role as refugia from disturbance. Townsville: Great Barrier Reef Marine Park Authority, Research Publication no.109. Brock VE, Chamberlain TC. 1968.A geological and ecological reconnaissance off
western Oahu, Hawaii, principally by means of the research submersible ‘‘Asherah’’.
Pacific Science22:373–394.
Brokovich E, Einbinder S, Shashar N, Kiflawi M, Kark S. 2008.Descending to the twilight-zone: changes in coral reef fish assemblages along a depth gradient down to 65 m.Marine Ecology Progress Series371:253–262DOI 10.3354/meps07591. Brown E, Cox E, Jokiel PL, Rodgers K, Smith W, Tisso B, Coles SL, Hultquist J.
2004.Development of benthic sampling methods for the coral reef assessment and monitoring program (CRAMP) in Hawaii.Pacific Science58:145–158
DOI 10.1353/psc.2004.0013.
Bruno JF, Selig ER. 2007.Regional decline of coral cover in the Indo-Pacific: timing, extent, and subregional comparisons.PLoS ONE2:e711
DOI 10.1371/journal.pone.0000711.
Burke L, Reytar K, Spalding M, Perry A. 2011.Reefs at risk: revisited. Washington, D.C.: World Resources Institute.
Chave EH, Malahoff A. 1998.In deeper waters: photographic studies of Hawaiian deep-sea habitats and life-forms. Honolulu: University of Hawai‘i Press.