ACPD
15, 32005–32047, 2015Aqueous-phase
mechanism for
isoprene secondary
organic aerosol
E. A. Marais et al.
Title Page
Abstract Introduction
Conclusions References
Tables Figures
◭ ◮
◭ ◮
Back Close
Full Screen / Esc
Printer-friendly Version Interactive Discussion
Discussion
P
a
per
|
Discussion
P
a
per
|
Discussion
P
a
per
|
Discussion
P
a
per
|
Atmos. Chem. Phys. Discuss., 15, 32005–32047, 2015 www.atmos-chem-phys-discuss.net/15/32005/2015/ doi:10.5194/acpd-15-32005-2015
© Author(s) 2015. CC Attribution 3.0 License.
This discussion paper is/has been under review for the journal Atmospheric Chemistry and Physics (ACP). Please refer to the corresponding final paper in ACP if available.
Aqueous-phase mechanism for
secondary organic aerosol formation from
isoprene: application to the Southeast
United States and co-benefit of SO
2
emission controls
E. A. Marais
1, D. J. Jacob
1,2, J. L. Jimenez
3,4, P. Campuzano-Jost
3,4, D. A. Day
3,4,
W. Hu
3,4, J. Krechmer
3,4, L. Zhu
1, P. S. Kim
2, C. C. Miller
2, J. A. Fisher
5,
K. Travis
1, K. Yu
1, T. F. Hanisco
6, G. M. Wolfe
6,7, H. L. Arkinson
8, H. O. T. Pye
9,
K. D. Froyd
3,10, J. Liao
3,10, and V. F. McNeill
111
School of Engineering and Applied Sciences, Harvard University, Cambridge, MA, USA 2
Earth and Planetary Sciences, Harvard University, Cambridge, MA, USA 3
Cooperative Institute for Research in Environmental Sciences, University of Colorado, Boulder, CO, USA
4
Department of Chemistry and Biochemistry, University of Colorado, Boulder, CO, USA 5
ACPD
15, 32005–32047, 2015Aqueous-phase
mechanism for
isoprene secondary
organic aerosol
E. A. Marais et al.
Title Page
Abstract Introduction
Conclusions References
Tables Figures
◭ ◮
◭ ◮
Back Close
Full Screen / Esc
Printer-friendly Version Interactive Discussion
Discussion
P
a
per
|
Discussion
P
a
per
|
Discussion
P
a
per
|
Discussion
P
a
per
|
6
Atmospheric Chemistry and Dynamics Lab, NASA Goddard Space Flight Center, Greenbelt, MD, USA
7
Joint Center for Earth Systems Technology, University of Maryland Baltimore County, Baltimore, MD, USA
8
Department of Atmospheric and Oceanic Science, University of Maryland, College Park, MD, USA
9
National Exposure Research Laboratory, US EPA, Research Triangle Park, NC, USA 10
Chemical Sciences Division, Earth System Research Laboratory, NOAA, Boulder, Colorado, USA
11
Department of Chemical Engineering, Columbia University, New York, NY 10027, USA
Received: 21 October 2015 – Accepted: 30 October 2015 – Published: 13 November 2015
Correspondence to: E. A. Marais (emarais@seas.harvard.edu)
ACPD
15, 32005–32047, 2015Aqueous-phase
mechanism for
isoprene secondary
organic aerosol
E. A. Marais et al.
Title Page
Abstract Introduction
Conclusions References
Tables Figures
◭ ◮
◭ ◮
Back Close
Full Screen / Esc
Printer-friendly Version Interactive Discussion
Discussion
P
a
per
|
Discussion
P
a
per
|
Discussion
P
a
per
|
Discussion
P
a
per
|
Abstract
Isoprene emitted by vegetation is an important precursor of secondary organic aerosol
(SOA), but the mechanism and yields are uncertain. Aerosol is prevailingly aqueous
under the humid conditions typical of isoprene-emitting regions. Here we develop an
aqueous-phase mechanism for isoprene SOA formation coupled to a detailed
gas-5
phase isoprene oxidation scheme. The mechanism is based on aerosol reactive
up-take probabilities (
γ
) for water-soluble isoprene oxidation products, including sensitivity
to aerosol acidity and nucleophile concentrations. We apply this mechanism to
simula-tion of aircraft (SEAC
4RS) and ground-based (SOAS) observations over the Southeast
US in summer 2013 using the GEOS-Chem chemical transport model. Emissions of
10
nitrogen oxides (NO
x≡
NO
+
NO
2) over the Southeast US are such that the peroxy
radicals produced from isoprene oxidation (ISOPO
2) react significantly with both NO
(high-NO
xpathway) and HO
2(low-NO
xpathway), leading to di
ff
erent suites of
iso-prene SOA precursors. We find a mean SOA mass yield of 3.3 % from isoiso-prene
oxi-dation, consistent with the observed relationship of OA and formaldehyde (a product
15
of isoprene oxidation). The yield is mainly contributed by two immediate gas-phase
precursors, isoprene epoxydiols (IEPOX, 58 % of isoprene SOA) from the low-NO
xpathway and glyoxal (28 %) from both low- and high-NO
xpathways. This speciation is
consistent with observations of IEPOX SOA from SOAS and SEAC
4RS. Observations
show a strong relationship between IEPOX SOA and sulfate aerosol that we explain as
20
due to the indirect e
ff
ect of sulfate on aerosol acidity and volume, rather than a direct
mechanistic role for sulfate. Isoprene SOA concentrations increase as NO
xemissions
decrease (favoring the low-NO
xpathway for isoprene oxidation), but decrease as SO
2emissions decrease (due to the e
ff
ect of sulfate on aerosol acidity and volume). The US
EPA projects 2013–2025 decreases in anthropogenic emissions of 34 % for NO
x(lead-25
ing to 7 % increase in isoprene SOA) and 48 % for SO
2(35 % decrease in isoprene
SOA). The combined projected decreases in NO
xand SO
2emissions reduce isoprene
ACPD
15, 32005–32047, 2015Aqueous-phase
mechanism for
isoprene secondary
organic aerosol
E. A. Marais et al.
Title Page
Abstract Introduction
Conclusions References
Tables Figures
◭ ◮
◭ ◮
Back Close
Full Screen / Esc
Printer-friendly Version Interactive Discussion
Discussion
P
a
per
|
Discussion
P
a
per
|
Discussion
P
a
per
|
Discussion
P
a
per
|
SOA by a similar magnitude, representing a factor of 2 co-benefit for PM
2.5from SO
2emission controls.
1
Introduction
Isoprene emitted by vegetation is a major source of secondary organic aerosol (SOA)
(Carlton et al., 2009 and references therein) with e
ff
ects on human health, visibility, and
5
climate. There is large uncertainty in the yield and composition of isoprene SOA (Scott
et al., 2014; McNeill et al., 2014), involving a cascade of species produced in the
gas-phase oxidation of isoprene and their interaction with pre-existing aerosol (Hallquist
et al., 2009). We develop here a new aqueous-phase mechanism for isoprene SOA
formation coupled to gas-phase chemistry, implement it in the GEOS-Chem chemical
10
transport model (CTM) to simulate observations in the Southeast US, and from there
derive new constraints on isoprene SOA yields and the contributing pathways.
Organic aerosol is ubiquitous in the atmosphere, often dominating fine aerosol mass
(Zhang et al., 2007), including in the Southeast US where it accounts for more than
60 % in summer (Attwood et al., 2014). It may be directly emitted by combustion as
15
primary organic aerosol (POA), or produced within the atmosphere as SOA by
oxi-dation of volatile organic compounds (VOCs). Isoprene (C
5H
8) from vegetation is the
dominant VOC emitted globally, and the Southeast US in summer is one of the largest
isoprene-emitting regions in the world (Guenther et al., 2006). SOA yields from
iso-prene are low compared with larger VOCs (Pye et al., 2010), but isoiso-prene emissions
20
are much higher. Kim et al. (2015) estimated that isoprene accounts for 40 % of total
organic aerosol in the Southeast US in summer.
Formation of OA from oxidation of isoprene depends on local concentrations of
nitrogen oxide radicals (NO
x≡
NO
+
NO
2) and pre-existing aerosol. NO
xconcentra-tions determine the fate of organic peroxy radicals originating from isoprene oxidation
25
ACPD
15, 32005–32047, 2015Aqueous-phase
mechanism for
isoprene secondary
organic aerosol
E. A. Marais et al.
Title Page
Abstract Introduction
Conclusions References
Tables Figures
◭ ◮
◭ ◮
Back Close
Full Screen / Esc
Printer-friendly Version Interactive Discussion
Discussion
P
a
per
|
Discussion
P
a
per
|
Discussion
P
a
per
|
Discussion
P
a
per
|
aerosol phase depends on their vapor pressure (Donahue et al., 2006), solubility in
aqueous media (Saxena and Hildeman, 1996), and subsequent condensed-phase
re-actions (Volkamer et al., 2007). Aqueous aerosol provides a medium for reactive
up-take (Eddingsaas et al., 2010; Surratt et al., 2010) with dependences on acidity
(Sur-ratt et al., 2007b), concentration of nucleophiles such as sulfate (Sur(Sur-ratt et al., 2007a),
5
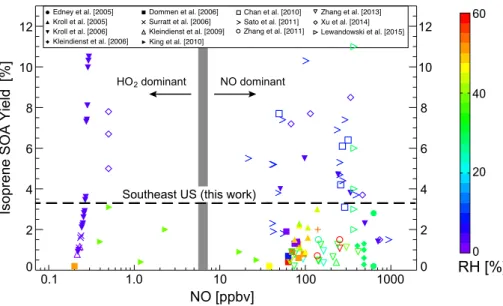
aerosol water (Carlton and Turpin, 2013), and organic coatings (Gaston et al., 2014).
We compile in Fig. 1 the published laboratory yields of isoprene SOA as a function of
initial NO concentration and relative humidity (RH). Here and elsewhere, the isoprene
SOA yield is defined as the mass of SOA produced per unit mass of isoprene oxidized.
Isoprene SOA yields span a wide range, from
<
0.1 % to
>
10 %, with no systematic
10
di
ff
erence between low-NO
xand high-NO
xpathways. Yields tend to be higher in dry
chambers (RH
<
10 %). Under such dry conditions, aerosol formation likely involves
re-versible partitioning of semivolatile isoprene oxidation products into the organic aerosol
phase (Virtanen et al., 2010; Song et al., 2015). At humid conditions more
represen-tative of the atmosphere, aerosols are aqueous and the mechanisms for uptake may
15
be di
ff
erent (Virtanen et al., 2010). Standard isoprene SOA mechanisms used in
atmo-spheric models assume reversible partitioning onto pre-existing organic aerosol, fitting
the dry chamber data (Odum et al., 1996). However, this may not be appropriate for
ac-tual atmospheric conditions where aqueous-phase chemistry with irreversible reactive
uptake of water-soluble gases is likely the dominant mechanism (Ervens et al., 2011;
20
Carlton and Turpin, 2013).
Here we present a mechanism for irreversible aqueous-phase isoprene SOA
forma-tion integrated within a detailed chemical mechanism for isoprene gas-phase oxidaforma-tion,
thus linking isoprene SOA formation to gas-phase chemistry and avoiding more generic
volatility-based parameterizations that assume dry organic aerosol (Odum et al., 1996;
25
oxida-ACPD
15, 32005–32047, 2015Aqueous-phase
mechanism for
isoprene secondary
organic aerosol
E. A. Marais et al.
Title Page
Abstract Introduction
Conclusions References
Tables Figures
◭ ◮
◭ ◮
Back Close
Full Screen / Esc
Printer-friendly Version Interactive Discussion
Discussion
P
a
per
|
Discussion
P
a
per
|
Discussion
P
a
per
|
Discussion
P
a
per
|
tion product of isoprene (Palmer et al., 2003) and we use the OA-HCHO relationship as
a constraint on isoprene SOA yields. SOAS measurements were made at a ground site
in rural Centreville, Alabama (Hu et al., 2015; http://soas2013.rutgers.edu/). SEAC
4RS
measurements were made from the NASA DC-8 aircraft with extensive boundary layer
coverage across the Southeast (Toon et al., 2015; SEAC
4RS Archive).
5
2
Chemical mechanism for isoprene SOA formation
The previous default treatment of isoprene SOA in GEOS-Chem (v9-02; http://
geos-chem.org) follows a standard parameterization that operates independently from
the gas-phase chemistry mechanism and is based on reversible partitioning onto
pre-existing OA of generic semivolatile products of isoprene oxidation by OH and NO
3radi-10
cals (Pye et al., 2010). Here we implement a new mechanism for irreversible uptake by
aqueous aerosols of species produced in the isoprene oxidation cascade of the
GEOS-Chem gas-phase mechanism. This couples SOA formation to the gas-phase chemistry
and is in accord with increased evidence for a major role of aqueous aerosols in
iso-prene SOA formation (Ervens et al., 2011).
15
The standard gas-phase isoprene oxidation mechanism in GEOS-Chem v9-02 is
de-scribed in Mao et al. (2013) and is based on best knowledge at the time building on
mechanisms for the oxidation of isoprene by OH (Paulot et al., 2009a, b) and NO
3(Rollins et al., 2009). Updates implemented in this work are described below and in
companion papers applying GEOS-Chem to simulation of observed gas-phase
iso-20
prene oxidation products over the Southeast US in summer 2013 (Fisher et al., 2015;
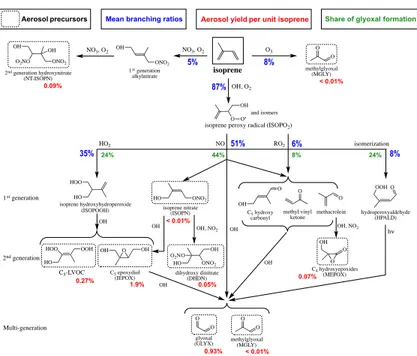
Travis et al., 2015). Most gas-phase products of the isoprene oxidation cascade in
GEOS-Chem have high dry deposition velocity, competing in some cases with removal
by oxidation and aerosol formation (Nguyen et al., 2015b; Travis et al., 2015).
Figure 2 shows the isoprene oxidation cascade in GEOS-Chem leading to SOA
for-25
ACPD
15, 32005–32047, 2015Aqueous-phase
mechanism for
isoprene secondary
organic aerosol
E. A. Marais et al.
Title Page
Abstract Introduction
Conclusions References
Tables Figures
◭ ◮
◭ ◮
Back Close
Full Screen / Esc
Printer-friendly Version Interactive Discussion
Discussion
P
a
per
|
Discussion
P
a
per
|
Discussion
P
a
per
|
Discussion
P
a
per
|
in the first OH oxidation step react with NO, the hydroperoxyl radical (HO
2), other
peroxy radicals (RO
2), or undergo isomerization (Peeters et al., 2009). The NO
re-action pathway (high-NO
xpathway) yields C
5hydroxy carbonyls, methyl vinyl ketone,
methacrolein, and first-generation isoprene nitrates (ISOPN). The first three products
go on to produce glyoxal and methylglyoxal, which serve as SOA precursors. The
over-5
all yield of glyoxal from the high-NO
xpathway is 7 mol %. Oxidation of ISOPN by OH
and O
3is as described by Lee et al. (2014). Reaction of ISOPN with OH produces
sat-urated dihydroxy dinitrates (DHDN), 21 and 27 mol % from the beta and delta channels
respectively (Lee et al., 2014), and 10 mol % isoprene epoxydiols (IEPOX) from each
channel (Jacobs et al., 2014). We also adopt the mechanism of Lin et al. (2013) to
10
generate C
4hydroxyepoxides (methacrylic acid epoxide and hydroxymethylmethyl-
α
-lactone, both denoted MEPOX) from OH oxidation of a peroxyacylnitrate formed when
methacrolein reacts with OH followed by NO
2. Only hydroxymethylmethyl-
α
-lactone is
shown in Fig. 2.
The HO
2reaction pathway for ISOPO
2leads to formation of hydroxyhydroperoxides
15
(ISOPOOH) that are oxidized to IEPOX (Paulot et al., 2009b) and several low-volatility
products, represented here as C
5-LVOC (Krechmer et al., 2015). The kinetics of IEPOX
oxidation by OH is uncertain, and experimentally determined IEPOX lifetimes vary from
8 to 28 h for an OH concentration of 1
×
10
6molecules cm
−3(Jacobs et al., 2013; Bates
et al., 2014). In GEOS-Chem we apply the fast kinetics of Jacobs et al. (2013) and
20
reduce the yield of IEPOX from ISOPOOH from 100 to 75 %, within the range observed
by St. Clair et al. (2015), to address a factor of 4 overestimate in simulated IEPOX
(Nguyen et al., 2015b). IEPOX oxidizes to form glyoxal and methylglyoxal (Bates et al.,
2014). The overall glyoxal yield from the ISOPO
2+
HO
2pathway is 6 mol %. Krechmer
et al. (2015) report a 2.5 mol % yield of C
5-LVOC from ISOPOOH but we reduce this
25
to 0.5 mol % to reproduce surface observations of the corresponding aerosol products
(Sect. 4). Methyl vinyl ketone and methacrolein yields from the ISOPO
2+
HO
2pathway
ACPD
15, 32005–32047, 2015Aqueous-phase
mechanism for
isoprene secondary
organic aerosol
E. A. Marais et al.
Title Page
Abstract Introduction
Conclusions References
Tables Figures
◭ ◮
◭ ◮
Back Close
Full Screen / Esc
Printer-friendly Version Interactive Discussion
Discussion
P
a
per
|
Discussion
P
a
per
|
Discussion
P
a
per
|
Discussion
P
a
per
|
Minor channels for ISOPO
2are isomerization and reaction with RO
2.
Isomeriza-tion forms hydroperoxyaldehydes (HPALD) that go on to photolyze, but products are
uncertain (Peeters and Müller, 2010). We assume 25 mol % yield each of glyoxal and
methylglyoxal from HPALD photolysis in GEOS-Chem following Stavrakou et al. (2010).
Reaction of ISOPO
2with RO
2leads to the same suite of C
4-C
5carbonyls as reaction
5
with NO (C
5hydroxy carbonyls, methacrolein, and methyl vinyl ketone) and from there
to glyoxal and methylglyoxal.
Immediate aerosol precursors from the isoprene
+
OH oxidation cascade are
iden-tified in Fig. 2. For the high-NO
xpathway (ISOPO
2+
NO channel) precursors include
glyoxal and methylglyoxal (McNeill et al., 2012), ISOPN (Darer et al., 2011; Hu et al.,
10
2011), DHDN (Lee et al., 2014), MEPOX (Lin et al., 2013), and IEPOX (Jacobs et al.,
2014). For the low-NO
xpathway (ISOPO
2+
HO
2channel) they include IEPOX
(Ed-dingsaas et al., 2010), C
5-LVOC (Krechmer et al., 2015, in which the aerosol-phase
species is denoted ISOPOOH-SOA), glyoxal, and methylglyoxal. Glyoxal and
methyl-glyoxal are also produced from the ISOPO
2+
RO
2and ISOPO
2isomerization channels.
15
Ozonolysis and oxidation by NO
3are additional minor isoprene reaction pathways
(Fig. 2). The NO
3oxidation pathway is a potentially important source of isoprene
SOA at night (Brown et al., 2009) from the irreversible uptake of low-volatility
second-generation hydroxynitrates (NT-ISOPN) (Ng et al., 2008; Rollins et al., 2009). We
up-date the gas-phase chemistry of Rollins et al. (2009), implemented by Mao et al. (2013),
20
to include formation of 4 mol % of the aerosol-phase precursor NT-ISOPN from
first-generation alkylnitrates (Rollins et al., 2009). Ozonolysis products are volatile and
ob-served SOA yields in chamber studies are low (
<
1 %; Kleindienst et al., 2007). In
GEOS-Chem only methylglyoxal is an aerosol precursor from isoprene ozonolysis.
We implement irreversible uptake of isoprene oxidation products to aqueous
25
ACPD
15, 32005–32047, 2015Aqueous-phase
mechanism for
isoprene secondary
organic aerosol
E. A. Marais et al.
Title Page
Abstract Introduction
Conclusions References
Tables Figures
◭ ◮
◭ ◮
Back Close
Full Screen / Esc
Printer-friendly Version Interactive Discussion
Discussion
P
a
per
|
Discussion
P
a
per
|
Discussion
P
a
per
|
Discussion
P
a
per
|
et al. (2006) and Gaston et al. (2014):
γ
=
"
1
α
+
3
ω
4
rRT H
∗k
aq
#
−1.
(1)
Here
α
is the mass accommodation coe
ffi
cient (taken as 0.1 for all immediate SOA
pre-cursors in Fig. 2),
ω
is the mean gas-phase molecular speed (cm s
−1),
r
is the
aque-ous particle radius (cm),
R
is the universal gas constant (0.08206 L atm K
−1mol
−1),
5
T
is temperature (K),
H
∗is the e
ff
ective Henry’s Law constant (M atm
−1) accounting for
any fast dissociation equilibria in the aqueous phase, and
k
aqis the pseudo first-order
aqueous-phase reaction rate constant (s
−1) for conversion to non-volatile products.
Precursors with epoxide functionality, IEPOX and MEPOX, undergo acid-catalyzed
epoxide ring opening and nucleophilic addition in the aqueous phase. The
aqueous-10
phase reaction rate constant is from Eddingsaas et al. (2010),
k
aq=
k
H+[H
+]
+
k
nuc[nuc][H
+]
+
k
HSO−4
HSO
−4
,
(2)
and includes three channels: acid-catalyzed ring opening followed by nucleophilic
ad-dition of H
2O (
k
H+in M
−1s
−1), acid-catalyzed ring opening followed by nucleophilic
addition of sulfate and nitrate ions (nuc
≡
SO
24−+
NO
−
3
,
k
nucin M
− 2s
−1), and concerted
15
protonation and nucleophilic addition by bisulfate, HSO
−4(
k
HSO−4
in M
−1s
−1). Reaction
rate constants in the literature are from experiments in concentrated media,
represen-tative of aqueous aerosols, so no activity correction factors are used in our work.
Precursors with nitrate functionality (-ONO
2), ISOPN and DHDN, hydrolyze to form
low-volatility polyols and nitric acid (Hu et al., 2011; Jacobs et al., 2014), so
k
aqin
20
Eq. (1) is the hydrolysis rate constant.
ACPD
15, 32005–32047, 2015Aqueous-phase
mechanism for
isoprene secondary
organic aerosol
E. A. Marais et al.
Title Page
Abstract Introduction
Conclusions References
Tables Figures
◭ ◮
◭ ◮
Back Close
Full Screen / Esc
Printer-friendly Version Interactive Discussion
Discussion
P
a
per
|
Discussion
P
a
per
|
Discussion
P
a
per
|
Discussion
P
a
per
|
et al., 2014). Glyoxal forms SOA with higher yields during the day than at night due
to OH aqueous-phase chemistry (Tan et al., 2009; Volkamer et al., 2009; Summer
et al., 2014). We use a daytime
γ
of 2.9
×
10
−3for glyoxal from Liggio et al. (2005) and
a nighttime
γ
of 5
×
10
−6(Waxman et al., 2013; Sumner et al., 2014). The SOA yield
of methylglyoxal is small compared with that of glyoxal (McNeill et al., 2012). A
previ-5
ous GEOS-Chem study by Fu et al. (2008) used the same
γ
(2.9
×
10
−3) for glyoxal
and methylglyoxal. Reaction rate constants are similar for aqueous-phase processing
of glyoxal and methylglyoxal (Buxton et al., 1997; Ervens et al., 2003), but
H
∗of glyoxal
is about 4 orders of magnitude higher. Here we scale the
γ
for methylglyoxal to the
ratio of e
ff
ective Henry’s law constants:
H
∗=
3.7
×
10
3M atm
−1for methylglyoxal (Tan
10
et al., 2010) and
H
∗=
2.7
×
10
7M atm
−1for glyoxal (Sumner et al., 2014). The resulting
uptake of methylglyoxal is very slow and makes a negligible contribution to isoprene
SOA.
The aerosol precursors C
5-LVOC from ISOPOOH oxidation and NT-ISOPN from
iso-prene reaction with NO
3have low volatility and are assumed to condense to aerosols
15
with a
γ
of 0.1 limited by mass accommodation.
Table 1 gives input variables used to calculate
γ
for IEPOX, ISOPN, and DHDN by
Eqs. (1) and (2). Table 2 lists average values of
γ
for all immediate aerosol precursors
in the Southeast US boundary layer in summer as simulated by GEOS-Chem (Sect. 3).
γ
for IEPOX is a strong function of pH and increases linearly from 1
×
10
−4to 1
×
10
−220
as pH decreases from 3 to 0. We obtain values of
γ
for MEPOX by reducing IEPOX
γ
by a factor of 30 when the aerosol is acidic (pH
<
4), due to slower acid-catalyzed
ring opening (Piletic et al., 2013; Riedel et al., 2015). At pH
>
4 we assume that
γ
for
IEPOX and MEPOX are the same (Riedel et al., 2015), but they are then very low.
We neglect isoprene SOA formation in clouds because the aqueous-phase
concen-25
shal-ACPD
15, 32005–32047, 2015Aqueous-phase
mechanism for
isoprene secondary
organic aerosol
E. A. Marais et al.
Title Page
Abstract Introduction
Conclusions References
Tables Figures
◭ ◮
◭ ◮
Back Close
Full Screen / Esc
Printer-friendly Version Interactive Discussion
Discussion
P
a
per
|
Discussion
P
a
per
|
Discussion
P
a
per
|
Discussion
P
a
per
|
low convective cloud layer (1–2 km altitude) over the Southeast US during SEAC
4RS,
supporting our assumption that this pathway is minor.
3
GEOS-Chem simulation and isoprene SOA yields
Several companion papers apply GEOS-Chem to interpret SEAC
4RS and surface data
over the Southeast US in summer 2013 including Kim et al. (2015) for aerosols, Fisher
5
et al. (2015) for organic nitrates, Travis et al. (2015) for ozone and NO
x, and Zhu
et al. (2015) for validation of satellite HCHO data. These studies use a model version
with 0.25
◦×
0.3125
◦horizontal resolution over North America, nested within a 4
◦×
5
◦global simulation. Here we use a 2
◦×
2.5
◦global GEOS-Chem simulation with no
nest-ing. Yu et al. (2015) found little di
ff
erence between 0.25
◦×
0.3125
◦and 2
◦×
2.5
◦reso-10
lutions in simulated regional statistics for isoprene chemistry.
The reader is referred to Kim et al. (2015) for a general presentation of the model
in-cluding evaluation with Southeast US aerosol observations, and to Travis et al. (2015)
and Fisher et al. (2015) for presentation of gas-phase chemistry and comparisons
with observed gas-phase isoprene oxidation products. Isoprene emission is from the
15
MEGAN v2.1 inventory (Guenther et al., 2012). The companion papers decrease
iso-prene emission by 15 % from the MEGAN v2.1 values to fit the HCHO data (Zhu et al.,
2015), but this is not applied here.
Our OA simulation di
ff
ers in several ways from that of Kim et al. (2015). They
as-sumed a fixed 3 % yield of isoprene SOA. The aqueous-phase mechanism coupled
20
to gas-phase isoprene chemistry described in Sect. 2, replacing the semivolatile
re-versible partitioning scheme of Pye et al. (2010), is original to this work. Our resulting
mean isoprene SOA yield for the Southeast US (3.3 %, discussed below) turns out to
be consistent with that assumed by Kim et al. (2015). Kim et al. (2015) included
param-eterizations for formation of anthropogenic and open fire SOA (Hodzic and Jimenez,
25
ACPD
15, 32005–32047, 2015Aqueous-phase
mechanism for
isoprene secondary
organic aerosol
E. A. Marais et al.
Title Page
Abstract Introduction
Conclusions References
Tables Figures
◭ ◮
◭ ◮
Back Close
Full Screen / Esc
Printer-friendly Version Interactive Discussion
Discussion
P
a
per
|
Discussion
P
a
per
|
Discussion
P
a
per
|
Discussion
P
a
per
|
bias. Our omission of anthropogenic and open fire SOA leads to some underestimation
of total OA, as will be discussed below.
Organic aerosol and sulfate contribute most of the aerosol mass over the Southeast
US in summer, while nitrate is much lower (Kim et al., 2015). GEOS-Chem uses the
ISORROPIA thermodynamic model (Fountoukis and Nenes, 2007) to simulate
sulfate-5
nitrate-ammonium (SNA) aerosol composition, water content, and acidity as a
func-tion of local condifunc-tions. Simulated aerosol pH along the SEAC
4RS flight tracks in the
Southeast US boundary layer averages 1.3 (interquartiles 0.92 and 1.8). The aerosol
pH remains below 3 even when sulfate aerosol is fully neutralized by ammonia (Guo
et al., 2015).
10
The rate of gas uptake by the aqueous aerosol is computed with the pseudo-first
order reaction rate constant
k
het(s
−1
) (Schwartz, 1986; Jacob, 2000):
k
het=
∞
Z
0
4
πr
2r
D
g+
4
γω
!
−1n
(
r
)d
r
,
(3)
where
D
gis the gas-phase di
ff
usion constant (taken to be 0.1 cm
2s
−1) and
n
(
r
) is the
number size distribution of aqueous aerosol (cm
−4). We take
n
(
r
) to be the size
distribu-15
tion of sulfate aerosol, making the assumption that all aqueous particles would contain
some sulfate. Clear-sky RH in the Southeast US boundary layer during SEAC
4RS
av-eraged 72
±
17 %, su
ffi
ciently high that sulfate aerosol is expected to be aqueous under
all conditions (Wang et al., 2008).
The sulfate aerosol size distribution including RH-dependent hygroscopic growth
fac-20
tors is from the Global Aerosol Data Set (GADS) of Koepke et al. (1997), as originally
implemented in GEOS-Chem by Martin et al. (2003) and updated by Drury et al. (2010).
The GADS size distribution compares well with observations over the eastern US
in summer (Drury et al., 2010), including for SEAC
4RS (Kim et al., 2015). We
com-pute
n
(
r
) locally in GEOS-Chem by taking the dry SNA mass concentration, converting
25
from mass to volume with a dry aerosol mass density of 1700 kg m
−3ACPD
15, 32005–32047, 2015Aqueous-phase
mechanism for
isoprene secondary
organic aerosol
E. A. Marais et al.
Title Page
Abstract Introduction
Conclusions References
Tables Figures
◭ ◮
◭ ◮
Back Close
Full Screen / Esc
Printer-friendly Version Interactive Discussion
Discussion
P
a
per
|
Discussion
P
a
per
|
Discussion
P
a
per
|
Discussion
P
a
per
|
1998), applying the aerosol volume to the dry sulfate size distribution in GADS, and
then applying the GADS hygroscopic growth factors. We verified that the hygroscopic
growth factors from GADS agree within 10 % with those computed locally from
ISOR-ROPIA.
Figure 2 shows the mean branching ratios for isoprene oxidation in the Southeast
5
US boundary layer as calculated by GEOS-Chem. 87 % of isoprene reacts with OH,
8 % with ozone, and 5 % with NO
3. Oxidation of isoprene by OH produces ISOPO
2of
which 51 % react with NO (high-NO
xpathway), 35 % react with HO
2, 8 % isomerize,
and 6 % react with other RO
2radicals.
Glyoxal is an aerosol precursor common to all isoprene
+
OH pathways in our
10
mechanism with yields of 7 mol % from the ISOPO
2+
NO pathway, 6 mol % from
ISOPO
2+
HO
2, 11 mol % from ISOPO
2+
RO
2, and 25 mol % from ISOPO
2isomeriza-tion. For the Southeast US conditions we thus find that 44 % of glyoxal is from the
ISOPO
2+
NO pathway, 24 % from ISOPO
2+
HO
2, 8 % from ISOPO
2+
RO
2, and 24 %
from ISOPO
2isomerization.
15
The mean total yield of isoprene SOA computed in GEOS-Chem for the Southeast
US boundary layer is 3.3 %, as shown in Fig. 2. IEPOX contributes 1.9 % and glyoxal
0.9 %. The low-NO
xpathway involving ISOPO
2reaction with HO
2contributes 73 % of
the total isoprene SOA yield, mostly from IEPOX, even though this pathway is only
35 % of the fate of ISOPO
2. The high-NO
xpathway contributes 16 % of isoprene SOA,
20
mostly from glyoxal. MEPOX contribution to isoprene SOA is small (2 %) and
consis-tent with a recent laboratory study that finds low SOA yields from this pathway under
humid conditions (Nguyen et al., 2015a). The minor low-NO
xpathways from ISOPO
2isomerization and reaction with RO
2contribute 8 % of isoprene SOA through glyoxal.
The remainder of isoprene SOA formation (3 %) is from nighttime oxidation by NO
3.
25
ACPD
15, 32005–32047, 2015Aqueous-phase
mechanism for
isoprene secondary
organic aerosol
E. A. Marais et al.
Title Page
Abstract Introduction
Conclusions References
Tables Figures
◭ ◮
◭ ◮
Back Close
Full Screen / Esc
Printer-friendly Version Interactive Discussion
Discussion
P
a
per
|
Discussion
P
a
per
|
Discussion
P
a
per
|
Discussion
P
a
per
|
of IEPOX and glyoxal against gas-phase photochemical loss average 1.6 and 2.3 h
respectively for SEAC
4RS daytime conditions; mean lifetimes against reactive uptake
by aerosol are 31 and 20 h, respectively. For both species, aerosol uptake is a minor
sink competing with gas-phase photochemical loss. The model boundary-layer yield of
IEPOX SOA from IEPOX is 5 %, consistent with average yields from chamber
experi-5
ments (4–10 %) for aerosols with similar acidity to aerosols in the Southeast US (Riedel
et al., 2015).
The dominance of gas-phase loss over aerosol uptake for both IEPOX and glyoxal
implies that isoprene SOA formation is highly sensitive to their reactive uptake
prob-abilities
γ
and to the aqueous aerosol mass concentration (in both cases,
γ
is small
10
enough that uptake is controlled by bulk aqueous-phase rather than surface reactions).
We find under SEAC
4RS conditions that
γ
for IEPOX is mainly controlled by aerosol
free acidity (
k
H+[H
+] in Eq. 2), with little contribution from nucleophile-driven and HSO
−4-driven channels. This will be discussed below in comparing to SOAS and SEAC
4RS
observations.
15
The 3.3 % mean yield of isoprene SOA from our mechanism is consistent with the
fixed yield of 3 % assumed by Kim et al. (2015) in their GEOS-Chem simulation of the
SEAC
4RS period, including extensive comparisons to OA observations that showed
a 40 % mean contribution of isoprene to total OA. We conducted a sensitivity
simula-tion using the default isoprene SOA mechanism in GEOS-Chem based on reversible
20
partitioning of semivolatile oxidation products onto pre-existing OA (Pye et al., 2010).
The isoprene SOA yield in that simulation was only 1.1 %. The observed correlation of
OA with HCHO in SEAC
4RS supports our higher yield, as shown below.
4
Evaluation with observational constraints on isoprene SOA
Isoprene is the largest source of HCHO in the Southeast US (Millet et al., 2006), and
25
ACPD
15, 32005–32047, 2015Aqueous-phase
mechanism for
isoprene secondary
organic aerosol
E. A. Marais et al.
Title Page
Abstract Introduction
Conclusions References
Tables Figures
◭ ◮
◭ ◮
Back Close
Full Screen / Esc
Printer-friendly Version Interactive Discussion
Discussion
P
a
per
|
Discussion
P
a
per
|
Discussion
P
a
per
|
Discussion
P
a
per
|
from an Aerodyne Aerosol Mass Spectrometer (HR-ToF-AMS; DeCarlo et al., 2006;
Canagaratna et al., 2007) concurrent with HCHO from a laser-induced fluorescence
instrument (ISAF; Cazorla et al., 2015). Column HCHO was also measured during
SEAC
4RS from the OMI satellite instrument (Abad et al., 2015; Zhu et al., 2015),
pro-viding a proxy for isoprene emission (Palmer et al., 2003, 2006).
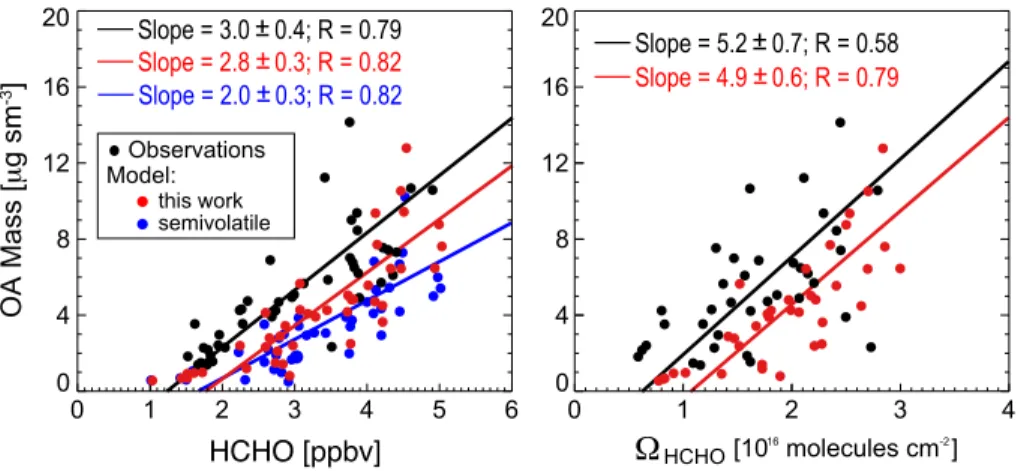
5
Figure 3 (left) shows the observed and simulated relationships between OA and
HCHO mixing ratios in the boundary layer. There is a strong correlation in the
ob-servations and in the model (
R
=
0.79 and
R
=
0.82, respectively). OA simulated
with our aqueous-phase isoprene SOA mechanism reproduces the observed slope
(2.8
±
0.3 µg s m
−3ppbv
−1, vs. 3.0
±
0.4 µg s m
−3ppbv
−1in the observations). Similarly
10
strong correlations and consistency between model and observations are found with
column HCHO measured from OMI (Fig. 3, right).
Also shown in Fig. 3 is a sensitivity simulation with the default GEOS-Chem
mechanism based on reversible partitioning with pre-existing organic aerosol (Pye
et al., 2010) and producing a 1.1 % mean isoprene SOA yield, as compared to
15
3.3 % in our simulation with the aqueous-phase mechanism. That sensitivity
simula-tion shows the same OA-HCHO correlasimula-tion (
R
=
0.82) but underestimates the slope
(2.0
±
0.3 µg s m
−3ppbv
−1). The factor of 3 increase in our isoprene SOA yield does not
induce an equivalent response in the slope, as isoprene contributes only
∼
40 % of OA
in the Southeast US. But the slope is sensitive to the isoprene SOA yield, and the good
20
agreement between our simulation and observations supports our estimate of a mean
3.3 % yield for the Southeast US.
Figure 3 shows an o
ff
set between the model and observations illustrated by the
regression lines. We overestimate HCHO by 0.4 ppbv on average because we did not
apply the 15 % downward correction to MEGAN v2.1 isoprene emissions (Zhu et al.,
25
ACPD
15, 32005–32047, 2015Aqueous-phase
mechanism for
isoprene secondary
organic aerosol
E. A. Marais et al.
Title Page
Abstract Introduction
Conclusions References
Tables Figures
◭ ◮
◭ ◮
Back Close
Full Screen / Esc
Printer-friendly Version Interactive Discussion
Discussion
P
a
per
|
Discussion
P
a
per
|
Discussion
P
a
per
|
Discussion
P
a
per
|
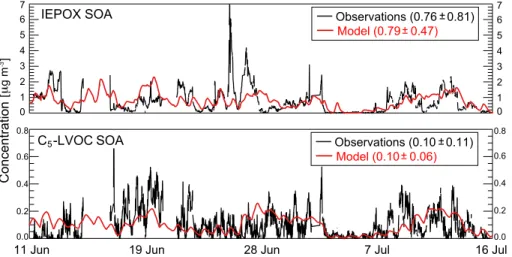
Figure 4 shows time series of the isoprene SOA components IEPOX SOA and
C
5-LVOC SOA at Centreville, Alabama during SOAS. AMS observations from Hu
et al. (2015) and Krechmer et al. (2015) are compared to model values. IEPOX SOA
and C
5-LVOC SOA are on average 17 and 2 % of total AMS OA, respectively (Hu et al.,
2015; Krechmer et al., 2015). The model reproduces the observations without bias,
5
supporting the conclusion that IEPOX is the dominant contributor to isoprene SOA in
the Southeast US (Fig. 2). Low values on 2–7 July, both in the observations and the
model, are due to low temperatures suppressing isoprene emission.
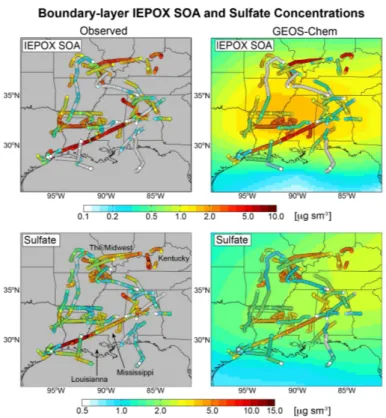
Figure 5 shows the relationships of daily mean IEPOX SOA and sulfate
concen-trations at Centreville and in the SEAC
4RS boundary layer. The same factor analysis
10
method was used to derive IEPOX SOA in SEAC
4RS as in SOAS, however the
uncer-tainty is larger for the aircraft observations due to the much wider range of conditions
encountered. There is a strong correlation between IEPOX SOA and sulfate, both in
observations and the model, with similar slopes. Correlation between IEPOX SOA and
sulfate has similarly been observed at numerous Southeast US monitoring sites
(Bud-15
isulistiorini et al., 2013, 2015; Xu et al., 2015; Hu et al., 2015). Xu et al. (2015)
con-cluded that IEPOX SOA must form by acid-catalyzed nucleophilic addition of sulfate
(sulfate channels in Eq. 2) leading to organosulfates. However, we find in our model
that the H
+-catalyzed channel (
k
H+[H
+] term in Eq. 2) contributes on average 90 %
of IEPOX SOA formation, and that sulfate channels play only a minor role. Thus the
20
correlation of IEPOX SOA and sulfate is not an indication of organosulfate formation
but rather reflects the correlation of sulfate with aqueous aerosol volume and
acid-ity. Liao et al. (2015) similarly observed that aerosol acidity and aerosol volume, rather
than aerosol sulfate, modulate formation of IEPOX organosulfates in the Southeast US.
Measurements from the PALMS laser mass spectrometer during SEAC
4RS (Liao et al.,
25
ACPD
15, 32005–32047, 2015Aqueous-phase
mechanism for
isoprene secondary
organic aerosol
E. A. Marais et al.
Title Page
Abstract Introduction
Conclusions References
Tables Figures
◭ ◮
◭ ◮
Back Close
Full Screen / Esc
Printer-friendly Version Interactive Discussion
Discussion
P
a
per
|
Discussion
P
a
per
|
Discussion
P
a
per
|
Discussion
P
a
per
|
Formation of IEPOX SOA is nearly linear with
k
hetin Eq. (3) as aqueous aerosol
is only a minor sink for IEPOX. IEPOX
γ
is su
ffi
ciently small (Table 2) that gas-phase
di
ff
usion and mass accommodation are not limiting processes.
k
aqin Eq. (2) is
domi-nated by the
k
H+[H
+] term as discussed above. It follows from combination of Eq. (1),
(2), and (3) that IEPOX SOA formation is proportional to
V
[H
+], where
V
is the
vol-5
ume concentration of aqueous aerosol. Increasing sulfate increases both
V
and [H
+],
explaining the correlation between IEPOX SOA and sulfate.
Correlation between IEPOX SOA and sulfate is also apparent in the spatial
distribu-tion of IEPOX SOA, as observed by the SEAC
4RS aircraft below 2 km and simulated
by GEOS-Chem along the aircraft flight tracks (Fig. 6). The correlation between
simu-10
lated and observed IEPOX SOA in Fig. 6 is
R
=
0.70. Average (mean) IEPOX SOA is
1.4
±
1.4 µg s m
−3in the observations and 1.3
±
1.2 µg s m
−3in the model. The
correla-tion between IEPOX SOA and sulfate is 0.66 in the observacorrela-tions and 0.77 in the model.
IEPOX SOA concentrations are highest in the industrial Midwest and Kentucky, and in
Louisiana-Mississippi, coincident with the highest sulfate concentrations sampled on
15
the flights. We also see in Fig. 6 frequent observations of very low IEPOX SOA (less
than 0.4 µg s m
−3) that are well captured by the model. These are associated with very
low sulfate (less than 1 µg s m
−3) leading to high pH and low aerosol volume
concen-tration that have a compounding e
ff
ect on suppressing IEPOX SOA formation.
The mean IEPOX SOA concentration simulated by the model for the SEAC
4RS
pe-20
riod (background contours in Fig. 6) is far more uniform than IEPOX SOA simulated
along the flight tracks, illustrating the importance of day-to-day variations in sulfate in
driving IEPOX SOA variability. IEPOX SOA contributed on average 24 % of total OA
in the SEAC
4RS observations, 28 % in GEOS-Chem sampled along the flight tracks,
and as a regional mean. With IEPOX SOA accounting for 58 % of isoprene SOA in the
25
ACPD
15, 32005–32047, 2015Aqueous-phase
mechanism for
isoprene secondary
organic aerosol
E. A. Marais et al.
Title Page
Abstract Introduction
Conclusions References
Tables Figures
◭ ◮
◭ ◮
Back Close
Full Screen / Esc
Printer-friendly Version Interactive Discussion
Discussion
P
a
per
|
Discussion
P
a
per
|
Discussion
P
a
per
|
Discussion
P
a
per
|
5
E
ff
ect of anthropogenic emission reductions
The EPA projects that US anthropogenic emissions of NO
xand SO
2will decrease
respectively by 34 and 48 % from 2013 to 2025 (EPA, 2014). We conducted a
GEOS-Chem sensitivity simulation to examine the e
ff
ect of these changes on isoprene SOA,
assuming no other changes and further assuming that the emission decreases are
5
uniform across the US.
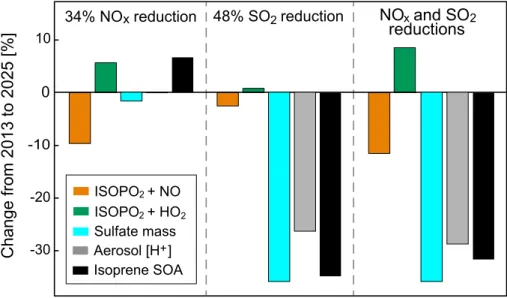
Figure 7 shows the individual and combined e
ff
ects of NO
xand SO
2emission
reduc-tions on the branching pathways for isoprene oxidation, sulfate mass concentration,
aerosol pH, and isoprene SOA in the Southeast US boundary layer in summer.
Re-ducing NO
xemission by 34 % decreases the mean NO concentration by only 23 %, in
10
part because decreasing OH increases the NO
xlifetime and in part because
decreas-ing ozone increases the NO
/
NO
2ratio. There is no change in HO
2. We find a 10 %
decrease in the high-NO
xpathway and a 6 % increase in the low-NO
xpathway
involv-ing ISOPO
2+
HO
2. Aerosol sulfate decreases by 2 % and there is no change in [H
+].
The net e
ff
ect is a 7 % increase in isoprene SOA, as the major individual components
15
IEPOX SOA and glyoxal SOA increase by 17 % and decrease by 8 %, respectively.
A 48 % decrease in SO
2emissions drives a 36 % reduction in sulfate mass
con-centration, leading to a decline in aerosol volume (31 %) that reduces uptake of all
isoprene SOA precursors. The decrease in aerosol [H
+] (26 %) further reduces IEPOX
uptake. Isoprene SOA mass concentration decreases by 35 % as IEPOX SOA and
gly-20
oxal SOA decrease by 45 and 26 %, respectively. Pye et al. (2013) included uptake of
IEPOX to aqueous aerosols in a regional chemical transport model and similarly found
that SO
2emissions are more e
ff
ective than NO
xemissions at reducing IEPOX SOA in
the Southeast US. Remarkably, we find that reducing SO
2emissions decreases sulfate
and isoprene SOA with similar e
ff
ectiveness (Fig. 7). With sulfate contributing
∼
30 %
25
of present-day PM
2.5in the Southeast US and isoprene SOA contributing
∼
25 % (Kim
et al., 2015), this represents a factor of 2 co-benefit on PM
2.5from reducing SO
2ACPD
15, 32005–32047, 2015Aqueous-phase
mechanism for
isoprene secondary
organic aerosol
E. A. Marais et al.
Title Page
Abstract Introduction
Conclusions References
Tables Figures
◭ ◮
◭ ◮
Back Close
Full Screen / Esc
Printer-friendly Version Interactive Discussion
Discussion
P
a
per
|
Discussion
P
a
per
|
Discussion
P
a
per
|
Discussion
P
a
per
|
Summertime OA and sulfate concentrations in the Southeast declined from 2003 to
2013 at rates of 3.9 % a
−1and 7.4 % a
−1, respectively, while wintertime OA showed
no significant decrease (Kim et al., 2015). With isoprene accounting for 40 % of OA
in summer (Kim et al., 2015), and assuming no trend in other OA components on
the basis of the wintertime data, we would infer a rate of isoprene SOA decrease of
5
9.8 % a
−1. The observed trends thus seem to support a similar relative rate of decrease
of sulfate and isoprene SOA over the past decade.
6
Conclusions
Standard mechanisms for formation of isoprene secondary organic aerosol (SOA) in
chemical transport models assume reversible partitioning of isoprene oxidation
prod-10
ucts to pre-existing dry OA. This may be appropriate for dry conditions in experimental
chambers but not for typical atmospheric conditions where the aerosol is mostly
aque-ous. Here we developed an aqueous-phase reactive uptake mechanism coupled to
a detailed gas-phase isoprene chemistry mechanism to describe the irreversible
up-take of water-soluble isoprene oxidation products to aqueous aerosol. We applied this
15
mechanism in the GEOS-Chem chemical transport model to simulate surface (SOAS)
and aircraft (SEAC
4RS) observations over the Southeast US in summer 2013.
Our mechanism includes di
ff
erent channels for isoprene SOA formation by the
high-NO
xpathway, when the isoprene peroxy radicals (ISOPO
2) react with NO, and in the
low-NO
xpathway where they react mostly with HO
2. The main SOA precursors are
20
found to be isoprene epoxide (IEPOX) in the low-NO
xpathway and glyoxal in the
high-and low-NO
xpathways. Both of these precursors have dominant gas-phase
photo-chemical sinks, and so their uptake by aqueous aerosol is nearly proportional to the
reactive uptake coe
ffi
cient
γ
and to the aqueous aerosol mass concentration. The
γ
for
IEPOX is mostly determined by the rate of H
+-catalyzed ring opening in the aqueous
25
ACPD
15, 32005–32047, 2015Aqueous-phase
mechanism for
isoprene secondary
organic aerosol
E. A. Marais et al.
Title Page
Abstract Introduction
Conclusions References
Tables Figures
◭ ◮
◭ ◮
Back Close
Full Screen / Esc
Printer-friendly Version Interactive Discussion
Discussion
P
a
per
|
Discussion
P
a
per
|
Discussion
P
a
per
|
Discussion
P
a
per
|
Application of our mechanism to the Southeast US indicates a mean isoprene SOA
yield of 3.3 % on a mass basis. By contrast, a conventional mechanism based on
re-versible uptake of semivolatile isoprene oxidation products yields only 1.1 %.
Simula-tion of the observed relaSimula-tionship of OA with formaldehyde (HCHO) provides support
for our higher yield. We find that the low-NO
xpathway is 5 times more e
ffi
cient than
5
the high-NO
xpathway for isoprene SOA production. Under Southeast US conditions,
IEPOX and glyoxal account respectively for 58 and 28 % of isoprene SOA.
Our model simulates well the observations and variability of IEPOX SOA at the
sur-face and from aircraft. The observations show a strong correlation with sulfate that we
reproduce in the model. This correlation was previously attributed to acid-catalyzed
10
nucleophilic addition of sulfate as mechanism for IEPOX SOA formation but we find
in the model that this pathway is minor. We find instead that the correlation of IEPOX
SOA with sulfate is due to the e
ff
ect of sulfate on aerosol pH and volume
concen-tration, increasing IEPOX uptake by the H
+-catalyzed ring-opening mechanism. Low
concentrations of sulfate are associated with very low IEPOX SOA, both in the
obser-15
vations and the model, and we attribute this to the compounding e
ff
ects of low sulfate
on aerosol [H
+] and on aerosol volume.
The US EPA has projected that US NO
xand SO
2emissions will decrease by 34 and
48 % respectively from 2013 to 2025. We find in our model that the NO
xreduction will
increase isoprene SOA by 7 %, reflecting greater importance of the low-NO
xpathway.
20
The SO
2reduction will decrease isoprene SOA by 35 %, due to decreases in both
aerosol [H
+] and volume concentration. The combined e
ff
ect of these two changes is
to decrease isoprene SOA by 32 %, corresponding to a decrease in the isoprene SOA
mass yield from 3.3 to 2.3 %. Decreasing SO
2emissions by 48 % has similar relative
e
ff
ects on sulfate (36 %) and isoprene SOA (35 %). Considering that sulfate presently
25
ACPD
15, 32005–32047, 2015Aqueous-phase
mechanism for
isoprene secondary
organic aerosol
E. A. Marais et al.
Title Page
Abstract Introduction
Conclusions References
Tables Figures
◭ ◮
◭ ◮
Back Close
Full Screen / Esc
Printer-friendly Version Interactive Discussion
Discussion
P
a
per
|
Discussion
P
a
per
|
Discussion
P
a
per
|
Discussion
P
a
per
|
Acknowledgements. We are grateful to the entire NASA SEAC4RS team for their help in the field, in particular Paul Wennberg, John Crounse, Jason St. Clair, and Alex Teng for their CIT-CIMS measurements. Thanks also to Jesse Kroll for assisting in the interpretation of chamber study results. This work was funded by the NASA Tropospheric Chemistry Program, the NASA Air Quality Applied Science Team, and a South African National Research Foundation
Fel-5
lowship and Schlumberger Faculty for the Future Fellowship to EAM. WH, JEK, PCJ, DAD, and JLJ were supported by NASA NNX12AC03G/NNX15AT96G and NSF AGS-1243354. JEK was supported by EPA STAR (FP-91770901-0) and CIRES Fellowships. JAF acknowledges support from a University of Wollongong Vice Chancellor’s Postdoctoral Fellowship. HCHO ob-servations were acquired with support from NASA ROSES SEAC4RS grant NNH10ZDA001N.
10
Although this document has been reviewed by US EPA and approved for publication, it does not necessarily reflect US EPA’s policies or views.
References
Anttila, T., Kiendler-Scharr, A., Tillmann, R., and Mentel, T. F.: On the reactive uptake of gaseous compounds by organic-coated aqueous aerosols: theoretical analysis and
appli-15
cation to the heterogeneous hydrolysis of N2O5, J. Phys. Chem. A, 110, 10435–10443, doi:10.1021/jp062403c, 2006.
Attwood, A. R., Washenfelder, R. A., Brock, C. A., Hu, W., Baumann, K., Campuzano-Jost, P., Day, D. A., Edgerton, E. S., Murphy, D. M., Palm, B. B., McComiskey, A., Wagner, N. L., de Sá, S. S., Ortega, A., Martin, S. T., Jimenez, J. L., and Brown, S. S.: Trends in sulfate and
20
organic aerosol mass in the Southeast US: impact on aerosol optical depth and radiative forcing, Geophys. Res. Lett., 41, 7701–7709, doi:10.1002/2014gl061669, 2014.
Bates, K. H., Crounse, J. D., St. Clair, J. M., Bennett, N. B., Nguyen, T. B., Seinfeld, J. H., Stoltz, B. M., and Wennberg, P. O.: Gas phase production and loss of isoprene epoxydiols, J. Phys. Chem. A, 118, 1237–1246, doi:10.1021/jp4107958, 2014.
25
Brégonzio-Rozier, L., Giorio, C., Siekmann, F., Pangui, E., Morales, S. B., Temime-Roussel, B., Gratien, A., Michoud, V., Cazaunau, M., DeWitt, H. L., Tapparo, A., Monod, A., and Doussin, J.-F.: Secondary Organic Aerosol formation from isoprene photooxidation during cloud condensation–evaporation cycles, Atmos. Chem. Phys. Discuss., 15, 20561–20596, doi:10.5194/acpd-15-20561-2015, 2015.
ACPD
15, 32005–32047, 2015Aqueous-phase
mechanism for
isoprene secondary
organic aerosol
E. A. Marais et al.
Title Page
Abstract Introduction
Conclusions References
Tables Figures
◭ ◮
◭ ◮
Back Close
Full Screen / Esc
Printer-friendly Version Interactive Discussion
Discussion
P
a
per
|
Discussion
P
a
per
|
Discussion
P
a
per
|
Discussion
P
a
per
|
Brown, S. S., deGouw, J. A., Warneke, C., Ryerson, T. B., Dubé, W. P., Atlas, E., Weber, R. J., Peltier, R. E., Neuman, J. A., Roberts, J. M., Swanson, A., Flocke, F., McKeen, S. A., Brioude, J., Sommariva, R., Trainer, M., Fehsenfeld, F. C., and Ravishankara, A. R.: Noc-turnal isoprene oxidation over the Northeast United States in summer and its impact on reactive nitrogen partitioning and secondary organic aerosol, Atmos. Chem. Phys., 9, 3027–
5
3042, doi:10.5194/acp-9-3027-2009, 2009.
Budisulistiorini, S. H., Canagaratna, M. R., Croteau, P. L., Marth, W. J., Baumann, K., Edger-ton, E. S., Shaw, S. L., Knipping, E. M., Worsnop, D. R., Jayne, J. T., Gold, A., and Sur-ratt, J. D.: Real-time continuous characterization of secondary organic aerosol derived from isoprene epoxydiols in downtown Atlanta, Georgia, using the Aerodyne aerosol chemical
10
speciation monitor, Environ. Sci. Technol., 47, 5686–5694, doi:10.1021/es400023n, 2013. Budisulistiorini, S. H., Li, X., Bairai, S. T., Renfro, J., Liu, Y., Liu, Y. J., McKinney, K. A.,
Mar-tin, S. T., McNeill, V. F., Pye, H. O. T., Nenes, A., Neff, M. E., Stone, E. A., Mueller, S., Knote, C., Shaw, S. L., Zhang, Z., Gold, A., and Surratt, J. D.: Examining the effects of an-thropogenic emissions on isoprene-derived secondary organic aerosol formation during the
15
2013 Southern Oxidant and Aerosol Study (SOAS) at the Look Rock, Tennessee ground site, Atmos. Chem. Phys., 15, 8871–8888, doi:10.5194/acp-15-8871-2015, 2015.
Buxton, G. V., Malone, T. N., and Salmon, G. A.: Oxidation of glyoxal initiated by•OH in oxy-genated aqueous solution, J. Chem. Soc. Faraday T., 93, 2889–2891, doi:10.1039/A701468f, 1997.
20
Canagaratna, M. R., Jayne, J. T., Jimenez, J. L., Allan, J. D., Alfarra, M. R, Zhang, Q., Onasch, T. B., Drewnick, F., Coe, H., Middlebrook, A., Delia, A., Williams, L. R., Trim-born, A. M., Northway, M. J., DeCarlo, P. F., Kolb, C. E., Davidovits, P., Worsnop, D. R.: Chemical and microphysical characterization of ambient aerosols with the Aerodyne Aerosol Mass Spectrometer, Mass Spectrom. Rev., 26, 185–222, doi:10.1002/mas.20115, 2007.
25
Carlton, A. G. and Turpin, B. J.: Particle partitioning potential of organic compounds is highest in the Eastern US and driven by anthropogenic water, Atmos. Chem. Phys., 13, 10203–10214, doi:10.5194/acp-13-10203-2013, 2013.
Carlton, A. G., Wiedinmyer, C., and Kroll, J. H.: A review of Secondary Organic Aerosol (SOA) formation from isoprene, Atmos. Chem. Phys., 9, 4987–5005, doi:10.5194/acp-9-4987-2009,
30
2009.
formalde-ACPD
15, 32005–32047, 2015Aqueous-phase
mechanism for
isoprene secondary
organic aerosol
E. A. Marais et al.
Title Page
Abstract Introduction
Conclusions References
Tables Figures
◭ ◮
◭ ◮
Back Close
Full Screen / Esc
Printer-friendly Version Interactive Discussion
Discussion
P
a
per
|
Discussion
P
a
per
|
Discussion
P
a
per
|
Discussion
P
a
per
|
hyde throughout the troposphere and lower stratosphere, Atmos. Meas. Tech., 8, 541–552, doi:10.5194/amt-8-541-2015, 2015.
Chan, A. W. H., Chan, M. N., Surratt, J. D., Chhabra, P. S., Loza, C. L., Crounse, J. D., Yee, L. D., Flagan, R. C., Wennberg, P. O., and Seinfeld, J. H.: Role of aldehyde chemistry and NOx con-centrations in secondary organic aerosol formation, Atmos. Chem. Phys., 10, 7169–7188,
5
doi:10.5194/acp-10-7169-2010, 2010.
Cole-Filipiak, N. C., O’Connor, A. E., and Elrod, M. J.: Kinetics of the hydrolysis of atmospher-ically relevant isoprene-derived hydroxy epoxides, Environ. Sci. Technol., 44, 6718–6723, doi:10.1021/es1019228, 2010.
Darer, A. I., Cole-Filipiak, N. C., O’Connor, A. E., and Elrod, M. J.: Formation and stability of
10
atmospherically relevant isoprene-derived organosulfates and organonitrates, Environ. Sci. Technol., 45, 1895–1902, doi:10.1021/es103797z, 2011.
DeCarlo, P. F., Kimmel, J. R. Trimborn, A., Northway, M. J., Jayne, J. T., Aiken, A. C., Gonin, M., Fuhrer, K., Horvath, T., Docherty, K. S., Worsnop, D. R., and Jimenez, J. L.: Field-deployable, High-Resolution, Time-of-Flight Aerosol Mass Spectrometer, Anal. Chem., 78, 8281–8289,
15
doi:10.1021/ac061249n, 2006.
Dommen, J., Metzger, A., Duplissy, J., Kalberer, M., Alfarra, M. R., Gascho, A., Weingart-ner, E., Prévôt, A. S. H., Verheggen, B., and Baltensperger, U.: Laboratory observation of oligomers in the aerosol from isoprene/NOxphotooxidation, Geophys. Res. Lett., 33, L13805, doi:10.1029/2006gl026523, 2006.
20
Donahue, N. M., Robinson, A. L., Stanier, C. O., and Pandis, S. N.: Coupled partitioning, di-lution, and chemical aging of semivolatile organics, Environ. Sci. Technol., 40, 2635–2643, doi:10.1021/es052297c, 2006.
Drury, E., Jacob, D. J., Spurr, R. J. D., Wang, J., Shinozuka, Y., Anderson, B. E., Clarke, A. D., Dibb, J., McNaughton, C., and Weber, R.: Synthesis of satellite (MODIS), aircraft (ICARTT),
25
and surface (IMPROVE, EPA-AQS, AERONET) aerosol observations over eastern North America to improve MODIS aerosol retrievals and constrain surface aerosol concentrations and sources, J. Geophys. Res., 115, D14204, doi:10.1029/2009jd012629, 2010.
Eddingsaas, N. C., VanderVelde, D. G., and Wennberg, P. O.: Kinetics and products of the acid-catalyzed ring-opening of atmospherically relevant butyl epoxy alcohols, J. Phys. Chem. A,
30
114, 8106–8113, doi:10.1021/jp103907c, 2010.
![Table 1. Constants for reactive uptake of isoprene SOA precursors a . Species b H ∗ [M atm −1 ] k H + [M −1 s −1 ] k nuc [M −2 s −1 ] k HSO −](https://thumb-eu.123doks.com/thumbv2/123dok_br/18162458.328957/35.918.52.656.190.315/table-constants-reactive-uptake-isoprene-soa-precursors-species.webp)