ACPD
13, 15333–15375, 2013PTR-TOF-MS measurements and
MEGAN 2.1 model results
L. Kaser et al.
Title Page
Abstract Introduction
Conclusions References
Tables Figures
◭ ◮
◭ ◮
Back Close
Full Screen / Esc
Printer-friendly Version Interactive Discussion
Discussion
P
a
per
|
Di
scussion
P
a
per
|
Discussion
P
a
per
|
Discussi
on
P
a
per
|
Atmos. Chem. Phys. Discuss., 13, 15333–15375, 2013 www.atmos-chem-phys-discuss.net/13/15333/2013/ doi:10.5194/acpd-13-15333-2013
© Author(s) 2013. CC Attribution 3.0 License.
Atmospheric Chemistry and Physics
Open Access
Discussions
Geoscientific Geoscientific
Geoscientific Geoscientific
This discussion paper is/has been under review for the journal Atmospheric Chemistry and Physics (ACP). Please refer to the corresponding final paper in ACP if available.
Undisturbed and disturbed above canopy
ponderosa pine emissions: PTR-TOF-MS
measurements and MEGAN 2.1 model
results
L. Kaser1,2, T. Karl2,*, A. Guenther2, M. Graus3,4, R. Schnitzhofer1, A. Turnipseed2, L. Fischer1, P. Harley2, M. Madronich2, D. Gochis5, F. N. Keutsch6, and A. Hansel1
1
Institute for Ion Physics and Applied Physics, University of Innsbruck, Innsbruck, Austria
2
Atmospheric Chemistry Division, National Center for Atmospheric Research, Boulder, CO, USA
3
Chemical Sciences Division, NOAA Earth System Research Laboratory, Boulder, CO, USA
4
Cooperative Institute for Research in Environmental Sciences (CIRES), University of Colorado, Boulder, CO, USA
5
Research Application Laboratory, National Center for Atmospheric Research, Boulder, CO, USA
6
Department of Chemistry, University of Wisconsin-Madison, Madison, WI, USA
*
ACPD
13, 15333–15375, 2013PTR-TOF-MS measurements and
MEGAN 2.1 model results
L. Kaser et al.
Title Page
Abstract Introduction
Conclusions References
Tables Figures
◭ ◮
◭ ◮
Back Close
Full Screen / Esc
Printer-friendly Version Interactive Discussion
Discussion
P
a
per
|
Di
scussion
P
a
per
|
Discussion
P
a
per
|
Discussi
on
P
a
per
|
Received: 16 May 2013 – Accepted: 17 May 2013 – Published: 11 June 2013
Correspondence to: A. Hansel (armin.hansel@uibk.ac.at)
ACPD
13, 15333–15375, 2013PTR-TOF-MS measurements and
MEGAN 2.1 model results
L. Kaser et al.
Title Page
Abstract Introduction
Conclusions References
Tables Figures
◭ ◮
◭ ◮
Back Close
Full Screen / Esc
Printer-friendly Version Interactive Discussion
Discussion
P
a
per
|
Di
scussion
P
a
per
|
Discussion
P
a
per
|
Discussi
on
P
a
per
|
Abstract
We present the first eddy covariance flux measurements of volatile organic compounds (VOCs) using a proton-transfer-reaction time-of-flight mass-spectrometer (PTR-TOF-MS) above a ponderosa pine forest in Colorado, USA. The high mass resolution of the PTR-TOF-MS enabled the identification of chemical sum formulas. During a 30 day 5
measurement period in August and September 2010, 649 different ion mass peaks
were detected in the ambient air mass spectrum (including primary ions and mass cal-ibration compounds). Eddy covariance with the vertical wind speed was calculated for all ion mass peaks. On a typical day, 17 ion mass peaks including protonated parent compounds, their fragments and isotopes as well as VOC-H+-water clusters 10
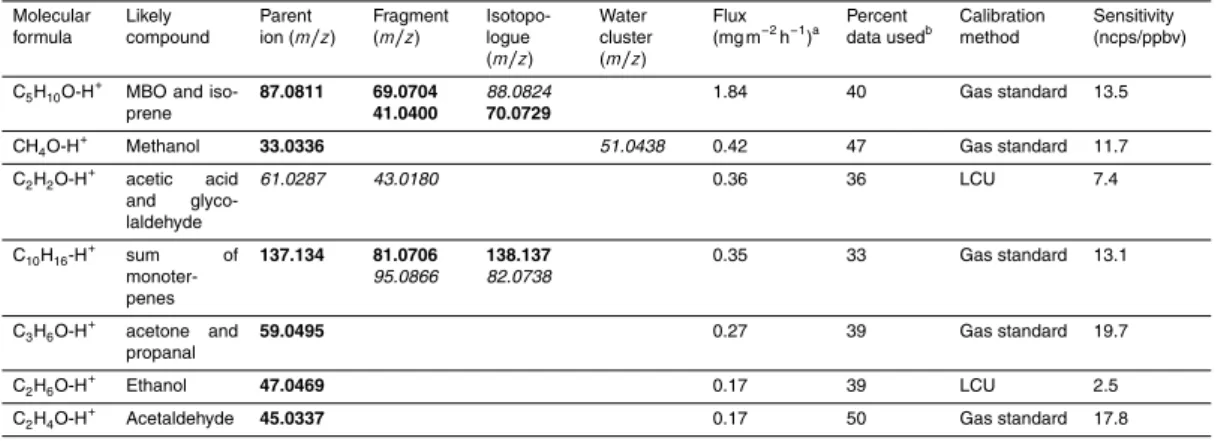
showed a significant flux with daytime average emissions above a reliable flux thresh-old of 0.1 mg compound m−2h−1. These ion mass peaks could be assigned to seven compound classes. The main flux contributions during daytime (10:00–18:00 LT) are attributed to the sum of 2-methyl-3-buten-2-ol (MBO) and isoprene (50 %), methanol (12 %), the sum of acetic acid and glycolaldehyde (10 %) and the sum of monoterpenes 15
(10 %). The total MBO+isoprene flux was composed of 10 % isoprene and 90 % MBO.
There was good agreement between the light and temperature dependency of the sum of MBO and isoprene observed for this work and those of earlier studies. The above canopy flux measurements of the sum of MBO and isoprene and the sum of monoterpenes were compared to emissions calculated using the Model of Emissions of 20
Gases and Aerosols from Nature (MEGAN 2.1). The best agreement between MEGAN 2.1 and measurements was reached using emission factors determined from site spe-cific leaf cuvette measurements. While the modelled and measured MBO+isoprene
fluxes agree well the emissions of the sum of monoterpenes is underestimated by MEGAN 2.1. This is expected as some factors impacting monoterpene emissions, 25
ACPD
13, 15333–15375, 2013PTR-TOF-MS measurements and
MEGAN 2.1 model results
L. Kaser et al.
Title Page
Abstract Introduction
Conclusions References
Tables Figures
◭ ◮
◭ ◮
Back Close
Full Screen / Esc
Printer-friendly Version Interactive Discussion
Discussion
P
a
per
|
Di
scussion
P
a
per
|
Discussion
P
a
per
|
Discussi
on
P
a
per
|
After a severe hailstorm event, 22 ion mass peaks (attributed to six compound classes plus some unknown compounds) showed an elevated flux for the two fol-lowing days. The sum of monoterpene emissions was 4–23 times higher compared to emissions prior to the hailstorm while MBO emissions remained unchanged. If one heavy storm occurs at this site every month we calculate that the monthly monoterpene 5
emissions (in mg compound m−2) would be underestimated by 40 % if this disturbance source is not considered.
1 Introduction
A great variety of Volatile Organic Compounds (VOCs) is continuously emitted into the atmosphere by pyrogenic, anthropogenic and biogenic sources. Due to their central 10
role in tropospheric ozone chemistry and their ability to form aerosols, they can influ-ence local and global climate (Koppmann, 2007). Globally, total biogenic VOC sources are considered to be approximately ten times larger than the sum of anthropogenic emissions (Muller, 1992; Olivier et al., 1999; Guenther, 2002; Lamarque et al., 2010). While terpenoids such as hemiterpenes, monoterpenes and sesquiterpenes are an 15
important fraction of biogenic VOCs (BVOCs), other compounds such as oxygenated compounds (methanol, acetone, acetaldehyde) also exhibit significant emissions from the biosphere (Fowler et al., 2009 and references therein). In the last decade, BVOC emissions from the biosphere have been measured using proton-transfer-reaction mass-spectrometer (PTR-MS) instruments, which allow monitoring a selected set of 20
ion mass peaks that are related to different compounds based on disjunct eddy
covari-ance flux measurements (e.g., Karl et al., 2002). The recent development of a proton-transfer-reaction time-of-flight mass-spectrometer (PTR-TOF-MS) (Jordan et al., 2009; Graus et al., 2010) enables measurements of the entire mass spectrum within a frac-tion of a second, allowing 10 Hz eddy covariance measurements over a wide mass 25
ACPD
13, 15333–15375, 2013PTR-TOF-MS measurements and
MEGAN 2.1 model results
L. Kaser et al.
Title Page
Abstract Introduction
Conclusions References
Tables Figures
◭ ◮
◭ ◮
Back Close
Full Screen / Esc
Printer-friendly Version Interactive Discussion
Discussion
P
a
per
|
Di
scussion
P
a
per
|
Discussion
P
a
per
|
Discussi
on
P
a
per
|
for flux measurements above grassland (Müller et al., 2010; Ruuskanen et al., 2011; Bamberger et al., 2011) and above a citrus plantation (Park et al., 2013). Ruuskanen et al. (2011) and Park et al. (2013) report fluxes (emissions and depositions) for up to 30 (27) different ion mass peaks corresponding to a dozen different VOC species. Müller
et al. (2010) and Park et al. (2013) evaluated eddy covariance measurements by PTR-5
TOF-MS by comparing with the well-established disjunct eddy covariance technique using PTR-MS. Both studies showed good agreement between the two techniques.
Ponderosa pine forest BVOC fluxes of monoterpenes, 2-methyl-3-buten-2-ol (MBO), methanol, ethanol, acetaldehyde and acetone have been previously measured at a site in the California Sierra Nevadas (Schade et al., 1999; Schade and Goldstein, 2001; Lee 10
et al., 2005). The magnitude and type of compounds emitted by plants is complex de-pending on the species, the age and the health of the vegetation. Effects of short time
variations in temperature, moisture and light levels (Guenther et al., 1995; Kesselmeier and Staudt, 1999; Niinemets et al., 2010a) are better understood. Studies have shown that temperature is the main driver for monoterpene emissions, while both temperature 15
and light are important for MBO emissions. These studies took place in ponderosa pine forests using above canopy relaxed eddy accumulation flux measurements, (Schade and Goldstein, 2001) and leaf level measurements (Harley et al., 1998). These obser-vations are typically used to develop emission models such as the Model of Emissions of Gases and Aerosols from Nature (MEGAN), which uses leaf area index (LAI), light, 20
temperature, humidity, wind speed, soil moisture and average canopy environmental conditions of the past 24 to 240 h to calculate emissions of VOCs from ecosystems to the atmosphere (Guenther et al., 2006, 2012).
Additionally, abiotic and biotic stress factors such as drought, herbivore infesta-tion, severe storms, mechanical wounding, air pollutants, etc. can initially enhance 25
Räisä-ACPD
13, 15333–15375, 2013PTR-TOF-MS measurements and
MEGAN 2.1 model results
L. Kaser et al.
Title Page
Abstract Introduction
Conclusions References
Tables Figures
◭ ◮
◭ ◮
Back Close
Full Screen / Esc
Printer-friendly Version Interactive Discussion
Discussion
P
a
per
|
Di
scussion
P
a
per
|
Discussion
P
a
per
|
Discussi
on
P
a
per
|
nen et al. (2008) and Kim et al. (2011) demonstrated enhanced monoterpene fluxes after mechanical wounding on the ecosystem scale. A few studies also reported en-hanced mixing ratios of monoterpenes and sesquiterpenes after severe storms (Helmig et al., 1998; Bouvier-Braun et al., 2009; Haase et al., 2011; Bamberger et al., 2011). Holzinger et al. (2006) reported increased monoterpene emissions on days following 5
rain events. While temperature and light dependent emissions of VOCs are well under-stood, the prediction of emissions induced by stress factors is complicated (Grote and Niinemets, 2008). The development of emission algorithms to account for ecosystem disturbance in biogenic emission models requires the availability of representative leaf, plant and ecosystem scale measurements (Arneth and Niinemets, 2010). Niinemets 10
et al. (2010b) highlight the importance of measurements in order to reduce model uncertainties related to stress, environmental variability, seasonality and foliage devel-opmental stage.
In this paper we present above canopy flux measurements of light and tempera-ture driven emissions of BVOCs from a ponderosa pine forest during 30 days in Au-15
gust/September 2010. We compare these to emissions calculated with the MEGAN 2.1 model using default parameters and values based on land cover and enclosure measurements at the same site. We also report enhanced BVOC emissions after a se-vere hailstorm, which damaged needles and branches. Our canopy flux measurements serve as a starting point to evaluate the magnitude of these stress driven emission 20
events.
2 Methods
2.1 Field site
VOC eddy covariance measurements were conducted at the Manitou Forest Obser-vatory located in the US Forest Service Manitou Experimental Forest near Woodland 25
ACPD
13, 15333–15375, 2013PTR-TOF-MS measurements and
MEGAN 2.1 model results
L. Kaser et al.
Title Page
Abstract Introduction
Conclusions References
Tables Figures
◭ ◮
◭ ◮
Back Close
Full Screen / Esc
Printer-friendly Version Interactive Discussion
Discussion
P
a
per
|
Di
scussion
P
a
per
|
Discussion
P
a
per
|
Discussi
on
P
a
per
|
Bio-Hydro-Atmosphere Interactions of Energy, Aerosols, Carbon, H2O, Organics and Nitrogen (BEACHON)-Rocky Mountain Organic Carbon Study (ROCS) campaign in summer 2010. The field site has been described in detail elsewhere (see Kim et al., 2010; DiGangi et al., 2011). An extensive overview on VOC concentration measure-ments at this site has been summarized by Kaser et al. (2013). Ponderosa pine trees 5
about 100 yr in age and with an average height of 18.5 m dominate BVOC emissions within the flux footprint. The canopy is open and of varying density. The ground surface is covered by grasses, sage, forbs and exposed cryptogrammic soils. The typical leaf area index (LAI) for tree canopies is 3 and the tree cover fraction is 0.38 resulting in a landscape average LAI at this site of≈1.14.
10
Here we present 30 days of VOC flux measurements between 3 August and 8 September 2010. VOC fluxes were not measured between 25 August–28 August and 31 August–2 September, when the PTR-TOF-MS was used for other measurements.
2.2 Instrumentation and calibration
VOC measurements with 10 Hz time resolution allowing the calculation of eddy covari-15
ance fluxes were conducted on a walk-up chemistry tower at 25.1 m height. A 35 m long unheated teflon line (OD: 3/8 in., 20 SLPM) was mounted 20 cm below the sonic anemometer. VOC volume mixing ratios were measured by a PTR-TOF-MS located at the bottom of the tower in a seacontainer laboratory. Details on the instrument, calibra-tion and instrument performance can be found in Kaser et al. (2013) and will be men-20
tioned here only briefly. The PTR-TOF-MS developed at the University of Innsbruck (Graus et al., 2010) was operated under standard conditions at a drift tube temper-ature of 60◦C, 580 V drift voltage and 2.3 mbar drift tube pressure corresponding to anE/N of 125 Td (E being the electric field strength andN the gas number density; 1 Td=10−17V cm2). The PTR-TOF-MS was calibrated weekly by dynamic dilution of
25
ACPD
13, 15333–15375, 2013PTR-TOF-MS measurements and
MEGAN 2.1 model results
L. Kaser et al.
Title Page
Abstract Introduction
Conclusions References
Tables Figures
◭ ◮
◭ ◮
Back Close
Full Screen / Esc
Printer-friendly Version Interactive Discussion
Discussion
P
a
per
|
Di
scussion
P
a
per
|
Discussion
P
a
per
|
Discussi
on
P
a
per
|
and methyl ethyl ketone. Background measurements were conducted by sampling am-bient air through a catalytic converter for 25 min every 7 h. There were no compressed gas standards available for some compounds like acetic acid or ethanol. These com-pounds were calibrated using a gas standard generator, the Liquid Calibration Unit (LCU, Ionimed Analytik, Innsbruck). The LCU uses a liquid standard that can be easily 5
mixed in-house from a targeted substance using volumetric methods. This liquid sam-ple is efficiently vaporized into zero air gas by a nebulizer, producing a calibration gas
stream. The liquid standard and zero air gas flows are both regulated in order to obtain well defined concentrations of VOCs. The evaporation takes place in a heated chamber in order to ensure complete evaporation of the contained compounds. Depending on 10
their solubility in water and their vapor pressure, many compounds can be calibrated from the ppbv to the % range at a humidity between 1 to 50 g m−3 (Fischer et al.,
2013).
Full PTR-TOF-MS mass spectra were recorded up tom/z315 with 10 Hz time res-olution. Mass scale calibration using additionally added di- and trichlorobenzene ion 15
mass peaks was conducted every 6 min. Data evaluation specific to eddy covariance flux calculations was conducted using Matlab (Mathworks, USA) routines, described in detail by Müller et al. (2010) and Ruuskanen et al. (2011).
The three dimensional winds and temperature were measured using a three dimen-sional sonic anemometer CSAT-3 (Campbell Scientific) with 10 Hz resolution. Photo-20
synthetically active radiation (PAR) and air temperature were measured at 27.8 m and 25 m height using a Li190a quantum sensor (Li-Cor, Lincoln, NE) and an HMP35C-2 (Campbell Scientific, Logan, UT) respectively.
Two different types of precipitation measurements were made at the site. The
first sensor used for measuring quantitative total precipitation amounts was an alter-25
ACPD
13, 15333–15375, 2013PTR-TOF-MS measurements and
MEGAN 2.1 model results
L. Kaser et al.
Title Page
Abstract Introduction
Conclusions References
Tables Figures
◭ ◮
◭ ◮
Back Close
Full Screen / Esc
Printer-friendly Version Interactive Discussion
Discussion
P
a
per
|
Di
scussion
P
a
per
|
Discussion
P
a
per
|
Discussi
on
P
a
per
|
signature of hydrometeors impacting the sensor head surface and, for solid particles such as hail, provides a total count of hailstone impacts. Also, a laser ranging sen-sor (Jenoptik, Inc. SHM30 laser snow depth sensen-sor) was also deployed at the site to measure winter snowfall but also can measure hail accumulations on the ground. The sensor suggests that approximately 1.4 cm of hail accumulated on the ground during 5
the main hail event on 4 August 2010 presented below.
2.3 Flux calculation
Eddy covariance fluxes (30 min values) were calculated for 649 ion mass peaks from the 10 Hz PTR-TOF-MS signals and the 10 Hz sonic anemometer data according to Karl et al. (2002) and Ruuskanen et al. (2011). Three dimensional wind data were 10
recorded on a second computer. The two computer clocks drifted relative to each other during the measurement period. The time stamps of the two datasets were corrected accordingly. The three dimensional wind vector was rotated on an 5 hourly basis ac-cording to Wilczak et al. (2001). To detect fluxes among the 649 ion mass peaks, we developed a screening method based on the delay times that occur from the covariance 15
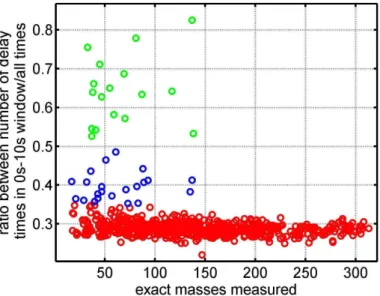
analysis of the individual ion mass peaks and the corresponding vertical wind speed during 30 min time intervals. In order to obtain ion mass peaks that show a significant covariance between the vertical wind and their volume mixing ratio, we allowed the flux calculation routine to choose a maximum or minimum of the covariance peak within a delay time window of max.±20 s. The physically meaningful delay time window (0 to
20
10 s) was defined as the maximum difference between the two computer clocks used
for wind and VOC measurements and the maximum delay time caused by the 35 m long sampling line. We used these delay times to determine ion mass peaks exhibit-ing a significant flux or no flux. For this purpose the fraction of half hour values where the delay time was found in the physically meaningful delay time window between 0 25
to 10 s was used to attribute all ion mass peaks to an individual flux grade. This frac-tion is plotted in Fig. 1. For example the delay time of the exact ion mass peakm/z
69.0704 (C5H
+
ACPD
13, 15333–15375, 2013PTR-TOF-MS measurements and
MEGAN 2.1 model results
L. Kaser et al.
Title Page
Abstract Introduction
Conclusions References
Tables Figures
◭ ◮
◭ ◮
Back Close
Full Screen / Esc
Printer-friendly Version Interactive Discussion
Discussion
P
a
per
|
Di
scussion
P
a
per
|
Discussion
P
a
per
|
Discussi
on
P
a
per
|
MBO (protonated MBO minus H2O) was found 70 % of the time within the 0 to 10 s time window.
Ion mass peaks where the above described fraction was smaller than 35 % do not exhibit a significant covariance between vertical wind and volume mixing ratio and are depicted by red circles. These ion mass peaks exhibit no flux or fluxes that are close 5
to or below the limit of detection for most of the time and are classified as grade C flux. Blue circles depict ion mass peaks for which a physically meaningful covariance between vertical wind and volume mixing ratio can be found for at least 35 % of all measured half hour values. We rank these as grade B fluxes. Green circles were de-fined as ion mass peaks where a physically meaningful delay time was found for more 10
than 50 % of all measured half hour flux values. We rank these as grade A flux ion mass peaks. As a second cut-offcriteria we defined a flux detection limit of >0.1 mg
compound m−2h−1.
3 Results
3.1 Meteorology
15
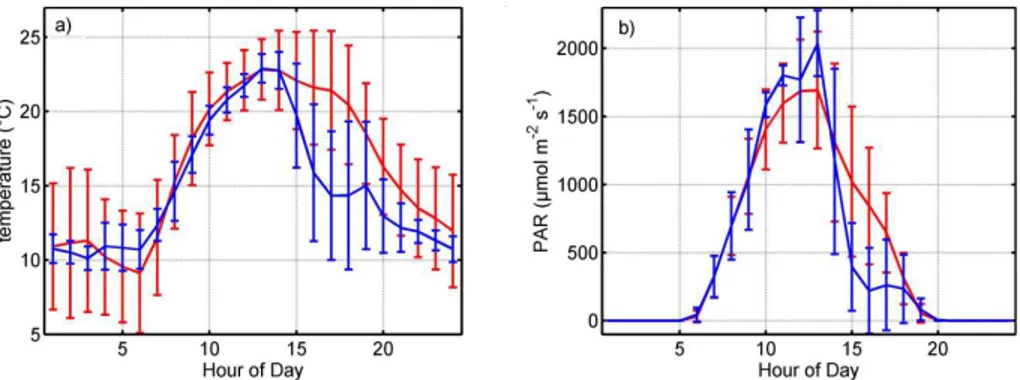
Figure 2 depicts a typical diurnal cycle for temperature and photosynthetically active radiation (PAR) during the VOC flux measurement period. During the 30 days of flux measurements average air temperatures reached a maximum of 23◦C at 1 p.m. (Moun-tain standard time, MST) and a minimum of 9◦C at 6 a.m. (MST).
On average, PAR reaches a maximum of 1700 µmol m−2s−1 at 1 p.m. (MST). Typi-20
ACPD
13, 15333–15375, 2013PTR-TOF-MS measurements and
MEGAN 2.1 model results
L. Kaser et al.
Title Page
Abstract Introduction
Conclusions References
Tables Figures
◭ ◮
◭ ◮
Back Close
Full Screen / Esc
Printer-friendly Version Interactive Discussion
Discussion
P
a
per
|
Di
scussion
P
a
per
|
Discussion
P
a
per
|
Discussi
on
P
a
per
|
cally observed midday maxima of 23◦C and 2000 µmol m−2s−1, respectively, but both decreased rapidly in the afternoon.
Flux data during the hailstorm and the following two days are treated in Sect. 3.5. Estimates of emission factors and discussion of typical fluxes in Sect. 3.3 are based on data after 7 August when the effect of the hailstorm had decreased.
5
Generally the weather changed from some cloudiness and rain during the beginning of the measurement period to dry and sunny at the end of the campaign. Precipitation events with more than 2 mm water occurred only on 27 July (hail), 4 August (hail), 5 August (rain) and 9 August (rain). Maximum daytime temperatures remained similar over the measurement period but night time temperatures decreased gradually from 10
10◦C to 4◦C due to the approaching autumn.
3.2 Footprint and quality control
The flux footprint was calculated using the 90 % flux recovery value according to Hsieh et al. (2000). The canopy height was 18.5 m. The zero plane displacement, 12.7 m, was defined as 2/3 of the average canopy height.
15
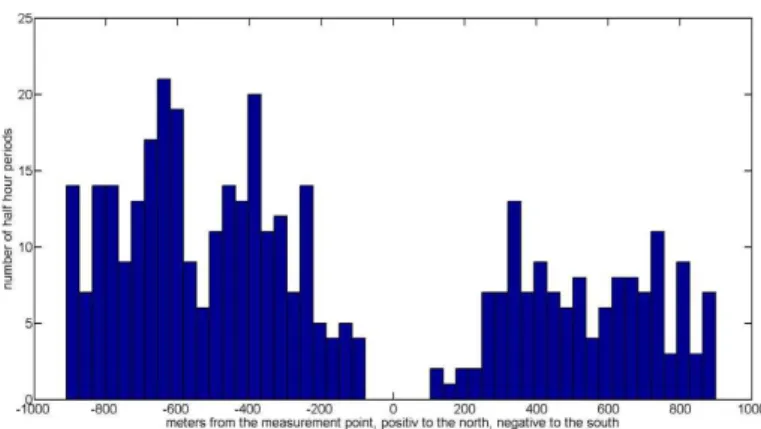
For the momentum roughness height, we used 8 % of the canopy height. The ra-tio between zm (measurement height above the zero plane displacement) and the Obukov length (L) was used to distinguish between stable (zm/L >0) and unstable (zm/L <0) atmospheric conditions. The calculated footprint was <900 m during un-stable conditions (45 % of the measurement time) and<2500 m for stable conditions 20
(55 %). Figure 3 shows the footprint in more detail for unstable atmospheric conditions. Data points are grouped along the main valley wind-direction coming from the north (positive axis: 270◦to 90◦) and from the south (negative axis: 90◦to 270◦).
Quality control for the flux data included some criteria that are mass independent (1–4) as well as mass dependent (5–6). Data were removed if (1) the wind came from 25
ACPD
13, 15333–15375, 2013PTR-TOF-MS measurements and
MEGAN 2.1 model results
L. Kaser et al.
Title Page
Abstract Introduction
Conclusions References
Tables Figures
◭ ◮
◭ ◮
Back Close
Full Screen / Esc
Printer-friendly Version Interactive Discussion
Discussion
P
a
per
|
Di
scussion
P
a
per
|
Discussion
P
a
per
|
Discussi
on
P
a
per
|
calculated footprint was larger than 1850 m (occurring during stable conditions) as the vegetation changes slowly outside this radius; if (3) 30 out of 18 000 wind data points per half hour are outside 5σof the mean; if (4) the third rotation angle exceeded±10 %;
if (5) 30 out of 18 000 VOC volume mixing ratios per half hour are outside 5σ of the mean; if (6) the stationarity test exceeded 60 % (Foken and Wichura, 1996). Depend-5
ing on the individual compound between 33–55 % of all half-hour flux values passed these quality criteria (Table 1). For MBO we calculated a daytime limit of detection of 0.15 mg m−2h−1and an advection flux of 0.07 mg m−2h−1.
3.3 Light and temperature driven emissions
Ion mass peaks showing a significant correlation with the vertical wind component were 10
determined as described in Sect. 2.3. After filtering out all ion mass peaks that (1) are related to primary ions (including those masked by a water flux interference) or (2) do not pass the delay time criterion described in Sect. 2.3 or (3) have an average day-time flux<0.1 mg m−2h−1, we obtain 14 grade A flux ion mass peaks (black) and four grade B flux ion mass peaks (grey). Table 1 lists these ion mass peaks by descend-15
ing flux magnitude grouped by likely compounds. As an example, MBO and isoprene show a flux on the protonated MBO parent mass peak (m/z87.0811), the protonated isoprene and MBO fragment mass peak (m/z69.0704) and the fragment mass peak (m/z41.0400) as well as the isotopes (m/z88.0824,m/z70.0729). After unravelling isotopic patterns and fragments, we obtain seven different compounds or compound
20
classes emitted by this ecosystem during daytime.
Diurnal cycles for all 7 compounds showing a significant flux are depicted in Fig. 4. The emissions are dominated by the sum of MBO and isoprene, accounting for 50 % of the daytime emissions. When using a PTR-TOF-MS operated in H3O+ mode the fragment of protonated MBO exhibits the same ion mass peak as protonated isoprene. 25
ACPD
13, 15333–15375, 2013PTR-TOF-MS measurements and
MEGAN 2.1 model results
L. Kaser et al.
Title Page
Abstract Introduction
Conclusions References
Tables Figures
◭ ◮
◭ ◮
Back Close
Full Screen / Esc
Printer-friendly Version Interactive Discussion
Discussion
P
a
per
|
Di
scussion
P
a
per
|
Discussion
P
a
per
|
Discussi
on
P
a
per
|
the measurements in summer 2010 10 % of the total MBO+isoprene flux can be
at-tributed to isoprene. Other BVOC fluxes include methanol (11 %), the sum of acetic acid and glycolaldehyde (10 %), the sum of monoterpenes (10 %), the sum of acetone and propanal (7 %), ethanol (5 %) and acetaldehyde (5 %). Formaldehyde flux measure-ments published by DiGangi et al. (2011) contribute 2 % of the total observed BVOC 5
emission with a mean daytime emission of 0.08 mg m−2h−1.
As shown by Harley et al. (1998) and Schade et al. (2001) MBO emissions are light (Eq. 1) and temperature (Eq. 2) dependent, and these dependencies are well described by the following expressions.
CL=
α·CL1·L
q
1+α2·L 2
(1) 10
CLis a scalar that accounts for the emission affected by PAR, αandC
L1 are empirical
coefficients andLis PAR.
CT=
Eopt·CT2·eCT1·x CT2−CT1·(1−eCT2x)
, x=
1
Topt−
1
T
R (2)
CT accounts for the emission influenced by temperature.Eopt is the emission capacity
at the temperatureTopt,T the temperature,R the ideal gas constant and CT1,CT2 the
15
empirical coefficients.
To calculate light dependencies, data from a narrow temperature range (e.g. 23– 27◦C) was chosen and the remaining data was binned into 100 µmol m−2s−1 light steps. Similarly for the temperature dependence, only data for which PAR exceeded 1000 µmol m−2s−1was taken and binned into 1◦C temperature windows.
20
ACPD
13, 15333–15375, 2013PTR-TOF-MS measurements and
MEGAN 2.1 model results
L. Kaser et al.
Title Page
Abstract Introduction
Conclusions References
Tables Figures
◭ ◮
◭ ◮
Back Close
Full Screen / Esc
Printer-friendly Version Interactive Discussion
Discussion
P
a
per
|
Di
scussion
P
a
per
|
Discussion
P
a
per
|
Discussi
on
P
a
per
|
emissions increase nearly linearly up to around 1000 µmol m−2s−1 before reaching a plateau. In contrast, canopy scale fluxes are expected to continue to increase with increasing PAR because of the assumption that not all leaves are receiving the full sun-light because they can be shaded by other leaves and because they can be oriented at various angles to the direct solar beam. Against this expectation, our canopy scale 5
light curve and that of Schade et al. (2001) are almost exactly the same as the Harley et al. (1998) leaf level light curve. This could imply that in a relatively open needle leaf canopy such as the ponderosa pine there is no or very little shading of the needles within the canopy. The light dependency used in MEGAN 2.1 assumes shading of the leaves and is therefore not yet reaching saturation at 1000 µmol m−2s−1. A different
10
light dependent behaviour is found for different temperature ranges, shown in Table 3.
From the 4 different temperature ranges (17–19◦C, 19–21◦C, 21–23◦C and 23–27◦C)
the results from 21–23◦C agree best with MEGAN 2.1 and 19–21◦C best with the earlier leaf level and above canopy measurements.
The normalized temperature dependence of our above canopy MBO+isoprene
15
fluxes is shown in Fig. 6 and compared with the Harley et al. (1998) leaf level data and the Schade et al. (2001) canopy scale fluxes. We observe an almost perfect agreement of our measurements with the above canopy measurements from Schade et al. (2001) and MEGAN 2.1 with a steeper increase starting at higher temperatures compared to the enclosure measurements conducted by Harley et al. (1998). This may be caused 20
by a greater difference between air and canopy temperature at high temperature with
high solar irradiance. Table 4 summarizes these results.
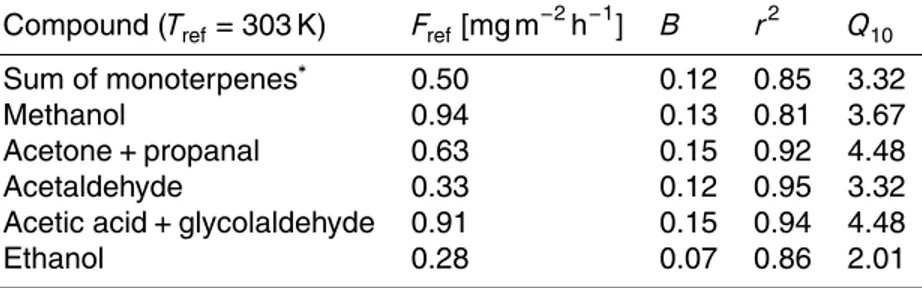
To calculate temperature dependencies of other compounds, PAR values below 1000 µmol m−2s−1were omitted and the remaining data was binned by each degree of temperature. Results for the temperature fit following the curve:FVOC=Fref·exp(β(T−
25
Tref)), where Tref=303 K, Fref the emission atTref and β the empirical coefficient, are
listed in Table 5. Additionally theQ10 temperature coefficient is given as a measure of
ACPD
13, 15333–15375, 2013PTR-TOF-MS measurements and
MEGAN 2.1 model results
L. Kaser et al.
Title Page
Abstract Introduction
Conclusions References
Tables Figures
◭ ◮
◭ ◮
Back Close
Full Screen / Esc
Printer-friendly Version Interactive Discussion
Discussion
P
a
per
|
Di
scussion
P
a
per
|
Discussion
P
a
per
|
Discussi
on
P
a
per
|
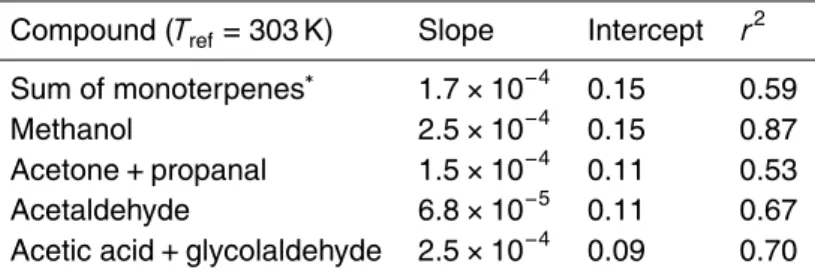
Emission of most compounds discussed so far (except ethanol) also show some light dependence. Whether this is due to stomatal conductance or due to a direct light effect
cannot be distinguished with these measurements. The results of a linear fit through data in a temperature range of 23–27◦C binned in 100 µmol m−2s−1light windows are given in Table 6.
5
3.4 Comparison to MEGAN 2.1 model
The observed above canopy emissions of the sum of MBO and isoprene and the sum of monoterpenes are compared with MEGAN 2.1 model results using the landscape average emission factors based on four different approaches: MEGAN 2.1 Southern
Rockies Conifers (M21SRC, MEGAN 2.1 average value for the region including pon-10
derosa pine woodlands and nearby mixed conifer forests), MEGAN 2.1 ponderosa pine (M21PP, MEGAN 2.1 value for ponderosa pine woodlands), site specific mea-surements of ponderosa pine (SSLC, measured at MFO using a leaf cuvette), site specific measurements of ponderosa pine (SSBE, measured at MFO using a branch enclosure). Landscape average emission factors are the weighted average of species-15
specific emission factors for all plant species in a landscape. The SSBE and SSLC emission factors use the species composition and vegetation cover fraction observa-tions obtained with ground surveys at the Manitou Forest site. The difference between
them is that the SSBE estimate is based on branch enclosure (Teflon bag) measure-ments and the SSLC estimate is based on leaf cuvette (enclosure using a modified 20
LiCOR 6400) measurements. All of the trees sampled by branch enclosure or leaf cu-vette were within the flux tower footprint. The M21SRC and M21PP emission factors use the same species-specific emission factors (based on literature values including Guenther et al., 1994; Harley et al., 1998; Schade et al., 1999, 2001; Karl et al., 2002) and the same needle leaf tree cover fraction based on Moderate Resolution Imaging 25
Spectroradiometer (MODIS) satellite land cover estimates (see Guenther et al., 2012). The difference is in the species composition estimated for the Manitou Forest site by
ACPD
13, 15333–15375, 2013PTR-TOF-MS measurements and
MEGAN 2.1 model results
L. Kaser et al.
Title Page
Abstract Introduction
Conclusions References
Tables Figures
◭ ◮
◭ ◮
Back Close
Full Screen / Esc
Printer-friendly Version Interactive Discussion
Discussion
P
a
per
|
Di
scussion
P
a
per
|
Discussion
P
a
per
|
Discussi
on
P
a
per
|
for the Southern Rocky Conifer land cover type in the United States Environmental Protection Agency (USEPA) Ecoregion scheme which results in a mixed needle leaf tree species distribution that includes Ponderosa and other pine species, Douglas-fir, spruce, and fir trees. The M21PP estimate is based on averaged species composi-tion over the Southern Rocky Mountain Ponderosa Pine Woodland land cover type in 5
the United States Geological Survey Gap Analyzing Program (USGS GAP) land cover scheme. Needle leaf trees in this land cover type are dominated by Ponderosa pine with a small contribution from Douglas-fir, junipers, pinyon pine, and lodgepole pine. The USGS GAP land cover scheme better represents the species composition at the Manitou Forest site. Ambient temperature measured on the chemistry tower at 27 m 10
height as well as a LAI of 3 and a vegetation cover fraction of 0.38 were used as input for MEGAN 2.1. The emission factors of the four different approaches are listed for the
sum of MBO and isoprene and the sum of all reported monoterpenes in Table 7. Figure 7a compares our MBO+isoprene measurements with the four model
emis-sion types. Current BVOC emisemis-sion models assume that ponderosa pine emits only 15
MBO and the isoprene emission factor is assumed to be 0. Measured fluxes are rep-resented well by MEGAN 2.1 using the SSLC emission factor. As shown in Fig. 7b PTR-TOF-MS EC flux measurements and SSLC agree with a slope of 1.07 andR2 of 0.83. The model using the SSBC emission factor is slightly under predicting the mea-surements reaching a slope of 0.7. M21SRC and M21PP based on meamea-surements of 20
ponderosa pine from other sites underestimate the measurements with slopes of 0.24 and 0.41 respectively.
Figure 8 compares the PTR-TOF-MS EC flux measurements of monoterpene emis-sions with the four emission factor approaches. As expected, the hailstorm event (dis-cussed later) is not captured by MEGAN 2.1, using any of the emission types. Addi-25
ACPD
13, 15333–15375, 2013PTR-TOF-MS measurements and
MEGAN 2.1 model results
L. Kaser et al.
Title Page
Abstract Introduction
Conclusions References
Tables Figures
◭ ◮
◭ ◮
Back Close
Full Screen / Esc
Printer-friendly Version Interactive Discussion
Discussion
P
a
per
|
Di
scussion
P
a
per
|
Discussion
P
a
per
|
Discussi
on
P
a
per
|
agree with the measurements. After DOY 240 all emission factor approached agree similarly well with anR2of 0.68 and slopes between 0.57–0.77.
3.5 The hailstorm event
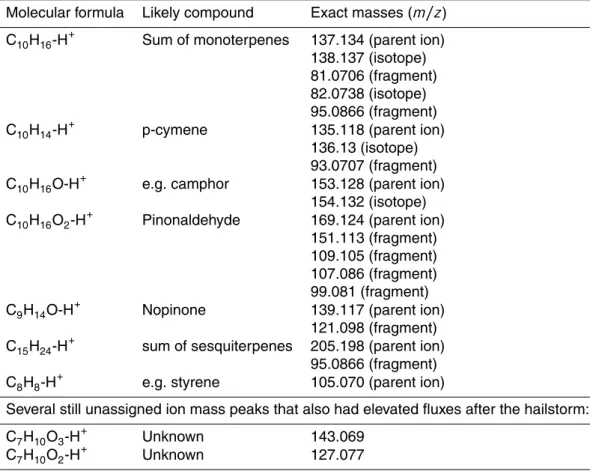
On 4 August a severe hailstorm impacted the site. Hailstones of about 1–3 cm in diam-eter caused damage to needles and branches. As a result, 22 ion mass peaks showed 5
an elevated flux signal. All ion mass peaks are given in Table 8; they are grouped into their likely compound classes and sorted by descending amount of emission. Assign-ments of exact ion mass peaks to compounds/compound classes were made using the work of Kim et al. (2010) and references therein. Especially interesting is that we also observe first order oxidation products of monoterpenes such as pinonaldehyde 10
and nopinone exhibiting an elevated flux after the hailstorm. At this point we cannot determine whether this results from increased in-canopy overall oxidation rates or if this is due to direct emission from the wounded branches and needles.
The sum of monoterpenes shows by far the highest emission with a maximum of 4.75 mg m−2h−1. This corresponds to a 4 times higher maximum flux as observed on 15
the day before the hailstorm. If we use MEGAN 2.1 to calculate the regular (tempera-ture and light) dependent flux on the day after the hailstorm and compare this to the measurements the observed flux is∼23 times higher. This is justified as the
measure-ments on 3 August (day before the hailstorm) might be still influenced from a hailstorm on 27 July. Figure 9 shows the maximum of emission before and after the hailstorm 20
(3 August and 5 August) for all compounds that show a flux during the 30 day average as well as those which are influenced by the hailstorm. The fluxes of MBO+isoprene
as well as the flux of the sum of monoterpenes are also compared to the expected flux calculated by MEGAN 2.1 based on the emission factors calculated for this work (see Sect. 3.4, Table 7). Elevated monoterpene concentrations and fluxes after mechanical 25
ACPD
13, 15333–15375, 2013PTR-TOF-MS measurements and
MEGAN 2.1 model results
L. Kaser et al.
Title Page
Abstract Introduction
Conclusions References
Tables Figures
◭ ◮
◭ ◮
Back Close
Full Screen / Esc
Printer-friendly Version Interactive Discussion
Discussion
P
a
per
|
Di
scussion
P
a
per
|
Discussion
P
a
per
|
Discussi
on
P
a
per
|
monoterpene emissions by a factor of 4–23 as well as the enhancement of several other compounds such as cymene, camphor, nopinone, pinonaldehyde and the sum of sesquiterpenes. Some compounds such as the sum of sesquiterpenes as well as the flux measured onm/z105.070 show a maximum of elevation only two days after the hailstorm indicated in Fig. 9.
5
Figure 10 shows the concentrations (upper panel) and fluxes (lower panel) of the sum of monoterpenes (red) and the sum of MBO and isoprene (blue) for the whole measurement period. After the hailstorm on 4 August (DOY 216) monoterpene volume mixing ratios and fluxes are elevated. In contrast, the sum of MBO+isoprene is not
elevated after the hailstorm. Some monoterpenes are stored in pools and due to the 10
wounding of the pools monoterpenes are released in higher amounts. MBO+isoprene
are not stored, but emitted directly after their production. Higher emissions of stored compounds could be induced by mechanical wounding of the trees.
Figure 11 shows the cumulative flux calculated from the measurements (blue) and the expected flux assuming only temperature and light dependencies using MEGAN 15
2.1 (red) adjusted to the measurements at the end of the measurement campaign when we assume no more influence of the hailstorm (after DOY 240). This indicates that if monoterpene emissions are calculated based on temperature and light dependence only then the cumulative flux over one month is underestimated by∼40 %.
4 Summary and conclusion
20
Eddy covariance PTR-TOF-MS measurements above a ponderosa pine forest in Col-orado, USA revealed fluxes of 17 ion mass peaks that can be grouped into seven compound classes. The sum of MBO and isoprene is the dominant flux, contributing 50 % to the total observed flux. The other compounds showing a significant daily flux are methanol, the sum of acetic acid and glycolaldehyde, the sum of monoterpenes, 25
ACPD
13, 15333–15375, 2013PTR-TOF-MS measurements and
MEGAN 2.1 model results
L. Kaser et al.
Title Page
Abstract Introduction
Conclusions References
Tables Figures
◭ ◮
◭ ◮
Back Close
Full Screen / Esc
Printer-friendly Version Interactive Discussion
Discussion
P
a
per
|
Di
scussion
P
a
per
|
Discussion
P
a
per
|
Discussi
on
P
a
per
|
Temperature and light dependence of MBO+isoprene are found to be in
good agreement with previous measurements. Eddy covariance measurements of MBO+isoprene and the sum of monoterpenes are compared to four different
emis-sion factor estimation approaches available for MEGAN 2.1 at this site. The emisemis-sion factor obtained from site specific leaf cuvette emission measurements and tree cover 5
surveys agree best with the above canopy flux measurements.
The wounding of branches and needles due to a severe hailstorm triggered the emission of monoterpenes and other compounds such as camphor, pinonaldehyde, nopinone and sesquiterpenes. The storm increased the monthly emissions of monoter-penes by 40 % compared to model results assuming only temperature and light depen-10
dent emission. These results stress the importance of long term above canopy flux measurements to increase the chance to capture irregularly occurring events such as hailstorms, which can significantly influence the budget of VOCs emitted from a needle tree forest.
Acknowledgements. This work was financially supported by the Austrian Science Fund (FWF)
15
under the project number L518-N20. The National Center for Atmospheric Research is op-erated by the University Corporation for Atmospheric Research under sponsorship from the National Science Foundation. Lisa Kaser is a recipient of a DOC-fFORTE-fellowship of the Austrian Academy of Science. The authors would like to thank Ionimed/Ionicon Analytik in Inns-bruck for providing the liquid calibration unit (LCU) and the BEACHON ROCS science team that
20
assured the success of this measurement campaign.
References
Arneth, A. and Niinemets, Ü.: Induced BVOCs: how to bug our models?, Trends Plant Sci., 15, 118–125, doi:10.1016/j.tplants.2009.12.004, 2010.
Bamberger, I., Hörtnagl, L., Tuuskanen, T. M., Schnitzhofer, R., Müller, M., Graus, M., Karl, T.,
25
ACPD
13, 15333–15375, 2013PTR-TOF-MS measurements and
MEGAN 2.1 model results
L. Kaser et al.
Title Page
Abstract Introduction
Conclusions References
Tables Figures
◭ ◮
◭ ◮
Back Close
Full Screen / Esc
Printer-friendly Version Interactive Discussion
Discussion
P
a
per
|
Di
scussion
P
a
per
|
Discussion
P
a
per
|
Discussi
on
P
a
per
|
Bouvier-Brown, N. C., Goldstein, A. H., Gilman, J. B., Kuster, W. C., and de Gouw, J. A.: In-situ ambient quantification of monoterpenes, sesquiterpenes, and related oxygenated com-pounds during BEARPEX 2007: implications for gas- and particle-phase chemistry, Atmos. Chem. Phys., 9, 5505–5518, doi:10.5194/acp-9-5505-2009, 2009.
DiGangi, J. P., Boyle, E. S., Karl, T., Harley, P., Turnipseed, A., Kim, S., Cantrell, C.,
5
Maudlin III, R. L., Zheng, W., Flocke, F., Hall, S. R., Ullmann, K., Nakashima, Y., Paul, J. B., Wolfe, G. M., Desai, A. R., Kajii, Y., Guenther, A., and Keutsch, F. N.: First direct mea-surements of formaldehyde flux via eddy covariance: implications for missing in-canopy formaldehyde sources, Atmos. Chem. Phys., 11, 10565–10578, doi:10.5194/acp-11-10565-2011, 2011.
10
Duhl, T. R., Gochis, D., Guenther, A., Ferrenberg, S., and Pendall, E.: Emissions of BVOC from lodgepole pine in response to mountain pine beetle attack in high and low mortality forest stands, Biogeosciences, 10, 483–499, doi:10.5194/bg-10-483-2013, 2013.
Fischer, L., Klinger, A., Herbig, J., Winkler, K., Gutmann, R., and Hansel, A.: The LCU: Ver-satile Trace Gas Calibration, in: 6th International Conference on Proton Transfer Reaction
15
Mass Spectrometrz and its Applications Proceedings, Spectrometry, Obergurgl, Austria, 3–8 February, 192–194, 2013.
Foken, T. and Wichura, B.: Tools for quality assessment of surface-based flux measurements, Agr. Forest Meteorol., 78, 83–105, 1996.
Fowler, D., Pilegaard, K., Sutton, M. A., Ambus, P., Raivonen, M., Duyzer, J., Simpson, D.,
20
Fagerli, H., Fuzzi, S., Schjoerring, J. K., Granier, C., Neftl, A., Isaksen, I. S. A., Laj, P., Maione, M., Monks, P. S., Burkhardt, J., Daemmgen, U., Neirynck, J., Personne, E., Wichink-Kruit, R., Butterbach-Bahl, K., Flechard, C., Tuovinen, J. P., Coyle, M., Gerosa, G., Lou-bet, B., Altimir, N., Gruenhage, L., Ammann, C., Cieslik, S., Paoletti, E., Mikkelsen, T. N., Ro-Poulsen, H., Cellier, P., Cape, J. N., Horvath, L., Loreto, F., Niinemets, U., Palmer, P. I.,
25
Rinne, J., Misztal, P., Nemitz, E., Nilsson, D., Pryor, S., Gallagher, M. W., Vesala, T., Skiba, U., Bruggemann, N., Zechmeister-Boltenstern, S., Williams, J., O’Dowd, C., Facchini, M. C., de Leeuw, G., Flossman, A., Chaumerliac, N., and Erisman, J. W.: Atmospheric composition change: ecosystems–atmosphere interactions, Atmos. Environ., 43, 5193–5267, 2009. Graus, M., Müller, M., and Hansel, A.: High resolution PTR-TOF: quantification and
for-30
ACPD
13, 15333–15375, 2013PTR-TOF-MS measurements and
MEGAN 2.1 model results
L. Kaser et al.
Title Page
Abstract Introduction
Conclusions References
Tables Figures
◭ ◮
◭ ◮
Back Close
Full Screen / Esc
Printer-friendly Version Interactive Discussion
Discussion
P
a
per
|
Di
scussion
P
a
per
|
Discussion
P
a
per
|
Discussi
on
P
a
per
|
Grote, R. and Niinemets, Ü.: Modeling volatile isoprenoid emissions – a story with split ends, Plant Biol., 10, 8–28, doi:10.1055/s-2007-964975, 2008.
Guenther, A.: The contribution of reactive carbon emissions from vegetation to the car-bon balance of terrestrial ecosystems, Chemosphere, 49, 837–844, doi:10.1016/S0045-6535(02)00384-3, 2002.
5
Guenther, A., Zimmerman, P., and Wildermuth, M.: Natural volatile organic-compound emission rate estimates for United-States woodland landscapes, Atmos. Environ., 28, 1197–1210, 1994.
Guenther, A., Hewitt, C. N., Erickson, D., Fall, R., Geron, C., Graedel, T., Harley, P., Klinger, L., Lerdau, M., Mckay, W. A., Pierce, T., Scholes, B., Steinbrecher, R., Tallamraju, R.,
Tay-10
lor, J., and Zimmermann, P.: A global-model of natural volatile organic-compound emissions, J. Geophys. Res.-Atmos., 100, 8873–8892, 1995.
Guenther, A., Karl, T., Harley, P., Wiedinmyer, C., Palmer, P. I., and Geron, C.: Estimates of global terrestrial isoprene emissions using MEGAN (Model of Emissions of Gases and Aerosols from Nature), Atmos. Chem. Phys., 6, 3181–3210, doi:10.5194/acp-6-3181-2006,
15
2006.
Guenther, A. B., Jiang, X., Heald, C. L., Sakulyanontvittaya, T., Duhl, T., Emmons, L. K., and Wang, X.: The Model of Emissions of Gases and Aerosols from Nature version 2.1 (MEGAN2.1): an extended and updated framework for modeling biogenic emissions, Geosci. Model Dev., 5, 1471–1492, doi:10.5194/gmd-5-1471-2012, 2012.
20
Haase, K. B., Jordan, C., Mentis, E., Cottrell, L., Mayne, H. R., Talbot, R., and Sive, B. C.: Changes in monoterpene mixing ratios during summer storms in rural New Hampshire (USA), Atmos. Chem. Phys., 11, 11465–11476, doi:10.5194/acp-11-11465-2011, 2011. Harley, P., Fridd-Stroud, V., Greenberg, J., Guenther, A., and Vasconcellos, P.: Emission of
2-methyl-3-buten-2-ol by pines: a potentially large natural source of reactive carbon to the
25
atmosphere, J. Geophys. Res., 103, 25479–25486, 1998.
Helmig, D., Greenberg, J., Guenther, A., Zimmerman, P., and Geron, C.: Volatile organic com-pounds and isoprene oxidation products at a temperate deciduous forest site, J. Geophys. Res.-Atmos., 103, 22397–22414, 1998.
Hsieh, C. I., Katul, G., and Chi, T.: An approximate analytical model for footprint estimation
30
ACPD
13, 15333–15375, 2013PTR-TOF-MS measurements and
MEGAN 2.1 model results
L. Kaser et al.
Title Page
Abstract Introduction
Conclusions References
Tables Figures
◭ ◮
◭ ◮
Back Close
Full Screen / Esc
Printer-friendly Version Interactive Discussion
Discussion
P
a
per
|
Di
scussion
P
a
per
|
Discussion
P
a
per
|
Discussi
on
P
a
per
|
Holopainen, J. K. and Gershenzon, J.: Multiple stress factors and the emission of plant VOCs, Trends Plant Sci., 15, 176–184, 2010.
Holzinger, R., Lee, A., McKay, M., and Goldstein, A. H.: Seasonal variability of monoterpene emission factors for a ponderosa pine plantation in California, Atmos. Chem. Phys., 6, 1267– 1274, doi:10.5194/acp-6-1267-2006, 2006.
5
Jordan, A., Haidacher, S., Hanel, G., Hartungen, E., Märk, L., Seehauser, H., Schottkowsky, R., Sulzer, P., and Märk, T. D.: A high resolution and high sensitivity proton-transfer-reaction time-of-flight mass spectrometer (PTR-TOF-MS), Int. J. Mass Spectrom., 286, 122–128, 2009. Karl, T. G., Spirig, C., Rinne, J., Stroud, C., Prevost, P., Greenberg, J., Fall, R., and Guenther, A.:
Virtual disjunct eddy covariance measurements of organic compound fluxes from a subalpine
10
forest using proton transfer reaction mass spectrometry, Atmos. Chem. Phys., 2, 279–291, doi:10.5194/acp-2-279-2002, 2002.
Kaser, L., Karl, T., Schnitzhofer, R., Graus, M., Herdlinger-Blatt, I. S., DiGangi, J. P., Sive, B., Turnipseed, A., Hornbrook, R. S., Zheng, W., Flocke, F. M., Guenther, A., Keutsch, F. N., Apel, E., and Hansel, A.: Comparison of different real time VOC measurement techniques
15
in a ponderosa pine forest, Atmos. Chem. Phys., 13, 2893–2906, doi:10.5194/acp-13-2893-2013, 2013.
Kesselmeier, J. and Staudt, M.: Biogenic volatile organic compounds (VOC): an overview on emission, physiology and ecology, J. Atmos. Chem., 33, 23–88, 1999.
Kim, L., Galbally, I. E., Porter, N., Weeks, I. A., and Lawson, S. J.: BVOC emissions from
me-20
chanical wounding of leaves and branches ofEucalyptus sideroxylon(red ironbark), J. At-mos. Chem., 68, 265–279, doi:10.1007/s10874-012-9221-x, 2011.
Kim, S., Karl, T., Guenther, A., Tyndall, G., Orlando, J., Harley, P., Rasmussen, R., and Apel, E.: Emissions and ambient distributions of Biogenic Volatile Organic Compounds (BVOC) in a ponderosa pine ecosystem: interpretation of PTR-MS mass spectra, Atmos. Chem. Phys.,
25
10, 1759–1771, doi:10.5194/acp-10-1759-2010, 2010.
Koppmann, R.: Volatile Organic Compounds in the Atmosphere, Blackwell Publishing, Oxford, 2007.
Lamarque, J.-F., Bond, T. C., Eyring, V., Granier, C., Heil, A., Klimont, Z., Lee, D., Liousse, C., Mieville, A., Owen, B., Schultz, M. G., Shindell, D., Smith, S. J., Stehfest, E., Van
Aar-30
burn-ACPD
13, 15333–15375, 2013PTR-TOF-MS measurements and
MEGAN 2.1 model results
L. Kaser et al.
Title Page
Abstract Introduction
Conclusions References
Tables Figures
◭ ◮
◭ ◮
Back Close
Full Screen / Esc
Printer-friendly Version Interactive Discussion
Discussion
P
a
per
|
Di
scussion
P
a
per
|
Discussion
P
a
per
|
Discussi
on
P
a
per
|
ing emissions of reactive gases and aerosols: methodology and application, Atmos. Chem. Phys., 10, 7017–7039, doi:10.5194/acp-10-7017-2010, 2010.
Lee, A., Schade, G. W., Holzinger, R., and Goldstein, A. H.: A comparison of new measure-ments of total monoterpene flux with improved measuremeasure-ments of speciated monoterpene flux, Atmos. Chem. Phys., 5, 505–513, doi:10.5194/acp-5-505-2005, 2005.
5
Muller, J. F.: Geographical-distribution and seasonal-variation of surface emissions and deposi-tion velocities of atmospheric trace gases, J. Geophys. Res.-Atmos., 97, 3787–3804, 1992. Müller, M., Graus, M., Ruuskanen, T. M., Schnitzhofer, R., Bamberger, I., Kaser, L.,
Titz-mann, T., Hörtnagl, L., Wohlfahrt, G., Karl, T., and Hansel, A.: First eddy covariance flux measurements by PTR-TOF, Atmos. Meas. Tech., 3, 387–395, doi:10.5194/amt-3-387-2010,
10
2010.
Niinemets, Ü.: Mild versus severe stress and BVOCs: thresholds priming and consequences, Trends Plant Sci., 15, 145–153, 2010.
Niinemets, Ü., Monson, R. K., Arneth, A., Ciccioli, P., Kesselmeier, J., Kuhn, U., Noe, S. M., Peñuelas, J., and Staudt, M.: The leaf-level emission factor of volatile isoprenoids:
15
caveats, model algorithms, response shapes and scaling, Biogeosciences, 7, 1809–1832, doi:10.5194/bg-7-1809-2010, 2010a.
Niinemets, Ü., Arneth, A., Kuhn, U., Monson, R. K., Peñuelas, J., and Staudt, M.: The emis-sion factor of volatile isoprenoids: stress, acclimation, and developmental responses, Bio-geosciences, 7, 2203–2223, doi:10.5194/bg-7-2203-2010, 2010b.
20
Olivier, J. G. J., Bloos, J. P. J., Berdowski, J. J. M., Visschedijk, A. J. H., and Bouwman, A. R.: A 1990 global emission inventory of anthropogenic sources of carbon monoxide on 1◦
×1◦ developed in the framework of EDGAR/GEIA, Chemosphere, 1, 1–17, 1999.
Park, J.-H., Goldstein, A. H., Timkovsky, J., Fares, S., Weber, R., Karlik, J., and Holzinger, R.: Eddy covariance emission and deposition flux measurements using proton transfer reaction –
25
time of flight – mass spectrometry (PTR-TOF-MS): comparison with PTR-MS measured ver-tical gradients and fluxes, Atmos. Chem. Phys., 13, 1439–1456, doi:10.5194/acp-13-1439-2013, 2013.
Räisänen, T., Ryyppö, A., and Kellomäki, S.: Impact of timber felling on the ambient monoter-pene concentration of a Scots pine (Pinus sylvestrisL.) forest, Atmos. Environ., 42, 6759–
30
6766, 2008.
ACPD
13, 15333–15375, 2013PTR-TOF-MS measurements and
MEGAN 2.1 model results
L. Kaser et al.
Title Page
Abstract Introduction
Conclusions References
Tables Figures
◭ ◮
◭ ◮
Back Close
Full Screen / Esc
Printer-friendly Version Interactive Discussion
Discussion
P
a
per
|
Di
scussion
P
a
per
|
Discussion
P
a
per
|
Discussi
on
P
a
per
|
above grassland using PTR-TOF, Atmos. Chem. Phys., 11, 611–625, doi:10.5194/acp-11-611-2011, 2011.
Schade, G. W. and Goldstein, A. H.: Fluxes of oxygenated volatile organic compounds from a ponderosa pine plantation, J. Geophys. Res.-Atmos., 106, 3111–3123, 2001.
Schade, G. W. and Goldstein, A. H.: Increase of monoterpene emissions from a pine
5
plantation as a result of mechanical disturbances, Geophys. Res. Lett., 30, 1380, doi:10.1029/2002GL016138, 2003.
Schade, G. E., Goldstein, A. H., and Lamanna, M. S.: Are monoterpene emissions influenced by humidity?, Geophys. Res. Lett., 26, 2187–2190, 1999.
Wilczak, J. M., Oncley, S. P., and Stange, S. A.: Sonic anemometer tilt correction algorithms,
10
ACPD
13, 15333–15375, 2013PTR-TOF-MS measurements and
MEGAN 2.1 model results
L. Kaser et al.
Title Page Abstract Introduction Conclusions References Tables Figures ◭ ◮ ◭ ◮ Back Close
Full Screen / Esc
Printer-friendly Version Interactive Discussion Discussion P a per | Di scussion P a per | Discussion P a per | Discussi on P a per |
Table 1.Volatile organic compounds showing an emission flux during the period of 5 August to
8 September 2010. Grade A fluxes (bold) and grade B fluxes (italic) are listed with sum formula and proposed compound.
Molecular formula
Likely compound
Parent ion (m/z)
Fragment (m/z)
Isotopo-logue (m/z)
Water cluster (m/z)
Flux (mg m−2
h−1
)a Percent data usedb
Calibration method
Sensitivity (ncps/ppbv)
C5H10O-H
+
MBO and iso-prene
87.0811 69.0704 41.0400
88.0824
70.0729
1.84 40 Gas standard 13.5
CH4O-H
+
Methanol 33.0336 51.0438 0.42 47 Gas standard 11.7
C2H2O-H
+
acetic acid
and
glyco-laldehyde
61.0287 43.0180 0.36 36 LCU 7.4
C10H16-H
+ sum of monoter-penes 137.134 81.0706 95.0866 138.137 82.0738
0.35 33 Gas standard 13.1
C3H6O-H
+
acetone and
propanal
59.0495 0.27 39 Gas standard 19.7
C2H6O-H
+
Ethanol 47.0469 0.17 39 LCU 2.5
C2H4O-H
+
Acetaldehyde 45.0337 0.17 50 Gas standard 17.8
a
Daytime (10:00–18:00 LT) average flux (mg compound m−2
h−1
).
ACPD
13, 15333–15375, 2013PTR-TOF-MS measurements and
MEGAN 2.1 model results
L. Kaser et al.
Title Page
Abstract Introduction
Conclusions References
Tables Figures
◭ ◮
◭ ◮
Back Close
Full Screen / Esc
Printer-friendly Version Interactive Discussion
Discussion
P
a
per
|
Di
scussion
P
a
per
|
Discussion
P
a
per
|
Discussi
on
P
a
per
|
Table 2.Comparison of the empirical coefficients from the light dependent MBO and isoprene
emission following Eq. (1).
Harley et al. (1998) Schade et al. (2001) This work MEGAN 2.1
A 0.0011 0.0011 0.0011 0.0007
ACPD
13, 15333–15375, 2013PTR-TOF-MS measurements and
MEGAN 2.1 model results
L. Kaser et al.
Title Page
Abstract Introduction
Conclusions References
Tables Figures
◭ ◮
◭ ◮
Back Close
Full Screen / Esc
Printer-friendly Version Interactive Discussion
Discussion
P
a
per
|
Di
scussion
P
a
per
|
Discussion
P
a
per
|
Discussi
on
P
a
per
|
Table 3.MBO+isoprene light dependence of fitted data for four different temperature regimes.
MBO+isoprene A C
L1 r 2
17–19◦C 0.0009 1.49 0.83
19–21◦C 0.0007 1.74 0.85
21–23◦C 0.0005 2.23 0.86
ACPD
13, 15333–15375, 2013PTR-TOF-MS measurements and
MEGAN 2.1 model results
L. Kaser et al.
Title Page
Abstract Introduction
Conclusions References
Tables Figures
◭ ◮
◭ ◮
Back Close
Full Screen / Esc
Printer-friendly Version Interactive Discussion
Discussion
P
a
per
|
Di
scussion
P
a
per
|
Discussion
P
a
per
|
Discussi
on
P
a
per
|
Table 4.Comparison of the empirical coefficients from the temperature dependent MBO and
isoprene emission following Eq. (2).
Harley et al. (1998) Schade et al. (2001) This work MEGAN 2.1
Eopt 1.54 1.45 1.29 1.32
CT1 67 131 128 134
CT2 209 154 149 156
ACPD
13, 15333–15375, 2013PTR-TOF-MS measurements and
MEGAN 2.1 model results
L. Kaser et al.
Title Page
Abstract Introduction
Conclusions References
Tables Figures
◭ ◮
◭ ◮
Back Close
Full Screen / Esc
Printer-friendly Version Interactive Discussion
Discussion
P
a
per
|
Di
scussion
P
a
per
|
Discussion
P
a
per
|
Discussi
on
P
a
per
|
Table 5.Temperature dependent emission factors.
Compound (Tref=303 K) Fref[mg m− 2
h−1
] B r2 Q10
Sum of monoterpenes∗ 0.50 0.12 0.85 3.32
Methanol 0.94 0.13 0.81 3.67
Acetone+propanal 0.63 0.15 0.92 4.48
Acetaldehyde 0.33 0.12 0.95 3.32
Acetic acid+glycolaldehyde 0.91 0.15 0.94 4.48
Ethanol 0.28 0.07 0.86 2.01
∗For the sum of monoterpenes only data after DOY 230 was used as the data before this
ACPD
13, 15333–15375, 2013PTR-TOF-MS measurements and
MEGAN 2.1 model results
L. Kaser et al.
Title Page
Abstract Introduction
Conclusions References
Tables Figures
◭ ◮
◭ ◮
Back Close
Full Screen / Esc
Printer-friendly Version Interactive Discussion
Discussion
P
a
per
|
Di
scussion
P
a
per
|
Discussion
P
a
per
|
Discussi
on
P
a
per
|
Table 6.Linear fit to light dependency.
Compound (Tref=303 K) Slope Intercept r2
Sum of monoterpenes∗ 1.7
×10−4 0.15 0.59
Methanol 2.5×10⁻⁴
0.15 0.87
Acetone+propanal 1.5×10⁻⁴
0.11 0.53
Acetaldehyde 6.8×10⁻⁵
0.11 0.67
Acetic acid+glycolaldehyde 2.5×10⁻⁴ 0.09 0.70
∗For the sum of monoterpenes only data after DOY 230 was used as the data
ACPD
13, 15333–15375, 2013PTR-TOF-MS measurements and
MEGAN 2.1 model results
L. Kaser et al.
Title Page
Abstract Introduction
Conclusions References
Tables Figures
◭ ◮
◭ ◮
Back Close
Full Screen / Esc
Printer-friendly Version Interactive Discussion
Discussion
P
a
per
|
Di
scussion
P
a
per
|
Discussion
P
a
per
|
Discussi
on
P
a
per
|
Table 7. Summary of emission factor approaches. The sum of monoterpenes includes:
myrcene, sabinene, limonene, 3-carene, trans-β-ocimene, β-pinene, α-pinene and other monoterpenes.
Emission factor (µg compound m−2
h−1
)
M21SRC M21PP SSLC SSBE This study
MBO 5300 9000 23 000 15 000 21 485
Sum of monoterpenes 1862 1650 1820 1370 2395∗
∗For monoterpene emissions after DOY 240 where model results imply that there is no more influence
ACPD
13, 15333–15375, 2013PTR-TOF-MS measurements and
MEGAN 2.1 model results
L. Kaser et al.
Title Page
Abstract Introduction
Conclusions References
Tables Figures
◭ ◮
◭ ◮
Back Close
Full Screen / Esc
Printer-friendly Version Interactive Discussion
Discussion
P
a
per
|
Di
scussion
P
a
per
|
Discussion
P
a
per
|
Discussi
on
P
a
per
|
Table 8.List of ion mass peaks that show an elevated flux after the hailstorm on 4 August.
If possible they were grouped into compound classes and sorted by the amount of maximum emission after the hailstorm. The remaining ion mass peaks are listed at the end of the table by decreasing molecular weight.
Molecular formula Likely compound Exact masses (m/z)
C10H16-H+ Sum of monoterpenes 137.134 (parent ion)
138.137 (isotope) 81.0706 (fragment) 82.0738 (isotope) 95.0866 (fragment)
C10H14-H+ p-cymene 135.118 (parent ion)
136.13 (isotope) 93.0707 (fragment)
C10H16O-H+ e.g. camphor 153.128 (parent ion)
154.132 (isotope)
C10H16O2-H+ Pinonaldehyde 169.124 (parent ion)
151.113 (fragment) 109.105 (fragment) 107.086 (fragment) 99.081 (fragment)
C9H14O-H+ Nopinone 139.117 (parent ion)
121.098 (fragment)
C15H24-H+ sum of sesquiterpenes 205.198 (parent ion)
95.0866 (fragment)
C8H8-H+ e.g. styrene 105.070 (parent ion)
Several still unassigned ion mass peaks that also had elevated fluxes after the hailstorm:
C7H10O3-H+ Unknown 143.069
ACPD
13, 15333–15375, 2013PTR-TOF-MS measurements and
MEGAN 2.1 model results
L. Kaser et al.
Title Page
Abstract Introduction
Conclusions References
Tables Figures
◭ ◮
◭ ◮
Back Close
Full Screen / Esc
Printer-friendly Version Interactive Discussion
Discussion
P
a
per
|
Di
scussion
P
a
per
|
Discussion
P
a
per
|
Discussi
on
P
a
per
|
Fig. 1.Fraction of physically plausible delay times as a function of recorded exact ion mass