www.arch-anim-breed.net/59/429/2016/ doi:10.5194/aab-59-429-2016
© Author(s) 2016. CC Attribution 3.0 License. Archives Animal Breeding
Lipid and lipoprotein profile changes in dairy cows in
response to late pregnancy and the early postpartum
period
Francesca Arfuso1, Francesco Fazio1, Maria Levanti1, Maria Rizzo1, Simona Di Pietro1, Elisabetta Giudice2, and Giuseppe Piccione1
1Department of Veterinary Sciences, University of Messina, Polo Universitario Annunziata,
98168, Messina, Italy
2Department of Chemical, Biological, Pharmaceutical and Environmental Sciences, University of Messina,
Viale Ferdinando Stagno d’Alcontres 31, 98166, S. Agata-Messina, Italy
Correspondence to:Giuseppe Piccione ([email protected])
Received: 16 June 2016 – Revised: 11 October 2016 – Accepted: 18 October 2016 – Published: 31 October 2016
Abstract. In dairy cows the peripartum period involves endocrine and metabolic changes to compensate for the
increased energy requirement aggravated by reduced feed intake. Cows adjust to the resulting negative energy balance with the mobilization of lipids from adipose tissue that, if excessive, could lead to many transition disorders compromising the offspring’s growth and well-being. The aim of this study was to evaluate the dynamic changes in serum lipid and lipoprotein profiles in five dairy cows during the peripartum period. For each cow body condition score (BCS) and body weight (BW) measurements as well as blood sampling was carried out 60, 30 and 15 days before calving (−60,−30 and−15 BC), at calving day (C) and on days 15, 30 and 60 after
calving (+15,+30 and+60 AC). Blood samples were tested for serum total lipids, phospholipids, triglycerides,
very low-density lipoproteins (VLDLs), total cholesterol (Total-Chol), high-density lipoproteins (HDLs) and low-density lipoproteins (LDLs). One-way repeated measures analysis of variance (ANOVA) was applied to determine the effect of the peripartum period on the studied parameters in cows. A statistically significant effect of the peripartum period (P <0.05) was found in the values of BCS, BW and all serum lipid and lipoprotein indices measured in cows. The changes observed in lipid indices of peripartum cows could be due to the start of milking and the increase in energy consumption in the body, confirming that metabolic adjustments occur as cows move from the gestation to the lactation period.
1 Introduction
In dairy cows pregnancy is recognized as inducing remark-able physiological and metabolic adaptations essential to en-sure the suitable development of the foetus and to provide ad-equate substrates that are needed in utero and following birth (Modina et al., 2007; Van Dorland et al., 2009; Polakova et al., 2010).
Despite haemostatic mechanisms which function to main-tain blood parameters within physiological levels, changes in biochemical indices occur as a result of increased metabolic demands during both pregnancy and lactation (Piccione et al., 2011).
and fat metabolism, which may result in metabolic disorders such as ketosis, which is related to other diseases including a retained placenta, uterine infection, milk fever and mastitis (Imhasly et al., 2015). Many transition period disorders, in-cluding fatty liver, also occur in a subclinical form affecting the overall health status, milk production and reproductive performance of dairy cows (Imhasly et al., 2015).
Because the lipid metabolism is a key aspect of the phys-iology and energy metabolism of transition cows (Drackley, 1999; Gross et al., 2013), the aim of this study was to in-vestigate the dynamic changes in serum lipid and lipoprotein profiles in dairy cows during the peripartum period.
2 Materials and methods
2.1 Farm conditions and animals
Five multiparous Holstein cows (5–7 years) were se-lected from a farm located in Sicily, Italy (36◦42′38′′N 14◦47′15′′E; 51 m above sea level). This area is character-ized by a minimum and maximum mean annual temperature between 15.2 and 21.9◦C, mean annual relative humidity of 67.64 %, and mean annual rainfall of 35.6 mm. The farm has a dry period of 60 days and a period of steaming up of 15 days before calving. The farm has a milk production of about 10 000 kg per year, with a milk quality of 3.7 % milk fat and 3.4 % milk protein. All cows were clinically healthy and free from internal and external parasites. Their health sta-tus during pregnancy was evaluated based on rectal tempera-ture, heart rate, respiratory profile, appetite, fecal consistency and hematological profile (data not shown). Over the first 3 days after calving each cow was subjected to a daily clinical examination including the evaluation of body temperature, heart rate, respiratory rate, external genitalia, vagina, cervix, uterus and ovaries (data not shown). All animals were kept in an indoor pen under a natural photoperiod and ambient temperature.
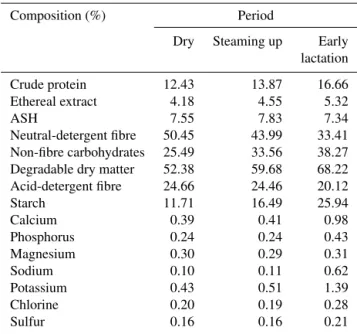
All cows were fed a balanced diet in accordance with the nutritional requirements of the peripartum period. Water was available ad libitum. Table 1 shows the chemical composi-tion of diets used during dry period, steaming up and sub-sequent early lactation. The body condition scoring (BCS) was evaluated for each cow by the same operator using a 1 to 5 scale (Edmonson et al., 1989) throughout the monitor-ing period. The body weight (BW) of each animal was mea-sured by means of a weighing platform (PS3000HD heavy-duty floor scale, Breckwell, UK) throughout the monitoring period.
2.2 Blood sampling and analysis
Blood samples were collected from each animal by the same operator in the morning (07:00) by jugular venipuncture, and the blood was collected in Vacutainer tubes contain-ing a cloth activator agent (Terumo Co., Tokyo, Japan). For
Table 1.Mean chemical composition (%) of dairy cows’ diets dur-ing dry period, final part of dry period (steamdur-ing up) and early lac-tation.
Composition (%) Period
Dry Steaming up Early
lactation
Crude protein 12.43 13.87 16.66
Ethereal extract 4.18 4.55 5.32
ASH 7.55 7.83 7.34
Neutral-detergent fibre 50.45 43.99 33.41
Non-fibre carbohydrates 25.49 33.56 38.27
Degradable dry matter 52.38 59.68 68.22
Acid-detergent fibre 24.66 24.46 20.12
Starch 11.71 16.49 25.94
Calcium 0.39 0.41 0.98
Phosphorus 0.24 0.24 0.43
Magnesium 0.30 0.29 0.31
Sodium 0.10 0.11 0.62
Potassium 0.43 0.51 1.39
Chlorine 0.20 0.19 0.28
Sulfur 0.16 0.16 0.21
each cow blood sampling was performed 60±3, 30±3 and
15±3 days before calving (−60,−30 and−15 BC), at
calv-ing day (C) and on days 15, 30 and 60 after calvcalv-ing (+15, +30 and+60 AC).
Blood samples were left at room temperature for 20 min, and then they were centrifuged at 3000 rpm for 10 min; the obtained sera were stored at −20◦C until analysis. Only
the non-haemolysed sera were analysed to estimate the con-centration of total lipids, phospholipids, triglycerides, total cholesterol (Total-Chol), high-density lipoproteins (HDLs) and low-density lipoproteins (LDLs) using commercially available kits by means of an automated analyser UV spec-trophotometer (model Slim SEAC, Florence, Italy). The very low-density lipoprotein fraction (VLDLs) was estimated as one fifth of the concentration of triglycerides (Lovejoy and Sainsbury, 2009).
All treatments, housing and animal care were carried out in accordance with the standards recommended by the EU Directive 2010/63/EU for animal experiments.
2.3 Statistical analysis
All results are expressed as mean±standard deviation (SD).
All data were tested for normality of distribution using the Shapiro–Wilks test. All data were normally distributed (P >0.05), and statistical analysis was performed. One-way repeated measures analysis of variance (ANOVA), followed by a Bonferroni post hoc comparison test, was applied to de-termine the statistical effect of the peripartum period on BCS, BW, serum total lipids, phospholipids, triglycerides,
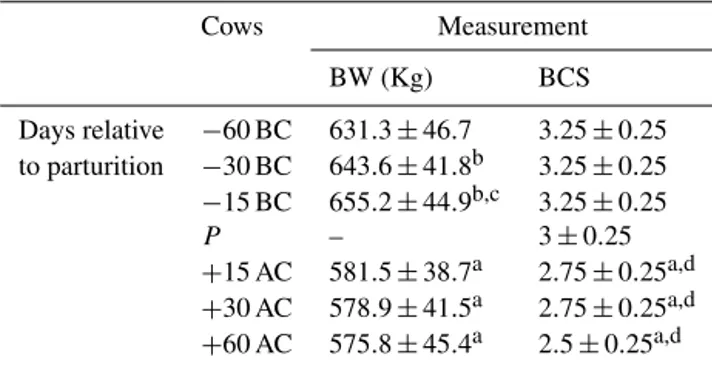
Table 2. Mean values (±SD) of body weight (BW) and body condition score (BCS) obtained from cows at 60±3, 30±3 and 15±3 days before calving (−60,−30 and−15 BC), at calving day (C) and at 15, 30 and 60 days after calving (+15,+30 and+60 AC).
Cows Measurement
BW (Kg) BCS
Days relative −60 BC 631.3±46.7 3.25±0.25
to parturition −30 BC 643.6±41.8b 3.25±0.25
−15 BC 655.2±44.9b,c 3.25±0.25
P – 3±0.25
+15 AC 581.5±38.7a 2.75±0.25a,d
+30 AC 578.9±41.5a 2.75±0.25a,d
+60 AC 575.8±45.4a 2.5±0.25a,d
Significances (P <0.0001):avs. 60, 30 and 15 BC;bvs. 60 BC;cvs. 30 BC;dvs. P.
values<0.05 were considered statistically significant. Data were analysed using the software Prism v. 4.00 (Graphpad Software Ldt., USA, 2003).
3 Results
None of the animals included in the study showed clinical signs of disease during the monitoring period. All cows de-livered healthy, viable full-term calves, without assistance. They passed a normal and intact placenta spontaneously within 2 h and achieved the complete involution of the uterus within 2 weeks after calving.
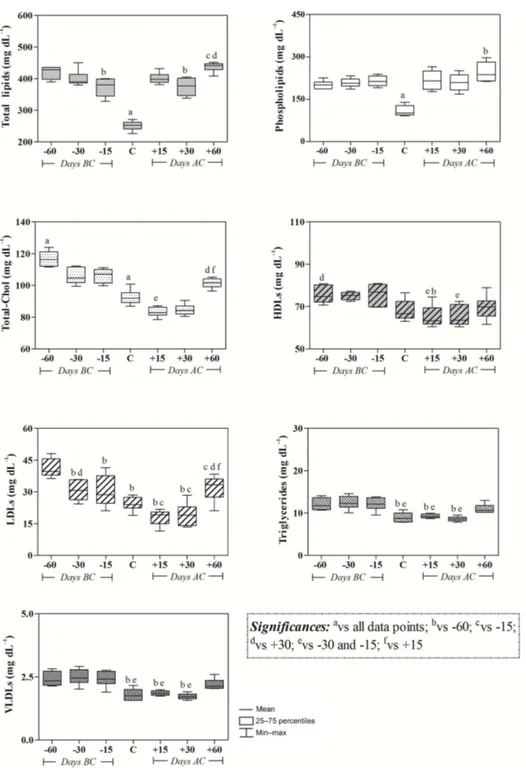
BW and BCS values measured in cows during the peripar-tum period are shown in Table 2 with the related significances found. As expected, prepartum BW and BCS values recorded from cows were statistically higher with respect to postpar-tum time points (P <0.0001). Within the prepartum inter-val a difference was found in BW over time (P <0.0001). One-way ANOVA revealed a statistically significant effect of the peripartum period on all serum lipid and lipoprotein indices measured in cows. In particular, serum total lipids and phospholipids showed decreased values from prepartum time points until calving, followed by an increase throughout the postpartum time points (P <0.001). Triglycerides and VLDLs showed the highest levels during the prepartum time points; afterwards, they showed the same declining trend until 15 and 30 days after calving (P <0.001) Total-Chol and LDLs showed the highest values 60 days before calv-ing followed by a decrease throughout the monitorcalv-ing period (P <0.05). The HDLs showed the highest values during the prepartum time points with respect to 15 and 30 days after calving (P <0.05) (Fig. 1).
4 Discussion
During the peripartum period there is an increase in the demand for the regulatory mechanism responsible for the processes involved in milking (Krajnicakova et al., 2003). For this reason, characteristic changes in lipid metabolism are found during pregnancy and lactation in most mammals (Roche et al., 2009). Endocrine profiles change and lipoly-sis and lipogenelipoly-sis are regulated to increase the lipid reserve during pregnancy, which will be utilized following parturi-tion and the initiaparturi-tion of lactaparturi-tion (Roche et al., 2009). This agrees with the higher BCS values measured in cows at the prepartum time points and lower BCS values evaluated in cows at the postpartum time points. The best BCS at calv-ing is between 3.0 and 3.25 (five-point scale). Below a BCS of 3.0, cows produce less milk, are less likely to get pregnant and are more likely to present with symptoms that place them in an animal welfare risk category. Above a BCS of 3.25, cows have a reduced dry matter intake, produce less milk and are more likely to succumb to periparturient metabolic disorders (Roche et al., 2009). It has been demonstrated that dairy cattle with high BCS (BCS>4.0; using a scale of 1– 5) in the last 3 weeks of gestation had a much greater de-pression in feed intake during the immediate prepartum pe-riod when compared to cows with lower BCS (Hayirli et al., 2002). During early lactation, cows are in a negative energy balance and body reserves are an important fuel supply to assist the cow in reaching her genetic potential for milk syn-thesis (Grummer, 1995). This agrees with the changes found in lipid profile of peripartum cows. In particular, a drop in serum total lipids and phospholipid values was found in cows at calving time compared to prepartum followed by an in-crease throughout the postpartum time points. In contrast, a decrease in serum triglycerides and VLDL values was found at calving and postpartum time points compared to prepartum time points. The changes found in these parameters agree with the results of previous studies (Imhasly et al., 2015; Van den Top et al., 2005; Kessler et al., 2014).
Figure 1.Trends and related statistical significances of serum total lipids, phospholipids, total cholesterol (Total-Chol), high-density lipopro-teins (HDLs), low-density lipoprolipopro-teins (LDLs), triglycerides and very low-density lipoprolipopro-teins (VLDLs) observed in cows at 60±3, 30±3 and 15±3 days before calving (−60,−30 and−15 BC), at calving day (C) and at 15, 30 and 60 days after calving (+15,+30 and+60 AC).
The liver plays a central role in the maintenance of whole-body cholesterol homeostasis by integrating the regulation of a group of hepatic enzymes, receptors and other proteins im-portant for cholesterol and lipoproteins metabolism. Hepatic regulatory elements and their integration for the maintenance of cholesterol homeostasis undergo major changes during pregnancy and lactation to ensure that cholesterol
homeosta-sis is maintained optimally for both the mother and the de-veloping offspring (Smith et al., 1998; Cupps, 1991). For this purpose, lipoproteins become necessary because cholesterol is bound to these compounds in the bloodstream.
the ovaries and placenta for steroid hormone synthesis dur-ing pregnancy (Cupps, 1991), whereas the decrease in serum Total-Chol after calving might be due to lactation (Cupps, 1991). In our study, the concentrations of serum Total-Chol and LDLs paralleled each other because the LDL pathway is the primary pathway by which cells of the ovary, pla-centa and mammary gland acquire cholesterol to synthe-size steroids and to produce milk (Cupps, 1991). Effectively, cholesterol in milk derives from LDL lipoproteins as well as from de novo synthesis in the mammary gland (Symonds and Stephenson, 1999). Therefore, the changes in serum Total-Chol and LDL levels found in peripartum cows suggest that LDLs are cleared from the circulation during pregnancy and the lactating phase to compensate for the needs of the ovary, placenta and mammary glands.
5 Conclusions
The transition from gestation to lactation is a stressful expe-rience for dairy cows since several metabolic and endocrine adjustments occur during the peripartum period. The im-proved understanding of metabolic demands during the peri-partum period might assist in monitoring the health status of the cows in order to promote the offspring’s growth and well-being.
The results obtained in the present study revealed a serum lipid and lipoprotein dynamic modification in peripartum cows. The main changes observed in lipid indices of peripar-tum cows could be due to the start of milking and the increase in energy consumption in the body.
Competing interests. The authors declare that they have no con-flict of interest.
Author contributions. All authors made substantial contribu-tions to each step of the experimental procedure and paper prepa-ration. In particular, Francesca Arfuso prepared the paper and per-formed the laboratory analysis, Francesco Fazio and Maria Rizzo performed the sampling and analysed the data, Simona Di Pietro and Elisabetta Giudice contributed to the experiment design, and Giuseppe Piccione supervised all stages of the experimental study.
Edited by: S. Maak
Reviewed by: V. Nagyova, M. Gianesella, and V. Carcangiu
References
Artegoitia, V. M., Virginia, M., Middleton, J. L., Harte, F. M., Campagna, S. R., and de Veth, M. J.: Choline and choline metabolite patterns and associations in blood and milk during lactation in dairy cows, PLoS One, 8, e103412, doi:10.1371/journal.pone.0103412, 2014.
Côté, I., Chapados, N., and Jean-Marc, L.: Impaired VLDL assem-bly: a novel mechanism contributing to hepatic lipid accumula-tion following ovariectomy and high-fat/high-cholesterol diets?, Br. J. Nutr., 112, 1592–1600, 2014.
Cupps, P. T.: Reproduction in domestic animals, Academic Press, San Diego, New York, Boston, Toronto, London, Sidney, Tokyo, 81–118, 1991.
Drackley, J. K.: Biology of Dairy Cows During the Transition Pe-riod: The Final Frontier?, J. Dairy Sci., 82, 2259–2273, 1999. Edmonson, A. J., Lean, I. J., Weaver, L. D., Farver, T., and Webster,
G.: A body condition scoring chart for Holstein dairy cows, J. Dairy Sci., 72, 68–78, 1989.
Fiore, E., Gianesella, M., Arfuso, F., Giudice, E., Piccione, G., Lora, M., and Stefani, A.: Morgante M. Glucose infusion response on some metabolic parameters in dairy cows during transition pe-riod, Arch. Tierzucht, 57, 1–9, 2014.
Gross, J. J., Schwarz, F. J., Eder, K., van Dorland, H. A., and Bruck-maier, R. M.: Liver fat content and lipid metabolism in dairy cows during early lactation and during a mid-lactation feed re-striction, J. Dairy Sci., 96, 5008–5017, 2013.
Grummer, R. R.: Impact of changes in organic nutrient metabolism on feeding the transition cow, J. Anim. Sci., 73, 2820–2833, 1995.
Hayirli, A., Grummer, R. R., Nordheim, E. V., and Crump, P. M.: Animal and dietary factors affecting feed intake during the pre-fresh transition period in Holsteins, J. Dairy Sci., 85, 3430–3443, 2002.
Imhasly, S., Bieli, C., Naegeli, H., Nyström, L., Ruetten, M., and Gerspach, C.: Blood plasma lipidome profile of dairy cows during the transition period, BMC Vet. Res., 11, 252, doi:10.1186/s12917-015-0565-8, 2015.
Jacobs, R. L., van der Veen, J. N., and Vance, D. E.: Finding the bal-ance: the role of S-Adenosylmethionine and phosphatidylcholine metabolism in development of nonalcoholic fatty liver disease, Hepatology, 58, 1207–1209, 2013.
Kessler, E. C., Gross, J. J., Bruckmaier, R. M., and Albrecht, C.: Cholesterol metabolism, transport, and hepatic regulation in dairy cows during transition and early lactation, J. Dairy Sci., 97, 5481–5490, 2014.
Krajnicakova, M., Kovac, G., Kostecky, M., Valocky, I., Maracek, I., Sutiakova, I., and Lenhardt, L.: Selected clinic-biochemical parameters in the puerperal period of goats, B. Vet. I. Pulawy, 47, 177–182, 2003.
Lovejoy, J. C. and Sainsbury, A.: Sex differences in obesity and the regulation of energy homeostasis, Obes. Rev., 10, 154–167, 2009.
Modina, S., Abbate, F., Germanà, G. P., Lauria, A., and Luciano, A. M.:β-Catenin localization and timing of early development of
bovine embryos obtained from oocytes matured in the presence of follicle stimulating hormone, Anim. Prod. Sci., 100, 264–279, 2007.
Piccione, G., Messina, V., Schembari, A., Casella, S., Giannetto, C., and Alberghina, D.: Pattern of serum protein fractions in dairy cows during different stages of gestation and lactation, J. Dairy Res., 78, 421–425, 2011.
Roche, J. R., Friggens, N. C., Kay, J. K., Fisher, M. W., Stafford, K. J., and Berry, D. P.: Invited review: Body condition score and its association with dairy cow productivity, health, and welfare, J. Dairy Sci., 92, 5769–5801, 2009.
Šamanc, H., Stoji´c, V., Kirovski, D., Jovanovi´c, M., Cernescu H., and Vujanac I.: Thyroid hormones concentrations dur-ing the mid-dry period: an early indicator of fatty liver in Holstein-Friesian Dairy Cows, J. Thyroid Res., 2010, 897602, doi:10.4061/2010/897602, 2010.
Smith, J. L., Lear, S. R., Forte, T. M., Ko, W., Massimi, M., and Erickson, S. K.: Effect of pregnancy and lactation on lipoprotein and cholesterol metabolism in the rat, J. Lipid Res., 39, 2237– 2249, 1998.
Symonds, M. E. and Stephenson, T.: Maternal nutrient restriction and endocrine programming of fetal adipose tissue development, Biochem. Soc. Trans., 27, 97–103, 1999.
Van den Top, A. M., Van Tol, A., Jansen, H., Geelen, M. J., and Beynen, A. C.: Fatty liver in dairy cows post partum is associ-ated with decreased concentration of plasma triacylglycerols and decreased activity of lipoprotein lipase in adipocytes, J. Dairy Res., 72, 129–137, 2005.