Submitted30 November 2015 Accepted 16 February 2016 Published12 April 2016
Corresponding author
Jesús Pineda, [email protected], [email protected]
Academic editor Alex Ford
Additional Information and Declarations can be found on page 17
DOI10.7717/peerj.1770
Copyright 2016 Pineda et al.
Distributed under
Creative Commons CC-BY 4.0
OPEN ACCESS
A crab swarm at an ecological hotspot:
patchiness and population density from
AUV observations at a coastal, tropical
seamount
Jesús Pineda1, Walter Cho2, Victoria Starczak1, Annette F. Govindarajan1,
Héctor M. Guzman3, Yogesh Girdhar4, Rusty C. Holleman4,5, James Churchill6,
Hanumant Singh4and David K. Ralston4
1Biology Department, Woods Hole Oceanographic Institution, Woods Hole, MA, United States of America 2Biology Department, Point Loma Nazarene University, San Diego, CA, United States of America
3Smithsonian Tropical Research Institute, Balboa Ancon, Panama
4Applied Ocean Physics and Engineering Department, Woods Hole Oceanographic Institution, Woods Hole,
MA, United States of America
5San Francisco Estuary Institute, Richmond, CA, United States of America
6Physical Oceanography Department, Woods Hole Oceanographic Institution, Woods Hole, MA, United States
of America
ABSTRACT
A research cruise to Hannibal Bank, a seamount and an ecological hotspot in the coastal eastern tropical Pacific Ocean off Panama, explored the zonation, biodiversity, and the ecological processes that contribute to the seamount’s elevated biomass. Here we describe the spatial structure of a benthic anomuran red crab population, using submarine video and autonomous underwater vehicle (AUV) photographs. High density aggregations and a swarm of red crabs were associated with a dense turbid layer 4–10 m above the bottom. The high density aggregations were constrained to 355–385 m water depth over the Northwest flank of the seamount, although the crabs also occurred at lower densities in shallower waters (∼280 m) and in another
location of the seamount. The crab aggregations occurred in hypoxic water, with oxygen levels of 0.04 ml/l. Barcoding of Hannibal red crabs, and pelagic red crabs sampled in a mass stranding event in 2015 at a beach in San Diego, California, USA, revealed that the Panamanian and the Californian crabs are likely the same species,
Pleuroncodes planipes, and these findings represent an extension of the southern endrange of this species. Measurements along a 1.6 km transect revealed three high density aggregations, with the highest density up to 78 crabs/m2, and that the crabs
were patchily distributed. Crab density peaked in the middle of the patch, a density structure similar to that of swarming insects.
SubjectsEcology, Marine Biology
Keywords Swarms, Ecological hotspot, Patchiness, Panama, Eastern Pacific, Seamount, Pleuroncodes planipes, Hypoxic environment, Anomuran crabs
INTRODUCTION
Communities of benthic species on seamounts are regionally isolated, with elevated, shallow rocky habitat patches surrounded by deep sedimentary plains. These two environmental axes, type of substrate (hard vs. soft), and depth (gradients in food, light, and oxygen), create horizontal and vertical patterns in faunal zonation (Pitcher et al., 2008;Thresher et al., 2014). These patterns are likely determined regionally by circulation and larval dispersal, and vertically by physical factors and biological interactions. In the pelagic environment, the trapping and concentration of pelagic planktonic biomass around seamounts, due to hydrodynamic and behavioral processes, result in local increase of predators—such as fish and marine mammals (Klimley, Richert & Jorgensen, 2005;
Morato et al., 2008;Morato et al., 2010). Thus, seamounts are ecological hotspots in the sense that many biological and physical processes combine to produce high benthic and pelagic biomass, and higher biodiversity. Seamounts are productive—their shallow summits have been fished for centuries and the biomass of zooplankton is unusually high, but debate remains over the mechanism of pelagic biomass enrichment. A commonly cited hypothesis is that zooplankton and fish productivity result from phytoplankton growth due to topographic induced upwelling of nutrients to euphotic waters, but the importance of this mechanism has been recently challenged (Genin & Dower, 2007). Seamounts harbor valuable yet slow-growing resources, such as reef-building corals (e.g., scleractinians), black corals (e.g., antipatharians), soft-corals (e.g., gorgonians), and fish, some of which can live over 100 years (e.g., orange roughy) (Koslow, 1997). These habitats, however, have been undersampled and understudied, with less than 1% of all
seamounts explored (Clark et al., 2010). The occurrence of seamounts in open oceans
beyond national jurisdiction, and advances in deep-sea fishing practices have resulted in severe anthropogenic pressure on seamount populations which, due to their life history characteristics, are among the least resilient populations in the marine environment (Koslow, 1997;Schlacher et al., 2010).
Pleuroncodes planipesStimpson, 1860 (superfamily Galatheoidea, family Muninidae,
Ahyong et al., 2010) adult crabs, also known as red crabs, tuna crabs, squat lobsters, and ‘‘langostilla’’, occur in pelagic waters and in deep continental shelf and continental slope benthic habitats. Larvae and small individuals (∼<2.6 cm standard carapace length)
tend to dominate the pelagic fraction off western Baja California, with larger organisms occurring exclusively in the benthos (Boyd, 1967).
Large individuals reproduce, but observations of pelagic ovigerous females and their larvae in waters over bathyal and abyssal depths (∼2,000–3,500 m) suggests that a fraction
sediments), phytoplankton cells, and small crustaceans, foraminiferans and radiolarians (Aurioles-Gamboa & Pérez-Flores, 1997). When feeding on bottom sediments containing diatoms, detritus and small organisms, galatheoid crabs’ ‘‘third maxillipeds . . . act as
brooms’’ (Nicol, 1932), which would disturb and resuspend fine sediment.
Most studies onPleuroncodes planipes have been done in pelagic waters, and have
provided little information on the benthic habitat. Boyd (1967)found that benthicP.
planipesranged from∼100 to 300 m water depth off western Baja California, with smaller
individuals found in shallower bottoms, and population densities up to 11/m2. These
distributions correlated with oxygen minima waters, with oxygen levels below 0.5 ml/l.
Boyd (1967) andRobinson & Gómez-Gutiérrez (1998)found that some benthic individuals tend to migrate from the bottom to the upper water column. The typical northern
geographic range end of P. planipesis somewhere in Baja California. Intermittently,
particularly during the El Niño phase of the El Niño Southern Oscillation (ENSO), its
geographic range expands northward to California (Longhurst, 1966;Smith, 1985). The
southernmost geographic end range ofP. planipesappears to be somewhere in Costa Rica
(Wicksten, 2012), where it is thought to overlap with the northern range ofPleuroncodes monodon(Macpherson et al., 2010;Wehrtmann et al., 2010;Wicksten, 2012). The center of abundance of pelagicP. planipesis in western Baja California (Longhurst, 1968;Brinton, 1979;Gómez-Gutiérrez et al., 2000). The distribution and abundance of benthicP. planipes
is not well documented, particularly south of Baja California.
We present findings from a research cruise to Hannibal Bank, a coastal seamount in the Gulf of Chiriquí, Eastern Tropical Pacific coastal ocean off Panama (Fig. 1). This cruise explored the mechanisms that contribute to high densities of benthic and pelagic organisms in an ecological hotspot and examined the seamount biodiversity and the benthic community zonation along the depth gradient. Work included (a) submarine dives to collect, film and observe firsthand the benthic habitats, and onboard DNA extractions of collected benthic invertebrates, (b) autonomous underwater vehicle (AUV) transects to map population densities of abundant benthic fauna, and (c) hydrographic and velocity measurements over the seamount using a conductivity, temperature, depth (CTD) and oxygen profiler and a hull-mounted acoustic Doppler current profiler. Hannibal seamount and its shallow top, Hannibal Bank, are within the recently created Coiba National Park, aUNESCO World Heritage Site, off the Pacific coast of Panama. Hannibal Bank harbors abundant large fish sustaining artisanal fisheries, and is a destination for international
sport fishermen. The flat-topped triangular-shaped seamount rises from 450 m to∼40 m
occupying an area of 83 km2 (Fig. 2). Proximate to the continental shelf edge, it is
∼20 km west of Coiba Island, 60 km from the main coast, and centered at about 07◦24′N,
82◦3′W (Cunningham, Guzman & Bates, 2013). Hannibal seamount communities are likely influenced by several physical processes, including synoptic upwelling from December to late April (D’Croz & O’Dea, 2007), low aragonite saturation state (Manzello et al., 2008),
low oxygen sub-thermocline waters, low salinity from runoff and precipitation (∼3 m
Figure 1 Map of the study area.The box in (B) encloses the left panel, and the small box in (A) encloses Hannibal Seamount. Bathymetry data from GEBCO.
420 300 180 60 Depth (m)
82°7.5'W 82°6.9'W 7°23.7'N
7°24.3'N
Figure 2 Hannibal Seamount, with location of the AUV transect indicated with a red line. Insert on the left delineates AUV transect, with end of transect near the blue cross.The blue cross indicates the lo-cation of the CTD cast, and the submarine positions are in white. Depth data fromCunningham, Guzman & Bates (2013).
column measurements and genetic analysis of crab samples. Here we report on these observations, and address the following questions: What is the distribution of the crabs along a transect? What are the patterns of variability in abundance within a patch? Is there a relationship between the turbid layer and the crab aggregations? Are the crabs
observed over the Hannibal Seamount the same species asPleuroncodes planipesfound off
of California?
METHODS
The cruise onboard the M/VAluciafrom 31 March to 20 April 2015 focused on Hannibal
Seamount. The ‘‘Ministerio del Ambiente de Panama’’ provided research and export permits, and the US State Department assisted in obtaining cruise permits. Work included ecological surveys over all flanks of the seamount (Fig. 2), and fifteen submarine dives conducted with Nadir, a 3-person submarine, and 11 dives with RV2, a 2-person submarine with more robust sampling capabilities than Nadir. On most missions, the submarines surveyed starting from the bottom of the seamount and continued to the top, working
in tandem, within∼150 m of each other. Twelve transects with the Seabed autonomous
underwater vehicle (AUV) complemented the diving missions and surveyed similar areas, collecting benthic imagery. On a typical cruise day, submarines were deployed during the morning and the Seabed AUV in the evening. Here we focus on observations completed on 18 and 19 April 2015, when crab aggregations were detected and studied. Further submarine and AUV observations on crabs were not possible due to technical issues and the cruise schedule. A conductivity, temperature, oxygen and depth profile was taken from
the M/VAluciausing a Seabird SBE19 plus CTD in the vicinity of the submarine dive and
Seabed AUV transect on 18 April 2015 (Fig. 2, blue cross in inset).
AUV observations and density estimation
Seabed AUV conducted transects on the seamount, and obtained images to estimate densities of bottom organisms. Designed specifically for optical imaging of the seafloor (Singh et al., 2004b), the Seabed AUV has been used extensively for coral reef ecology, and other high resolution imaging applications (Singh et al., 2004a;Williams et al., 2014).
It is equipped with high-dynamic range cameras (Singh et al., 2007) to provide species
documentation via imagery that can be corrected for the nonlinear attenuation of light in
the water. Seabed AUV navigated at a speed of∼20–25 cm/s and mean altitude of 3.5–4.5 m
above the bottom along a predefined track, adjusting its altitude using a high frequency acoustic Doppler profiler. Seabed took 1,024 by 1,380 pixel images of the seafloor that was illuminated with a strobe, and recorded temperature, conductivity, depth, and altitude. The camera pixels are square and the field of view is 45◦in the horizontal and 33◦in the vertical. Image width,x, is determined from altitude (height above bottom),z, by noting that, 0.5(x/z)=Tan(45/2) which givesx=0.828z. Because the pixels are square, the image
height,y, is proportional to the number of pixels; i.e.,y=x(1024/1380), AUV specific
altitude is used for every image, and image area is calculated asx·y.
The Seabed AUV was programmed to take photographs every∼4 s, with image overlap.
overlap. The non-analyzed images were used to resolve ambiguities in identification. Images were inspected for crabs and other organisms by eye, and all organisms were counted in each image.
Species identification of the crabs was confirmed by DNA barcoding of individuals in our samples (described below). Images from the Seabed AUV were light-corrected and inspected for organisms and type of substrate. A catalog of organisms was created from
the photographs, and each morphospecies received a code. Pleuroncodes planipes were
easily distinguished in the video recording taken from the submarine dives, and in the
Seabed AUV images. To estimate crab density (#/m2), the number of crabs was divided by
estimated image area in each photograph.
Patchiness estimate
Patchiness of Pleuroncodes planipes was estimated with Imod using the formula of Bez
(2000)modified byDécima, Ohman & De Robertis (2010). This index, based on Lloyd’s index, considers a transect that does not sample the entire range of the species:
Imod=
P i
zi2 s(P
i
zi)2
N
whereziis the density of the crabs in a given image,sis the size of the sampling unit used
in the survey (mean quadrat size, 8.93 m2), andN is the number of images analyzed. For
comparison, we also report the patchiness index of an unidentified stomatopod that was easily detected in the photographs.
Seamount sample collection and genetic barcoding
The submarines collected benthic organisms opportunistically, using a robotic manipulator arm, a net and a sediment scoop. We had a Ministerio del Ambiente de Panama permit # SE/A-18-15. Collected specimens were stored in a compartmentalized honeycomb quiver or in a larger ‘‘biobox’’. After the submarine dives, the sampled organisms were held in
chilled seawater until they were photographed and labelled (e.g.,Fig. 3B), preliminary
taxonomic identification based on morphology was made, tissue was collected, and
DNA extractions were performed onboard. Here, we focus onPleuroncodescrabs. DNA
was extracted using the DNEasy extraction kits (Qiagen) following the manufacturer’s protocol. Upon return to the laboratory at Woods Hole, we conducted a genetic barcoding analysis on the crabs. A portion of the mitochondrial cytochrome c oxidase subunit I (COI) gene was amplified by PCR using the universal HCO-2198 and LCO-1490 primers (Folmer et al., 1994). PCR conditions were: 95◦C for 3 min; 35 cycles of 95◦C for 30 s,
48◦C for 30 s, and 72◦C for 1 min; and 72◦C for 5 min. PCR products were visualized
A
B
C
D
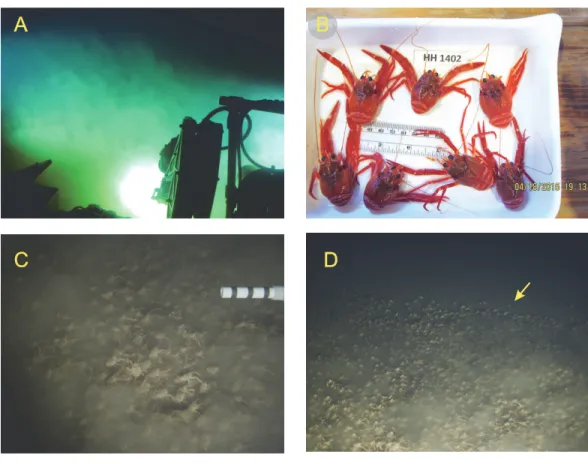
Figure 3 Photographs and video still frames ofPleuroncodes planipesand its environment.(A) Im-age taken within Nadir as it approached the bottom, from about 6 m above the bottom, whereP. planipes
aggregations were first found. (B)Pleuroncodes planipescollected from the aggregation, with ruler scale in cm and English units. (C) Still frame from HD video of a dense patch ofP. planipeson the bottom. The white PVC segment is about 20.5 cm long (D) Nearbed turbidity dropped at the edges of thePleuroncodes
patch. In the video the crabs were moving on the bottom towards the right, with a few crabs found beyond the boundary of the patch lagging behind the main aggregation. The crab marked with a yellow arrow was separate from the large patch and then merged into the patch by advancing in a direction perpendicular to the direction of patch movement.
from California for comparison (collection details below). Hannibal and California crab
sequences were aligned with ClustalW (Larkin et al., 2007) using default parameters.
The ends of the alignment were trimmed so that the dataset was complete for all taxa.
Uncorrectedpand Kimura 2-parameter distances were calculated and a neighbor-joining
tree was constructed in PAUP* (Swofford, 2003).
Sample collection in a mass stranding event
From January to August 2015 there were several mass stranding events of Pleuroncodes
RESULTS
Submarine observations and AUV mission
On the last diving mission of the cruise, 18 April 2015, the two submarines dived to the
bottom by the Northwestern flank of the seamount (Fig. 2). Upon approaching the bottom,
a very dense cloud of sediment was encountered; on no other submarine or AUV dive
had such a dense cloud been observed (Fig. 3A). Altitude soundings from the submarine
indicated that the turbid cloud extended 4–10 m over the ocean floor. As the submarine approached the bottom, a large number of galatheoid crabs were encountered. RV2 took 13 min and 40 s high-definition video of the crabs. A few still photographs and other video were taken from within the Nadir.
The video clips and photographs show that crabs were sometimes interacting among themselves (e.g., facing each other pulling out a dead crab) and with other organisms, including a sand eel. In some footage, crabs were sparsely distributed, and appeared to be sedentary. In other footage, benthic crabs were very dense, touching adjacent crabs, with most crabs moving broadly in the same direction (Figs. 3Cand3D) as a swarm (Video S1). In this footage, some crabs jumped and swam a few 10s of cm and landed in another spot.
A crab outside of the patch moved towards, and merged with the main patch (Fig. 3D).
Sand eel, small pelagic fish, shrimp, and a few stomatopods were in close proximity to the crab aggregation.
The population observed in the footage was composed of relatively large crabs, with no visible smaller individuals, i.e.,∼<2.3 cm carapace length. (See Fig. 3Bfor typical
crabs, with∼2.7 cm carapace length; carapace length as measured byGómez-Gutiérrez et
al., 2000). For most of the footage, the submarine hovered 2–3 m above the bottom, and the submarine and its lights did not appear to affect the behavior of the crabs. The high turbidity immediately above the bottom extended horizontally for at least 10s of m, and the turbid cloud appeared to be associated with the crab patch. As the two submarines moved up the seamount slope and abandoned the patch, the density of crabs decreased abruptly, and the turbid cloud disappeared (Fig. 3D).
On 19 April 2015, the Seabed AUV was programmed to complete a photo-transect in the same region as the crabs seen on 18 April. The AUV dived to about 325 m, and then completed a 1,610 m transect which included a set of turns to avoid potential high risk areas (e.g., rocky pinnacles) (Fig. 2, inset). Mean image width and length for this transect were
3.46 and 2.57 m, yielding a mean area per image of 8.93 m2(n=580). Mean AUV altitude
and speed was 4.18 m, and 0.23 m/s. The 580 analyzed photos were taken at 12 s intervals,
and consecutive images had a gap of 2.78–2.57=0. 21 m. (SeeFig. 4 for an image from
the AUV, with the highest density of crabs detected in the transect, 77.2 individuals/m2).
At depths in the region where crab swarms were observed (∼355–385 m, Northwest
Figure 4 AUV photograph with the highest density ofPleuroncodes planipes.
Figure 5 Frequency distribution of quadrats with null and positivePleuroncodes planipescounts.No
P. planipesoccurred in null quadrats, whereas positive quadrats are those in which at least oneP. planipes
Table 1 Pairwise distance comparisons for uncorrectedpand K2P distance metrics.Minimum and maximum pairwise distances (for all com-parisons) and the mean distances for pairs within and between sampling localities are shown.
Minimum Maximum Within—Hannibal mean Within—California mean Hannibal—California mean
Uncorrectedp 0.00168 0.01513 0.01042 0.00336 0.00732
K2P 0.00168 0.01536 0.01055 0.00337 0.00734
Pleuroncodes planipes abundance
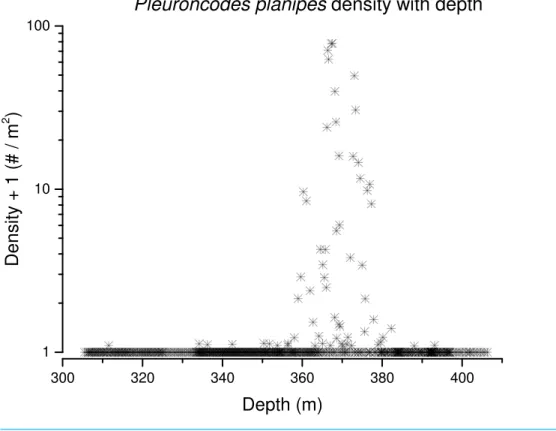
Pleuroncodes planipeswere detected in 12.2% of the Seabed AUV photographs. Images with counts ofP. planipestended to center around 365 m water depth (Fig. 5). Crabs were rare in the shallowest and deepest images, with bins centered at 305 and 405 m, although the
number of images from these depths was low. Peak densities, with up to 72.2 crabs/m2,
occurred at 360–380 depths (Fig. 7). Three high-density patches were constrained to depths
between 362 and 381 m (Fig. 8A), and were separated from each other by over 100’s of
meters along the northing (latitudinal) axis (Fig. 8B). The distribution of abundance in these peaks indicates that densities were low at the periphery, and that the maxima densities occur near the middle of the patch (Fig. 9). The distribution of crabs along the transect
was very patchy, with Imod=5.34. Unidentified stomatopods that always occurred as
singletons in the images had Imod=3.54. The turbid layer was not apparent in the Seabed
AUV images.
Galatheoid crabs DNA barcode ID
We obtained COI sequences for 6 specimens from Hannibal seamount and 4 specimens
from the Pleuroncodes planipes stranding in California. Sequences were deposited
in GenBank (Hannibal, KU179422, KU179423, KU179424, KU179425, KU179426,
KU179431; La Jolla, KU179427,KU179428,KU179429,KU179430). Five out of the 6 Hannibal specimens were obtained from the main crab swarm on 18 April 2015. The 6th specimen was obtained on 3 April 2015, at a depth of 278 m, when crabs were observed on the bottom at the Northwest flank of the seamount (near 7◦21.21′N, 82◦1.37′W) at low densities. The final alignment for the combined seamount and California dataset was 595 base pairs. Inspection of the amino acid translation indicated that the sequences did not represent pseudogenes. Sequences differed from each other by between 1–8 base pairs.
Uncorrectedpand Kimura 2-parameter distances were similar to each other and ranged
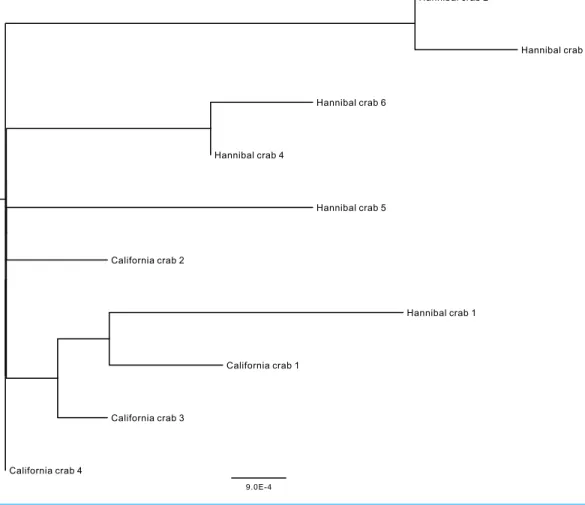
from 0.00168–0.01363. There were no shared haplotypes and the mean pairwise distance (for both metrics) between Hannibal specimens was greater than the mean distance between Hannibal and California specimens (Table 1andFig. 6).
Water properties
The CTD cast revealed strong temperature, salinity, and oxygen stratification (Fig. 10). The temperature profile showed a sharp thermocline in the upper 40 m, with a temperature
drop from 28.5◦C at the surface to 17.4◦C at 40 m, and a near-bottom temperature of
11.1◦C at
∼365 m. A halocline was also observed, with a salinity drop from 33.4 psu at the
Figure 6 Midpoint-rooted neighbor-joining topology based on mt COI Kimura 2-parameter distances.Crab number 5 was found on 3 April at another location on Hannibal seamount, and was not in an aggregation.
Oxygen concentration decreased rapidly with depth, from over 4.8 ml/l at the surface to 1.1 ml/l at 50 m, and was less than 1.0 ml/l deeper than 250 m. The lowest oxygen value,
0.04 ml/l, was obtained from the deepest measurement, 365 m,∼15 m above the bottom.
Thus, Pleuroncodes planipesmaximum densities occurred at depths where waters were
oxygen depleted. The vertical gradients of temperature and oxygen concentration changed abruptly at about 238 m, with larger gradients seen below 238 m. The vertical salinity also changed at around 238 m, but more subtly. Beam attenuation data from the SBE CTD revealed a turbid layer around 365 m depth in which optical attenuation tripled.
DISCUSSION
Based on DNA barcoding, the Hannibal seamount crabs appear to be the same species asPleuroncodes planipesfrom California. COI is the most typically used species barcode gene (Bucklin, Steinke & Blanco-Bercial, 2011), and sequence comparisons are frequently
based on Kimura 2-parameter (K2P) distances (Da Silva et al., 2011). K2P distances may
not necessarily be the best distance metric for a given taxon (Srivathsan & Meier, 2012;
300 320 340 360 380 400 1
10 100
Pleuroncodes planipes
density with depth
D
e
n
s
it
y
+
1
(
#
/
m
2
)
Depth (m)
Figure 7 Pleuroncodes planipesdensity with depth.
use of this metric permits straightforward comparisons with K2P distances from studies.
Uncorrectedpdistances were similar to the K2P distances, and in both metrics, the mean
distance between individuals at Hannibal Seamount was greater than the mean distance between Hannibal Seamount and California. Pairwise mitochondrial COI distances fell within the range of typical intraspecific distances for galatheoids (Da Silva et al., 2011). The southern range limit ofP. planipesis considered poorly known (Hendrickx & Harvey, 1999),
although researchers have suggested Costa Rica (Wicksten, 2012), and our observations
here, supported by DNA sequences, may be the southernmost record.
Species have distinct patterns of variation in abundance over space, and understanding the factors that determine these patterns and their diversity is a central goal in ecology. Spatial distribution patterns may reflect individual and population processes, including settlement, dispersal, migration (Roa & Tapia, 2000) and behavior. For example, gregarious behavior and swarming in insects may produce characteristic spatial patterns of abundance (Okubo & Chiang, 1974). Whereas practically all organisms have patchy distributions at some spatial scale of observation, the causes and consequences of patchiness can reflect fundamental ecological and life history characteristics (Marquet et al., 1993). For example,
patchiness can be species-specific and vary ontogenetically (Hewitt, 1981;Décima, Ohman
Figure 8 Along transectPleuroncodes planipesdensity on depth (A), and 3-d plot of density with lati-tude and longilati-tude.Arrow in (B) indicates the direction of the transect.
swimming up response of zooplankton and larvae to downwelling currents (Scotti &
Pineda, 2007), might also produce patchiness (e.g., aggregation at fronts), and explain why only certain taxa aggregate in particular hydrodynamic settings.
The distribution ofPleuroncodes planipeswas highly patchy, similar to other galatheoid populations (Freire, González-Gurriarán & Olaso, 1992; Roa & Tapia, 2000), and Imod
values were higher than those of a stomatopod that occurred at smaller densities than
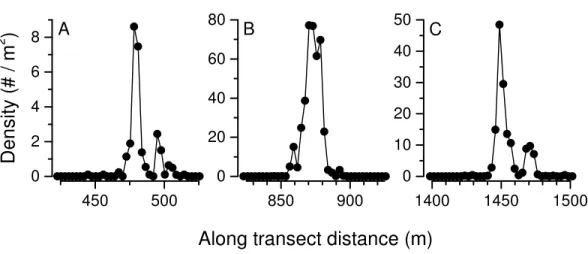
Figure 9 Pleuroncodes planipesabundance distribution in each of the three density peaks inFig. 8. For peak correspondence, see along transect distance and maximum density.
sites) and the 12 AUV transects, we observed dense aggregations of crabs in only one region,
the Northwestern flank of the seamount, and these aggregations were constrained to∼355–
385 m water depths. The AUV survey detected three peaks in abundance (Figs. 9A–9C),
and in peak B, the observed density was 77 individuals/m2, one of the highest that have been
measured for galatheoid crabs (Lovrich & Thiel, 2011, Table 6.1). Our sampling protocol cannot resolve whether these density peaks are discrete patches or whether aggregations were connected. It is unlikely, however, that crabs in density peak C were connected to crabs in peak B, because crab distributions were observed to be constrained to 355–385 m, and the crabs in B and C were separated by shallower depths (Figs. 2and8).
The density distribution within each of the three abundance peaks detected in the survey is consistent with a pattern where density increases towards the center of distribution (Fig. 9). However, we do not know whether the AUV surveyed the center of the patch. The two high-density peaks at∼480 and 1,440 m along the transect (Figs. 9Aand9C) each have
an adjoining lower-density peak. These lower-density peaks may represent budding, small aggregations that have split from the main aggregation, and might grow into larger patches, or they might merge into the larger, adjacent patch. These density distribution patterns are likely due to aggregation driven by the crab’s gregarious behavior, and coordinated
movement of the aggregation, a phenomenon that has been called swarming. Okubo,
Grünbaum & Edelstein-Keshet (2001)describe swarming as a phenomenon where a group of organisms move together. Swarms are arguably one of the few ecological phenomena that possess emergent properties, where the characteristics of the aggregation cannot be simply explained by adding the individual’s behaviors (Parrish & Edelstein-Keshet, 1999). In these complex systems, a focus on individual behavior is unlikely to explain the properties of the swarm. Whether all emergent properties in swarms are functional or not, is an open question (Parrish & Edelstein-Keshet, 1999). The increase in density towards the center is consistent with other organisms that form swarms and aggregations (e.g., insects, krill and schooling fish, Okubo & Chiang, 1974;Okubo, Grünbaum & Edelstein-Keshet,
2001), and patterns of abundance in other gregarious benthic populations where density
increases towards the middle of the distribution might reveal a swarming behavior. Two other galatheoid species have patterns where density increases towards the middle of the patch (Freire, González-Gurriarán & Olaso, 1992) but in these EuropeanMunidaspp. species, the scale of the patches is a few tens of kilometers, compared to the∼100 m scale
observed in our study. It is unclear whether the abundance structure of these Munida
spp. and Pleuroncodes planipespatches are caused by the same processes. Dense benthic
aggregations of other species of anomuran and brachyuran crabs (king crabs, spider crabs, tanner crabs, lyre crabs) have been observed, and some were related to reproduction (Powell & Nickerson, 1965;DeGoursey & Auster, 1992;Stevens, Donaldson & Haaga, 1992;Stevens, Haaga & Donaldson, 1994).
Crabs densities appeared to be higher and more clumped in the submarine video
observations than in the AUV images (compare submarine video still frame Fig. 3with
motion were not obvious. Moreover, the turbid cloud observed from the submarine (Fig. 3) was not seen in any of the AUV images. The turbidity cloud was most likely produced by
P. planipesactivities, as the turbidity disappeared at the edge of the patch, and was not observed outside of the patch or in any other submarine dive or AUV missions. Diurnal patterns of activity might explain the differences in turbidity. Submarine observations were early in the day, whereas the AUV survey was done in the evening. However, another possibility is that crabs observed from the submarine were in a location with finer, and hence more easily suspended sediments than those surveyed by the AUV survey. However, the locations were not far from each other (Fig. 2).
The resuspension of sediment initiated by crab activity may affect the benthic
environment over the Northwest seamount flank. Feeding of king crabs in waters∼3 m
deep off Kodiak Island, Alaska, resulted in a dense cloud of turbid water (Stevens & Jewett,
2014), andYahel et al. (2008)found that bottom fish activity was an important mechanism
for sediment resuspension and remineralization of organic matter between water depths
of∼60 and 140 m in Saanich Inlet (Vancouver Island, BC, Canada).
Pleuroncodes planipesoccurred at water depths with very low oxygen (0.04 ml/l at∼15 m
above the bottom where the crabs were observed). The affinity of some galatheoids to low oxygen waters, andP. planipesin particular, is known (Boyd, 1967;Lovrich & Thiel, 2011). Depth distribution ofP. planipesand other galatheoids might be related to these low oxygen levels (discussed byLovrich & Thiel, 2011), but more study is needed to test this hypothesis.
Pleuroncodes planipesoccurs in very high densities in the pelagic environment, and this species mass strands yearly in shallow water and intertidal beaches near the center of its
pelagic abundance, Bahía Magdalena, Baja California (Aurioles-Gaamboa, Castro-González
& Pérez-Flores, 1994), and more occasionally on California beaches (Table 1,Longhurst, 1966;Smith, 1985). While we were on hydrographic stations over Hannibal seamount and surrounding areas, we occasionally observed organisms that appeared to be pelagic red crabs swimming swiftly by the stern of the boat at night, illuminated by the vessel lights. Despite multiple attempts, we were not able to capture a specimen to assess its identity, so
the occurrence ofP. planipesin the water column above Hannibal seamount is unknown.
Our observations in Panama were conducted at roughly the same time when mass
stranding events were registered in Southern California (Table S1), and the Hannibal and
Californian individuals appear to be the same species based on their mtCOI sequences.
Mass stranding ofPleuroncodes planipesin Southern California beaches has been linked to
El Niño (Smith, 1985). A full El Niño had not been declared for January–June 2015, when
many stranding events were reported (Table S1). On the other hand, an unusually large
pool of warm water developed in late 2013 and early 2014 in the coastal temperate eastern Pacific, and persisted through much of 2015 (Bond et al., 2015), apparently unrelated to El
Niño. The current forecast (February 2015, by NOAAClimate Prediction Center), indicate
that the anomalous warm-water pool condition has been followed by an El Niño, and that a full El Niño is currently in progress. The ‘‘pool of warm water’’ conditions in January–June 2015 may be related to anomalously warm waters observed in Southern California’s nearshore in fall 2014 (N Reyns, J Pineda & S Lentz, pers. obs., 2015). These conditions
some news outlets. Whereas it is unlikely that our observations of benthic aggregations at Hannibal are connected with the California mass stranding events, it is significant thatP. planipescan be simultaneously abundant at the two distant locations and at two different habitats. The high densities ofP. planipeslikely impacted local pelagic, intertidal, and deep seamount food webs.
Allochthonous supply of biomass, where resources from one habitat or ecosystem
subsidizes another system, influences local population community and dynamics (Polis,
Anderson & Holt, 1997). Moreover, the episodic availability of large quantities of biomass to benthic and pelagic organisms and marine mammals, including the supply of terrestrial material and whale carcasses to benthic deep sea communities, the mass stranding of pelagic organisms in shallow habitats, and the sudden availability of a new resource, represent an opportunistic yet important source of nutrition to the ‘‘receiving’’ communities (Polis, Anderson & Holt, 1997), and can influence food web structure and demographic rates (Watt, Siniff & Estes, 2000). The massive availability ofPleuroncodes planipesmight influence diverse food webs.
Because of its pelagic and benthic lifestyle, and its abundance,Pleuroncodes planipeslikely plays an important role in some seamount, continental shelf and shallow water food webs in the subtropical and subtemperate eastern Pacific. Several authors have noticed the key role ofP. planipesin the pelagic environment, by virtue of its abundance and trophic role (Alverson, 1963;Longhurst, 1966;Longhurst, Lorenzen & Thomas, 1967;Gómez-Gutiérrez et al., 2000;Robinson, Anislado & Lopez, 2004).P. planipeswas patchy but very abundant at Hannibal, and it might represent an important resource for pelagic predators at the
seamount. More research is needed to assess the distribution and abundance of benthicP.
planipes, as well as its potentially key role in subtropical and subtemperate eastern Pacific seamount and continental shelf habitats.
ACKNOWLEDGEMENTS
We would like to express gratitude for the help and logistical support of the Captain and
the crew of the M/VAlucia, theAlucia’s submarine team, Jeff Anderson, for programming
and running the AUV operations, and keeping it safe, Alex Bocconcelli, WHOI’s Marine Operations office support, and S Searcy (USD) for red crab stranding information in San
Diego. Bathymetric data inFig. 1derived from the GEBCO_2014 Grid,www.gebco.net.
ADDITIONAL INFORMATION AND DECLARATIONS
Funding
This work was sponsored by a grant from the Dalio Foundation, Inc, through the Woods Hole Oceanographic Institution. The funders had no role in study design, data collection and analysis, decision to publish, or preparation of the manuscript.
Grant Disclosures
Competing Interests
The authors declare there are no competing interests.
Author Contributions
• Jesús Pineda conceived and designed the experiments, performed the experiments,
analyzed the data, contributed reagents/materials/analysis tools, wrote the paper, prepared figures and/or tables, reviewed drafts of the paper.
• Walter Cho and Annette F. Govindarajan conceived and designed the experiments,
performed the experiments, analyzed the data, contributed reagents/materials/analysis tools, prepared figures and/or tables, reviewed drafts of the paper.
• Victoria Starczak, Héctor M. Guzman, Rusty C. Holleman and James Churchill conceived
and designed the experiments, performed the experiments, reviewed drafts of the paper.
• Yogesh Girdhar conceived and designed the experiments, performed the experiments,
contributed reagents/materials/analysis tools, reviewed drafts of the paper.
• Hanumant Singh contributed reagents/materials/analysis tools.
• David K. Ralston reviewed drafts of the paper.
Field Study Permissions
The following information was supplied relating to field study approvals (i.e., approving body and any reference numbers):
The Ministerio del Ambiente de Panama provided permission (# SE/A-18-15).
DNA Deposition
The following information was supplied regarding the deposition of DNA sequences: GenBank (numbers also listed in the paper):
Pplanipes.sqn Hannibal_1402aKU179422
Pplanipes.sqn Hannibal_1402bKU179423
Pplanipes.sqn Hannibal_1402cKU179424
Pplanipes.sqn Hannibal_1402dKU179425
Pplanipes.sqn Hannibal_1402eKU179426
Pplanipes.sqn CAcrab1KU179427
Pplanipes.sqn CAcrab2KU179428
Pplanipes.sqn CAcrab3KU179429
Pplanipes.sqn CAcrab4KU179430
Pplanipes.sqn Hannibal_1051KU179431.
Data Availability
The following information was supplied regarding data availability:
The raw data has been supplied asData S1andS2.
Supplemental Information
REFERENCES
Ahyong ST, Baba K, Macpherson E, Poore GC. 2010.A new classification of the
Galatheoidea (Crustacea: Decapoda: Anomura).Zootaxa2676:57–68.
Alverson F. 1963.The food of yellowfin and skipjack tunas in the eastern tropical Pacific
Ocean.Inter-American Tropical Tuna Commission Bulletin7:295–367.
Aurioles-Gaamboa D, Castro-González MI, Pérez-Flores R. 1994.Annual mass
strand-ings of pelagic red crabs,Pleuroncodes planipes(Crustacea, Anomura, Galatheidae),
in Bahia Magdalena, Baja California Sur, Mexico.Fishery Bulletin92:464–470.
Aurioles-Gamboa D, Pérez-Flores R. 1997.Seasonal and bathymetric changes in
feeding habits of the benthic red crabPleuroncodes planipes(Decapoda, Anomura,
Galatheidae) off the Pacific coast of Baja California Sur, Mexico.Crustaceana
70:272–287DOI 10.1163/156854097X00573.
Bez N. 2000.On the use of Lloyd’s index of patchiness.Fisheries Oceanography
9:372–376DOI 10.1046/j.1365-2419.2000.00148.x.
Bond NA, Cronin MF, Freeland H, Mantua N. 2015.Causes and impacts of the 2014
warm anomaly in the NE Pacific.Geophysical Research Letters42: 2015GL063306
DOI 10.1002/2015GL063306.
Boyd CM. 1967.The benthic and pelagic habitats of red crabPleuroncodes planipes.
Pacific Science21:394–403.
Brinton E. 1979.Parameters relating to the distributions of planktonic organisms,
especially Euphausiids in the eastern tropical Pacific.Progress in Oceanography
8:125–189DOI 10.1016/0079-6611(79)90001-6.
Bucklin A, Steinke D, Blanco-Bercial L. 2011.DNA barcoding of marine metazoa.
Annual Review of Marine Science3:471–508 DOI 10.1146/annurev-marine-120308-080950.
Clark MR, Rowden AA, Schlacher T, Williams A, Consalvey M, Stocks KI, Rogers
AD, O’Hara TD, White M, Shank TM, Hall-Spencer JM. 2010.The ecology of
seamounts: structure, function, and human impacts.Annual Review of Marine
Science2:253–278DOI 10.1146/annurev-marine-120308-081109.
Collins R, Cruickshank R. 2013.The seven deadly sins of DNA barcoding.Molecular
Ecology Resources13:969–975DOI 10.1111/1755-0998.12046.
Cunningham SL, Guzman HM, Bates RC. 2013.The morphology and structure of the
Hannibal Bank fisheries management zone, Pacific Panama using acoustic seabed
mapping.Revista de Biologia Tropical61:1967–1979.
Dagg M. 1977.Some effects of patchy food environments on copepods.Limnology and
Oceanography 22:99–107DOI 10.4319/lo.1977.22.1.0099.
Dana TF. 1975.Development of contemporary Eastern Pacific coral reefs.Marine Biology
33:355–374DOI 10.1007/BF00390574.
Da Silva JM, Creer S, Dos Santos A, Costa AC, Cunha MR, Costa FO, Carvalho GR.
2011.Systematic and evolutionary insights derived from mtDNA COI barcode
diversity in the Decapoda (Crustacea: Malacostraca).PLoS ONE6:e19449
D’Croz L, O’Dea A. 2007.Variability in upwelling along the Pacific shelf of Panama and implications for the distribution of nutrients and chlorophyll.Estuarine, Coastal and Shelf Science73:325–340DOI 10.1016/j.ecss.2007.01.013.
Décima M, Ohman MD, De Robertis A. 2010.Body size dependence of euphausiid
spatial patchiness.Limnology and Oceanography55:777–788
DOI 10.4319/lo.2009.55.2.0777.
DeGoursey RE, Auster PJ. 1992.A mating aggregation of the spider crab (Libinia
emarginata).Journal of Northwest Atlantic Fishery Science13:77–82 DOI 10.2960/J.v13.a6.
Folmer O, Black M, Hoeh W, Lutz RA, Vrijenhoek R. 1994.DNA primers for
ampli-fication of mitochondrial cytochromecoxidase subunit I from diverse metazoan
invertebrates.Molecular Marine Biology and Biotechnology3:294–299.
Freire J, González-Gurriarán E, Olaso I. 1992.Spatial distribution ofMunida intermedia
andM. sarsi(Crustacea: Anomura) on the Galician continental shelf (NW Spain): application of geostatistical analysis.Estuarine, Coastal and Shelf Science35:637–648 DOI 10.1016/S0272-7714(05)80044-7.
Genin A, Dower JF. 2007. Seamount plankton dynamics. In: Pitcher T, Morato T, Hart
P, Clark M, Haggan N, Santos R, eds.Seamounts: ecology, fisheries, and conservation. Oxford: Blackwell, 85–100.
Gómez-Gutiérrez J, Domínguez-Hernández E, Robinson CJ, Arenas V. 2000.
Hydroa-coustical evidence of autumn inshore residence of the pelagic red crabPleuroncodes
planipesat Punta Eugenia, Baja California, Mexico.Marine Ecology Progress Series
208:283–291DOI 10.3354/meps208283.
Hendrickx ME, Harvey AW. 1999.Checklist of anomuran crabs (Crustacea: Decapoda)
from the eastern tropical Pacific.Belgian Journal of Zoology 129:363–389.
Hewitt R. 1981.The value of pattern in the distribution of young fish.Rapports et
Proces-Verbaux des Reunions Conseil International pour l’Exploration de la Mer 178:229–236.
Hutchinson GE. 1953.The concept of pattern in ecology.Proceedings of the Academy of
Natural Sciences of Philadelphia105:1–12.
Klimley A, Richert JE, Jorgensen SJ. 2005.The home of blue water fish.American
Scientist 93:42–49DOI 10.1511/2005.51.954.
Koslow JA. 1997.Seamounts and the ecology of deep-sea fisheries.American Scientist
85:168–176.
Larkin MA, Blackshields G, Brown N, Chenna R, McGettigan PA, McWilliam H,
Valentin F, Wallace IM, Wilm A, Lopez R. 2007.Clustal W and Clustal X version
2.0.Bioinformatics23:2947–2948DOI 10.1093/bioinformatics/btm404.
Longhurst AR. 1966.The pelagic phase ofPleuroncodes planipesStimpson (Crustacea,
Galatheidae) in the California Current.CalCOFI ReportsXI:142–154.
Longhurst AR. 1968. The biology of mass occurrences of Galatheid crustaceans and
Longhurst AR, Lorenzen CJ, Thomas WH. 1967.The role of pelagic crabs in the grazing
of phytoplankton off Baja California.Ecology48:190–200 DOI 10.2307/1933100.
Longhurst AR, Seibert DLR. 1971.Breeding in an oceanic population ofPleuroncodes
planipes(Crustacea, Galatheidae).Pacific Science25:426–428.
Lovrich GA, Thiel M. 2011. Ecology, physiology, feeding and trophic role of squat
lobsters. In: Poore GCB, Ahyong ST, Taylor J, eds.The biology of squat lobsters. Boca Raton: CRC Press 183–222.
Macpherson E, De Forges BR, Schnabel K, Samadi S, Boisselier MC, Garcia-Rubies
A. 2010.Biogeography of the deep-sea galatheid squat lobsters of the Pacific
Ocean.Deep-Sea Research Part I-Oceanographic Research Papers57:228–238
DOI 10.1016/j.dsr.2009.11.002.
Manzello DP, Kleypas JA, Budd DA, Eakin CM, Glynn PW, Langdon C. 2008.Poorly
cemented coral reefs of the eastern tropical Pacific: possible insights into reef
development in a high-CO2world.Proceedings of the National Academy of Sciences
of the United States of America105:10450–10455DOI 10.1073/pnas.0712167105. Marquet P, Fortin MJ, Pineda J, Wallin DO, Clark J, Wu Y, Bollens S, Jacobi C, Holt
RD. 1993. Ecological and evolutionary consequences of patchiness: a
marine-terrestrial perspective. In: Levin SA, Powell TM, Steele JH, eds.Patch dynamics. Berlin: Springer-Verlag, 277–304.
Morato T, Hoyle SD, Allain V, Nicol SJ. 2010.Seamounts are hotspots of pelagic
biodiversity in the open ocean.Proceedings of the National Academy of Sciences of the United States of America107:9707–9711DOI 10.1073/pnas.0910290107.
Morato T, Varkey DA, Damaso C, Machete M, Santos M, Prieto R, Santos RS, Pitcher
TJ. 2008.Evidence of a seamount effect on aggregating visitors.Marine Ecology
Progress Series357:23–32DOI 10.3354/meps07269.
Nicol EAT. 1932.The feeding habits of the Galatheidae.Journal of the Marine Biological
Association of the United Kingdom18:87–106 DOI 10.1017/S0025315400051316.
Okubo A, Chiang HC. 1974.An analysis of the kinematics of swarming ofAnarete
pritchardiKim (Diptera: Cecidomyiidae).Researches on Population Ecology16:1–42 DOI 10.1007/BF02514077.
Okubo A, Grünbaum D, Edelstein-Keshet L. 2001. The dynamics of animal grouping.
In: Levin SA, ed.Diffusion and ecological problems: modern perspectives. New York: Springer, 197–237.
Parrish JK, Edelstein-Keshet L. 1999.Complexity, pattern, and evolutionary trade-offs
in animal aggregation.Science284:99–101 DOI 10.1126/science.284.5411.99.
Pineda J, Reyns N, Starczak VR. 2009.Complexity and simplification in understanding
recruitment in benthic populations.Population Ecology 51:17–32
DOI 10.1007/s10144-008-0118-0.
Pitcher TJ, Morato T, Hart PJ, Clark MR, Haggan N, Santos RS. 2008.Seamounts:
ecology, fisheries & conservation. Oxford: Blackwell Publishing.
Polis GA, Anderson WB, Holt RD. 1997.Toward an integration of landscape and food
web ecology: the dynamics of spatially subsidized food webs.Annual Review of
Powell GC, Nickerson RB. 1965.Aggregations among juvenile king crabs (Paralithodes camtschatica, Tilesius) Kodiak, Alaska.Animal Behaviour13:374-IN310.
Roa R, Tapia F. 2000.Cohorts in space: geostatistical mapping of the age structure of
the squat lobsterPleuroncodes monodonpopulation off central Chile.Marine Ecology
Progress Series196:239–251DOI 10.3354/meps196239.
Robinson CJ, Anislado V, Lopez A. 2004.The pelagic red crab (Pleuroncodes planipes)
related to active upwelling sites in the California Current off the west coast of Baja California.Deep Sea Research Part II: Topical Studies in Oceanography51:753–766 DOI 10.1016/j.dsr2.2004.05.018.
Robinson CJ, Gómez-Gutiérrez J. 1998.The red-crab bloom off the west coast of Baja
California, Mexico.Journal of Plankton Research20:2009–2016
DOI 10.1093/plankt/20.10.2009.
Schlacher TA, Rowden AA, Dower JF, Consalvey M. 2010.Seamount science
scales undersea mountains: new research and outlook.Marine Ecology 31:1–13
DOI 10.1111/j.1439-0485.2010.00396.x.
Scotti A, Pineda J. 2007.Plankton accumulation and transport in propagating nonlinear
internal fronts.Journal of Marine Research65:117–145 DOI 10.1357/002224007780388702.
Singh H, Armstrong R, Gilbes F, Eustice R, Roman C, Pizarro O, Torres J. 2004a.
Imaging coral I: imaging coral habitats with the SeaBED AUV.Subsurface Sensing
Technologies and Applications5:25–42DOI 10.1023/B:SSTA.0000018445.25977.f3.
Singh H, Can A, Eustice R, Lerner S, McPhee N, Roman C. 2004b.Seabed AUV offers
new platform for high-resolution imaging.Eos, Transactions American Geophysical
Union85:289–296.
Singh H, Roman C, Pizarro O, Eustice R, Can A. 2007.Towards high-resolution imaging
from underwater vehicles.The International Journal of Robotics Research26:55–74 DOI 10.1177/0278364907074473.
Smith PE. 1985. A case history of an anti-Niño transition plankton and nekton
distribu-tion and abundances. In: Wooster WS, David LF, eds.El Niño North: Niño effects in
the eastern subarctic Pacific Ocean. Seattler: Washingthon Sea Grant, 121–142.
Srivathsan A, Meier R. 2012.On the inappropriate use of Kimura-2-parameter
(K2P) divergences in the DNA-barcoding literature.Cladistics28:190–194
DOI 10.1111/j.1096-0031.2011.00370.x.
Starczak VR, Pérez-Brunius P, Levine HE, Gyory J, Pineda J. 2011.The role of season
and salinity in influencing barnacle distribution in two adjacent coastal mangrove
lagoons.Bulletin of Marine Science87:275–299DOI 10.5343/bms.2010.1022.
Stevens BG, Donaldson WE, Haaga JA. 1992.First observations of podding behavior for
the Pacific Lyre crabHyas lyratus(Decapoda: Majidae).Journal of Crustacean Biology
12:193–195DOI 10.2307/1549074.
Stevens BG, Haaga JA, Donaldson WE. 1994.Aggregative mating of Tanner crabs,
Stevens BG, Jewett SC. 2014. Growth, molting, and feeding of king crabs. In: Bradley GS, ed.King crabs of the world biology and fisheries management. Boca Raton: CRC Press, 315–362.
Swofford DL. 2003.PAUP*. Phylogenetic analysis using parsimony (*and other methods).
Version 4. Sunderland: Sinauer Associates.
Thresher R, Althaus F, Adkins J, Gowlett-Holmes K, Alderslade P, Dowdney J, Cho
W, Gagnon A, Staples D, McEnnulty F. 2014.Strong depth-related zonation
of megabenthos on a rocky continental margin (∼700–4,000 m) off southern
Tasmania, Australia.PLoS ONE 9:e85872DOI 10.1371/journal.pone.0085872.
Watt J, Siniff DB, Estes JA. 2000.Inter-decadal patterns of population and
di-etary change in sea otters at Amchitka Island, Alaska.Oecologia124:289–298 DOI 10.1007/s004420000373.
Wehrtmann IS, Herrera-Correal J, Vargas R, P H. 2010.Squat lobsters (Decapoda:
Anomura: Galatheidae) from deepwater Pacific Costa Rica: species diversity, spatial
and bathymetric distribution.Nauplius18:69–77.
Wessel P, Sandwell DT, Kim SS. 2010.The global seamount census.Oceanography
23:24–33DOI 10.5670/oceanog.2010.60.
Wicksten MK. 2012.Decapod Crustacea of the Californian and Oregonian
zoogeo-graphic provinces.Zootaxa3371:1–307.
Williams G, Maksym T, Wilkinson J, Kunz C, Murphy C, Kimball P, Singh H. 2014. Thick and deformed Antarctic sea ice mapped with autonomous underwater
vehicles.Nature Geoscience8:61–67DOI 10.1038/ngeo2299.
Yahel G, Yahel R, Katz T, Lazar B, Herut B, Tunnicliffe V. 2008.Fish activity: a